 🏗️ New Construction
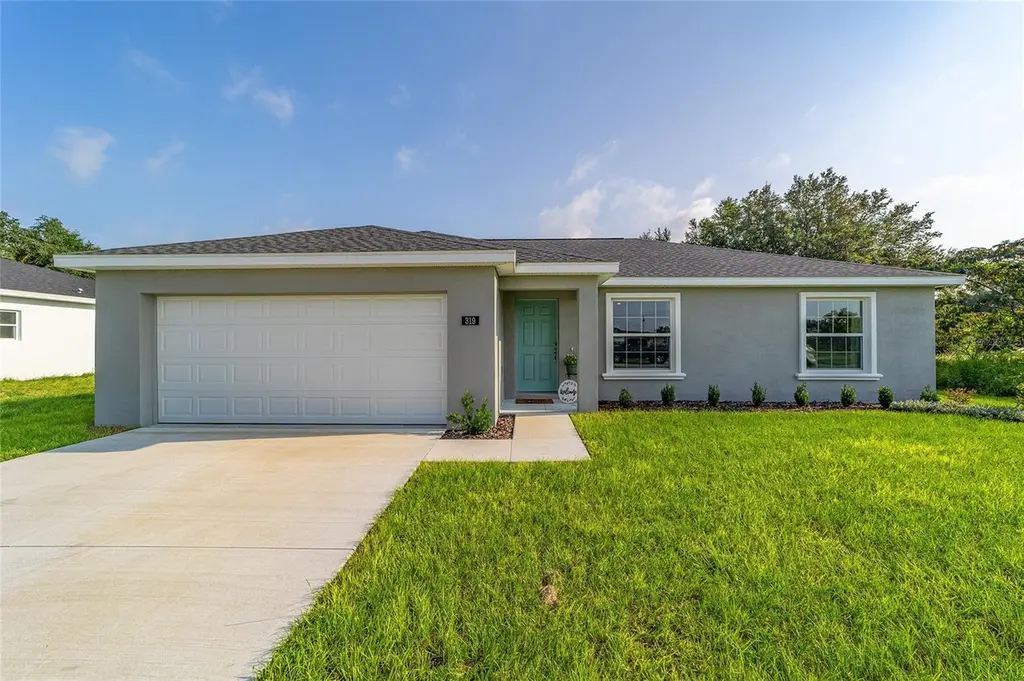
3103 SW 130th Ln · Marion Oaks, FL
Flood risk 1/10 · Minimal
- FEMA flood zone
- X (unshaded)
- Chance of flooding over 30 yrs
- 0.0%
- Est. flood insurance / yr
- $507 – $1,088
Fire risk 5/10 · Moderate
- Est. fire insurance / yr
- $947 – $1,759
Heat risk 8/10 · Major
- Hot days now (above 108°F)
- 7 days/yr
- Hot days in 30 yrs
- 22 days/yr
Wind risk 9/10 · Severe
- Chance of severe wind over 30 yrs
- 99.0%
Air-quality risk 3/10 · Minor
- Unhealthy air days now
- 2 days/yr
- Unhealthy air days in 30 yrs
- 4 days/yr
Risk factors via First Street. Map © Google.
Why this score? — see what drove the D grade
The composite is a weighted blend of 9 inputs, each scored 0–100. Each bar is that input's sub-score; the figure is the points it added to the 100-point composite (weight × sub-score).
- Cash flow +16.3/30.0
- ARV discount +7.5/15.0
- DSCR +5.1/10.0
- Schools +3.6/10.0
- 1% rule +3.3/10.0
- Livability +2.5/5.0
- Condition / age +2.5/5.0
- Rent growth +2.3/5.0
- Appreciation +0.0/10.0
$239,900
🖨 Deal sheet (PDF) 📄 Offer letter ✓ Due diligence
Listing remarks
Under Construction. Beautiful NEW construction home in desirable SW Ocala neighborhood, completed and move in ready. Nice lot with 3 bedrooms, 2 baths in an open concept split floor plan. Home features great curb appeal, granite counters, real wood cabinets, stainless steel appliances, luxury vinyl plank throughout, ceiling fans, upgraded light fixtures. Master suite with WIC and private bath with tiled shower. Landscape package, inside laundry, and 2 car garage. Pictures, photographs, colors, features, and sizes are for illustration purposes only and will vary from the homes as built. Builder has other similar homes available as well.
Key facts
- Open concept
- New construction
- Luxury vinyl plank
Tags
Property features AI
Finance
- Other: Lot size approximately 0.23 acre (0.23 acres); Permit number: 2024051306; Zoning: R1
- Financial info: Home warranty included
- HOA & community: No association reported; No association approval required
Exterior
- Parking: Attached 2-car garage (19 x 20)
- Utilities: Public water; Septic tank sewer; Public utilities
- Home design: Single family residence; Under construction (projected completion May 16, 2026); One-story; Faces south; Attached property
- Construction: Block and stucco construction; Shingle roof; Slab foundation; New construction; Built by Belac Homes, LLC (model: The Palm)
- Exterior features: Other exterior features; Paved road access
Interior
- Kitchen: Dishwasher; Microwave; Range; Refrigerator; Stone countertops
- Bedrooms: 3 bedrooms
- Bathrooms: 2 full bathrooms
- Heating & cooling: Central heating; Central air conditioning
- Interior features: Ceiling fans; High ceilings; Open floor plan; Split bedroom layout; Stone counters; Thermostat; Vaulted ceilings; Walk-in closets
- Laundry & utility: Indoor laundry room
Neighborhood map
What this means for you Summary
Snapshot
- This is a 3-bed/2.0-bath land listed at $240k.
Deal economics
- At list price, monthly cash flow is $134 ($2k/yr) — positive.
- The deal already cash-flows at list — no discount required.
- To meet the 1% rule (rent ≥ 1% of price), the offer needs to be $199k (16.9% below list).
- Recommended offer: $199k (16.9% below list) — sets the bar for 1% rule.
- Cap rate 7.0% vs local median 4.8% in Marion Oaks — top-decile yield for the area; either an underpriced asset or a hidden risk that comps aren't pricing in. Stress-test before assuming the spread holds.
Location & tenants
- Location reads: area grade D — affects rentability + tenant quality, not the cash-flow math above.
- Marion (rural): math 42% / reading 43% proficiency, ranked #61 of 73 in FL (top 84%) — families likely to look elsewhere, expect single-tenant / working-renter base with shorter leases; 61% free/reduced lunch — lower-income household profile, screen leases tightly.
- Zoned schools: Marion Oaks Elementary School (math 38% / reading 39%, grade F, #1,575 of 2,144 statewide, top 74%, 939 students, 65% FRL); Horizon Academy At Marion Oaks (math 37% / reading 36%, grade F, #405 of 571 statewide, top 72%, 1,067 students, 68% FRL); West Port High School (math 34% / reading 52%, grade F, #255 of 667 statewide, top 39%, 2,906 students, 52% FRL) — zoned schools at 62% FRL track the district average.
- Market conditions: Rents soft (-0.7%/yr); 1376 active listings in the ZIP; 19 comparable units currently listed for rent nearby; rentals at typical pace (median 23d on market — plan ~3-4 weeks tenant-placement turnaround); 7,071 units permitted in Marion County in 2024 (534 in 5+ unit buildings).
- This rent runs 33% of the median local income ($72k/yr) — at the standard rent-burdened threshold; future hikes will face affordability resistance.
Forward outlook
- Local home prices are declining (-3.0%/yr); year-one equity from $2k of loan paydown is wiped out by about $7k of value loss. Plan a longer hold.
- Marion County population projected at +13% by 2050 — modest demand growth; plan on rents tracking national, not racing it.
Negotiation context
- It's been on market 40 days — a 3% lower offer ($233k) is reasonable based on typical stale-listing flexibility.
- Current owner paid $75k; list at $240k implies a 218% gain — meaningful room to come down on a strong offer.
Risks & watch-outs
- Climate carrying-cost: severe wind risk, 99% chance of damaging wind over 30y; moderate wildfire risk; extreme-heat days projected 7→22/yr by 2055 (HVAC capex compounding) — expect insurance premiums to compound above CPI over the hold.
Questions for the listing agent
- It's been on market 40 days. Have you received any prior offers? Is the seller open to a 17% concession, seller financing, or rate buy-down credit?
- Is there a deadline driving the sale (1031 exchange, divorce, estate, relocation)? That informs how much negotiation room exists.
- The area grade is low — what's the realistic commute time and amenity access for the typical tenant pool here? Any planned neighborhood developments (good or bad) we should know about?
- What's the average days-on-market for RENTAL listings here right now (not sales)? A rising rental-DOM trend means longer vacancies and softer asking-rent achievability than the comps imply.
- What's the recent tenant-quality profile in this submarket — average credit score on applications, eviction rate, late-payment / NSF rate, and stable-employment percentage? A property-management company in the area should have these aggregated.
- How much new for-sale + rental construction is in the pipeline within 1–3 miles? Heavy new supply typically softens prices + rents 12–24 months out; constrained supply supports both.
Investment metrics
- 1% rule
- 0.83% ✗
- Cap rate
- 6.96%
- Cash-on-cash
- 2.39%
- DSCR
- 1.11
- GRM
- 10.0
CMA / ARV
No comps found within radius.
Projected returns pro-forma
-3.0% appreciation · 0.0% rent growth · sell at horizon
- IRR
- -15.6%
- Equity multiple
- 0.46×
- Total profit
- $-36,309
- Equity at exit
- $35,770
- IRR
- -12.5%
- Equity multiple
- 0.35×
- Total profit
- $-43,648
- Equity at exit
- $20,742
Cash invested: $67,172 (down + closing). Projections, not guarantees.
Landlord ↔ Tenant lean methodology
- Overall (STATE)
- 87 Strongly Landlord-Friendly
- State Florida
- 87 Strongly Landlord-Friendly · R+3
- County
- — inherits STATE
- City
- — inherits STATE
ZIP-level market 34473
- Home prices YoY
- -16.8%
- Rents YoY
- -0.7%
- Active inventory
- 1376
- Price-to-rent
- 10.0×
Monthly cashflow live
- Estimated rent
- $1,992 high interval (Pro) →
- Mortgage (P&I)
- −$1,258
- Tax from tax record
- −$82 /mo · $988/yr
- Insurance
- −$100
- HOA
- −$0
- Vacancy / Maint / Mgmt
- −$418
- Net cashflow
- $134
Break-even live
Sensitivity live
| Price | -10% $269 | -5% $201 | +0% $134 | +5% $66 | +10% $-2 |
|---|---|---|---|---|---|
| Rent | -10% $-24 | -5% $55 | +0% $134 | +5% $212 | +10% $291 |
| Rate | -1.0pp $254 | -0.5pp $195 | base $134 | +0.5pp $71 | +1.0pp $8 |
UW: 25.0% down · 7.5% · 30yr · 1.5% tax · 5.0% vac · 8.0% maint · 8.0% mgmt
Financing live
Cash to close
- Down payment
- $59,975
- Closing costs
- $7,197
- Reserves months
- —
- Total cash needed
- —
Loan-product check · same deal, 3 products live
Conventional
25% down · 7.5% · 30yr
- Down + closing
- —
- Monthly P&I
- —
- Monthly cashflow
- —
- DSCR
- —
- Eligible?
- —
Personal DTI + credit; lowest rate.
DSCR
20% down · 8.5% · 30yr
- Down + closing
- —
- Monthly P&I
- —
- Monthly cashflow
- —
- DSCR
- —
- Eligible?
- —
No personal income docs; deal must DSCR.
Hard money
10% down · 12.0% · 12mo
- Down + closing
- —
- Monthly P&I
- —
- Monthly cashflow
- —
- DSCR
- —
- Eligible?
- —
Short-term bridge; refi at stabilization.
Rent comps 19 comps
| Address | Beds | Baths | Sqft | Rent | $/sqft | DOM | Units | Dist |
|---|---|---|---|---|---|---|---|---|
| 13416 SW 31st Terrace Rd Ocala, FL | 4.0 | 2.0 | 1787 | $2,199 | $1.23 | 15d | 1 | 0.36mi |
| 13410 SW 31st Terrace Rd Ocala, FL | 4.0 | 2.0 | 1787 | $1,899 | $1.06 | 23d | 1 | 0.36mi |
| 12732 SW 33rd Ave Ocala, FL | 4.0 | 2.0 | 1696 | $2,200 | $1.30 | 15d | 1 | 0.41mi |
| 13341 SW 29th Cir Unit NA Ocala, FL | 3.0 | 2.0 | 1596 | $1,685 | $1.06 | 23d | 1 | 0.48mi |
| 13341 SW 29th Cir Ocala, FL | 3.0 | 2.0 | 1596 | $1,725 | $1.08 | 15d | 1 | 0.48mi |
| 3892 SW 130th Loop Ocala, FL | 4.0 | 2.0 | 1700 | $2,200 | $1.29 | 15d | 1 | 0.82mi |
| 3995 SW 134th St Ocala, FL | 4.0 | 2.0 | 1751 | $2,100 | $1.20 | 23d | 1 | 0.90mi |
| 4052 SW 132nd Ln Ocala, FL | 4.0 | 2.0 | 1751 | $2,000 | $1.14 | 23d | 1 | 0.91mi |
| 3971 SW 130th Loop Ocala, FL | 4.0 | 2.0 | 1485 | $2,000 | $1.35 | 15d | 1 | 0.93mi |
| 14007 SW 30th Terrace Rd Ocala, FL | 3.0 | 2.0 | 1710 | $1,675 | $0.98 | 23d | 1 | 0.94mi |
| 13731 SW 40th Cir Ocala, FL | 3.0 | 2.0 | 1463 | $1,695 | $1.16 | 15d | 1 | 1.11mi |
| 13690 SW 43rd Cir Ocala, FL | 4.0 | 3.0 | 1802 | $2,200 | $1.22 | 15d | 1 | 1.16mi |
| 13401 SW 43rd Avenue Rd Ocala, FL | 3.0 | 2.0 | 1514 | $1,900 | $1.25 | 15d | 1 | 1.18mi |
| 4004 SW 138th Pl Ocala, FL | 3.0 | 2.0 | 1348 | $1,695 | $1.26 | 23d | 1 | 1.18mi |
| 14245 SW 28th Ct Ocala, FL | 4.0 | 2.0 | 1774 | $1,900 | $1.07 | 15d | 1 | 1.21mi |
| 4428 SW 132nd St Ocala, FL | 3.0 | 2.0 | 1600 | $1,700 | $1.06 | 23d | 1 | 1.24mi |
| 13805 SW 43rd Cir Ocala, FL | 4.0 | 2.0 | 1494 | $1,800 | $1.20 | 23d | 1 | 1.33mi |
| 3011 SW 140th Loop Ocala, FL | 3.0 | 2.0 | 1335 | $1,695 | $1.27 | 23d | 1 | 1.41mi |
| 4691 SW 129th Pl Ocala, FL | 4.0 | 2.0 | 1643 | $1,850 | $1.13 | 23d | 1 | 1.47mi |
Listing history 5 events
-
2026-05-04status Pending
-
2026-03-25$239,900 Active
-
2024-04-11soldstatus $75,429
-
2005-07-25soldstatus $49,000
-
1997-05-16soldstatus $7,500
ⓘ Source: listings_history table (triggers on properties + properties_extension) + one-shot
backfill from property_details.listing_events for pre-trigger history.
Tax reassessment forecast FL · Resets to sale price
- Current annual tax
- $988 · $82/mo
- Projected year-2 tax
- $1,991 · $166/mo
- Expected delta
- +$1,003/yr (+$84/mo · 101.4%)
ⓘ Screening estimate from a state-policy table — verify with the county assessor before closing.
Climate risk First Street
- Flood 1/10 Low FEMA zone X (unshaded) · 0% chance over 30 yrs
- Wildfire 5/10 Major
- Heat 8/10 Severe 7 d/yr ≥108°F today · 22 d/yr by 30 yrs out
- Wind 9/10 Extreme 99% chance of damaging wind over 30 yrs
- Air quality 3/10 Moderate 2 unhealthy d/yr today · 4 by 30 yrs out
Nearby sold comps map
Loading sold comps map…
Walkable amenities ~0.75 mi
Loading nearby amenities…
Taxation est. · year 1
- Rental income
- $23,908
- − Mortgage interest
- −$13,438
- − Property taxes
- −$988
- − Insurance
- −$1,200
- − Repairs & maintenance
- −$1,913
- − Management
- −$1,913
- − Depreciation
- −$6,979
- Taxable loss
- −$2,522
- Est. tax savings @ 24.0%
- +$605
- After-tax cash flow
- $2,208/yr
For passive investors: Depreciation is non-cash, so a rental often shows a tax loss while cash-flowing — sheltering income. Rental losses are passive: they offset passive income freely, and up to $25,000/yr can offset ordinary (W-2) income if you actively participate and your MAGI is under $100k (phasing out to $0 by $150k); unused losses carry forward. On sale, claimed depreciation is recaptured at up to 25%, and gains may owe capital-gains tax (a 1031 exchange can defer both). Figures are a year-1 estimate at your 24.0% rate — not tax advice; consult a CPA.
Schools (NCES district)
- District
- Marion
- NCES district ID
- 1201260
- Math proficiency
- 42% ▼ -7.00%
- Reading proficiency
- 43% ▼ -4.00%
- Median HH income
- $40,015
- Composite
- 35.61/100
- National rank
- #4890
- State rank
- #61 of 73 in FL
Livability — Marion Oaks
No livability data for this city. (Only ~50 U.S. cities are tracked.)
Census & demographics
- Census place
- Marion Oaks, FL
- County
- Marion County · 315,796 people
- City population
- 25,030
- Metro
- Ocala, FL
- Population (ZIP)
- 26,813
- Household income
- $72,366
- Rent vs Own
- Severe rent burden
- 228.0
Population outlook (Marion County) Hauer SSP2
- Today (2025)
- 365,905 people
- By 2030
- 376,768 · +3.0%
- By 2040
- 396,555 · +8.4%
- By 2050
- 412,723 · +12.8%
- By 2075
- 446,090 · +21.9%
- By 2100
- 436,193 · +19.2%
Race, ethnicity, and origin ACS 2023
- Neighborhood character
- Diverse neighborhood (Simpson 0.69)
- Race & ethnicity
- White 34% Black 33% Hispanic / Latino 29% Two or more races 19% Asian 1%
- Hispanic origin (detail)
- Mexican 1% Puerto Rican 17% Cuban 3%
- Common ancestry
- Hispanic 3% Portuguese 2% Romanian 1%
- Foreign-born
- 17% · Canada, Jamaica
- Languages at home
- 67% English-only · Spanish 27% French/Haitian/Cajun 4% Other Indo-European 1%
Political lean MEDSL · Marion
- 2024 margin
- Solid R (+31.6) · D 33.8% · R 65.5%
- 2008→2024 swing
- -20.0pp toward R · 2008: -11.6pp · 2024: -31.6pp
- All cycles
- 2024: R+31.6 2020: R+25.9 2016: R+26.2 2012: R+16.2 2008: R+11.6
Not yet ingested
- Civics
- —
Market trends
- HPI YoY
- ▼ -45.25%
- Current HPI
- 224.3536
- Rent YoY
- ▼ -0.67%
- Metro
- Ocala, FL
- State GDP YoY
- ▲ 3.28%
- F500 in state
- 36
Industry mix (Fortune 500 HQ in FL)
| Industry | F500 HQs | Revenue |
|---|---|---|
| Industrial Technology | 2 | $29B |
|
||
| Insurance | 2 | $17B |
|
||
| Retail | 1 | $60B |
|
||
| Technology Distribution | 1 | $58B |
|
||
| Homebuilding | 1 | $35B |
|
||
| Technology Manufacturing | 1 | $35B |
|
||
Price history
+3098.7% since first listed5 events — show timeline
- 2026-05-04 Pending — Stellar MLS as Distributed by MLS Grid
- 2026-03-25 Listed $239,900 Stellar MLS as Distributed by MLS Grid
- 2024-04-11 Sold (Public Records) $75,429 Public Records
- 2005-07-25 Sold (Public Records) $49,000 Public Records
- 1997-05-16 Sold (Public Records) $7,500 Public Records
Property tax history
+17.6%/yrLatest (2025): $988 · +163.2% YoY. Source: county tax records.
Cash-flow waterfall
monthlySold comps — $/sqft
last 12 mo · ≤1 miLoading sold comps…