 🏷️ Likely Rental
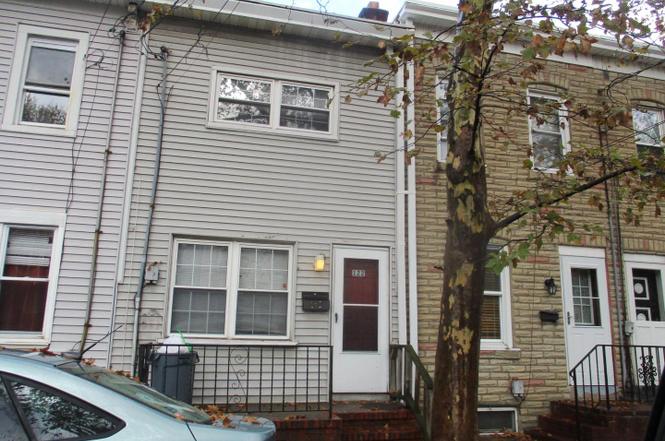
122 Hewitt St · Trenton, NJ
Flood risk 1/10 · Minimal
- FEMA flood zone
- X (unshaded)
- Chance of flooding over 30 yrs
- 0.0%
- Est. flood insurance / yr
- $507 – $1,088
Fire risk 1/10 · Minimal
- Est. fire insurance / yr
- $526 – $976
Heat risk 6/10 · Moderate
- Hot days now (above 102°F)
- 7 days/yr
- Hot days in 30 yrs
- 15 days/yr
Wind risk 6/10 · Moderate
- Chance of severe wind over 30 yrs
- 27.0%
Air-quality risk 5/10 · Moderate
- Unhealthy air days now
- 6 days/yr
- Unhealthy air days in 30 yrs
- 8 days/yr
Risk factors via First Street. Map © Google.
Why this score? — see what drove the B- grade
The composite is a weighted blend of 9 inputs, each scored 0–100. Each bar is that input's sub-score; the figure is the points it added to the 100-point composite (weight × sub-score).
- Cash flow +25.7/30.0
- ARV discount +15.0/15.0
- DSCR +8.6/10.0
- 1% rule +6.6/10.0
- Livability +3.8/5.0
- Rent growth +3.7/5.0
- Condition / age +2.5/5.0
- Schools +0.7/10.0
- Appreciation +0.0/10.0
$179,900
🖨 Deal sheet 📄 Offer letter ✓ Due diligence
Listing remarks
Great opportunity for an owner-occupant or investor. This spacious three-bedroom property is well maintained and offers convenient access to schools, shopping, and the commuter train. The home features a newer furnace and hot water heater, along with updated sewer and water lines. The property will be delivered vacant at closing. Tenant-occupied property. Long-term tenant currently paying $1,195/month. Landlord is holding a security deposit equal to 1.5 months’ rent. Current lease expires July 2026. Rent is scheduled to increase by 4% in June. Buyer to assume existing tenancy unless purchaser intends to occupy the property. Property is to be sold as is.
Key facts
- Newer furnace
- Updated water lines
- Hot water heater
Tags
Property features AI
Exterior
- Utilities: Public water; Public sewer; Natural gas service
- Home design: Interior townhouse/rowhouse; Fee simple ownership; Year built estimated
- Construction: Brick and vinyl siding exterior; Stone foundation; Asphalt roof; Above grade structure
- Exterior features: No tidal water
Interior
- Kitchen: Kitchen (appliances not specified beyond washer/dryer)
- Bedrooms: 3 bedrooms on the upper level; 7 total rooms (Living Room, Dining Room, Kitchen, 3 Bedrooms, 1 Bathroom)
- Bathrooms: 1 full bathroom
- Heating & cooling: Forced air heating; Central A/C; Heating and cooling fueled by natural gas; Natural gas hot water
- Interior features: Full basement; Estimated living area
- Laundry & utility: Washer; Dryer
Neighborhood map
What this means for you Summary
Snapshot
- This is a 3-bed/1.0-bath single-family listed at $180k.
Deal economics
- At list price, monthly cash flow is $430 ($5k/yr) — positive.
- The deal already cash-flows at list — no discount required.
- Meets the 1% rule at list price ($2k rent vs $180k).
- Recommended offer: $164k (9.0% below list) — sets the bar for market timing.
- Cap rate 9.2% vs local median 6.3% in Trenton — top-decile yield for the area; either an underpriced asset or a hidden risk that comps aren't pricing in. Stress-test before assuming the spread holds.
Location & tenants
- Location reads 76/100 on livability (#133 in NJ, #3,533 nationally) — a middle-class / working-renter tenant base. Strengths: amenities A+, commute A+, health & safety A+; Watch: schools F, crime F, employment F.
- Trenton Public School District (urban): math 2% / reading 16% proficiency, ranked #471 of 472 in NJ (top 100%) — low school quality limits family demand, transient renter base, plan for 1-2y turnover; 80% free/reduced lunch — lower-income household profile, screen leases tightly.
- Market conditions: Rents rising fast (+4.7%/yr); 84 active listings in the ZIP; 31 comparable units currently listed for rent nearby; rentals at typical pace (median 21d on market — plan ~3-4 weeks tenant-placement turnaround); 2,256 units permitted in Mercer County in 2024 (1,303 in 5+ unit buildings).
- This rent runs 44% of the median local income ($57k/yr) — at the standard rent-burdened threshold; future hikes will face affordability resistance.
Forward outlook
- Local home prices are declining (-3.0%/yr); year-one equity from $1k of loan paydown is wiped out by about $5k of value loss. Plan a longer hold.
- Mercer County population projected at +4% by 2050 — modest demand growth; plan on rents tracking national, not racing it.
- At projected returns (-3.0% appreciation + 4.7% rent growth), your $50k cash investment doubles in ~9 years — after that, you're playing with house money.
Negotiation context
- It's been on market 103 days — a 9% lower offer ($164k) is reasonable based on typical stale-listing flexibility.
- 2 sale attempts; this cycle's ask has dropped $10k (5%) from the opening price — seller is motivated, your offer sets the floor, not the list.
- Current owner paid $67k; list at $180k implies a 169% gain — meaningful room to come down on a strong offer.
Risks & watch-outs
- Watch-outs: built in 1900 — expect roof / HVAC / electrical / plumbing capex.
- Climate carrying-cost: major wind risk, 27% chance of damaging wind over 30y; extreme-heat days projected 7→15/yr by 2055 (HVAC capex compounding) — expect insurance premiums to compound above CPI over the hold.
Questions for the listing agent
- It's been on market 103 days. Have you received any prior offers? Is the seller open to a 9% concession, seller financing, or rate buy-down credit?
- Built in 1900 — when were the roof, HVAC, electrical panel, plumbing, and water heater last replaced?
- Why hasn't it sold? Are there any deal-killer items the seller is aware of (foundation, flood, title, zoning, code violations)?
- Is there a deadline driving the sale (1031 exchange, divorce, estate, relocation)? That informs how much negotiation room exists.
- Schools are F-rated, which usually means shorter tenancies and higher turnover. Who's the typical renter profile here, and what's been the actual vacancy rate?
- Crime grade is F in this area — have there been break-ins, vandalism, or insurance claims at this property in the last 3 years? What carrier currently insures it and at what premium?
- What's the average days-on-market for RENTAL listings here right now (not sales)? A rising rental-DOM trend means longer vacancies and softer asking-rent achievability than the comps imply.
- What's the recent tenant-quality profile in this submarket — average credit score on applications, eviction rate, late-payment / NSF rate, and stable-employment percentage? A property-management company in the area should have these aggregated.
- How much new for-sale + rental construction is in the pipeline within 1–3 miles? Heavy new supply typically softens prices + rents 12–24 months out; constrained supply supports both.
Investment metrics
- 1% rule
- 1.16% ✓
- Cap rate
- 9.16%
- Cash-on-cash
- 10.24%
- DSCR
- 1.46
- GRM
- 7.2
CMA / ARV
- ARV (on-the-fly)
- $307,296
- Comps found
- 12
Show comp detail 12 sales within ~0.75 mi
| Address | Dist | Beds/Ba | Sqft | Sold | Price | $/sf | Match |
|---|---|---|---|---|---|---|---|
| 811 Anderson St | 0.15mi | 2/1.0 (-1) | 1,026 (-12%) | 0mo | $206,000 | $201 | 68 |
| 427 Woodland St | 0.37mi | 3/2.0 | 1,204 (+3%) | 14mo | $295,000 | $245 | 61 |
| 1027 Chambers St | 0.37mi | 3/1.5 | 1,246 (+7%) | 10mo | $205,000 | $165 | 60 |
| 807 S Broad St | 0.38mi | 4/1.0 (+1) | 1,200 (+3%) | 15mo | $150,000 | $125 | 60 |
| 872 Revere Ave | 0.64mi | 3/1.0 | 1,200 (+3%) | 8mo | $293,000 | $244 | 58 |
| 44 Jeremiah Ave | 0.67mi | 3/1.0 | 1,108 (-5%) | 7mo | $325,000 | $293 | 55 |
| 718 E Howell St | 0.68mi | 3/3.0 | 1,144 (-2%) | 7mo | $380,000 | $332 | 51 |
| 36 Emanuel St | 0.60mi | 2/1.0 (-1) | 1,127 (-3%) | 13mo | $370,000 | $328 | 51 |
| 1051 Quinton Ave | 0.61mi | 4/1.0 (+1) | 1,116 (-4%) | 11mo | $295,000 | $264 | 50 |
| 67 Jersey St | 0.48mi | 3/2.0 | 1,316 (+13%) | 12mo | $195,000 | $148 | 42 |
| 121 Emanuel St | 0.62mi | 2/2.0 (-1) | 1,278 (+10%) | 10mo | $345,000 | $270 | 37 |
| 412 Bow Hill Ave | 0.74mi | 3/2.0 | 1,014 (-13%) | 13mo | $325,000 | $321 | 29 |
Match score weights: distance 35% · size 25% · config 20% · recency 20%. Top-matched comps best support the ARV.
Projected returns pro-forma
-3.0% appreciation · 4.71% rent growth · sell at horizon
- IRR
- 1.0%
- Equity multiple
- 1.04×
- Total profit
- $1,908
- Equity at exit
- $26,824
- IRR
- 12.2%
- Equity multiple
- 2.04×
- Total profit
- $52,543
- Equity at exit
- $15,554
Cash invested: $50,372 (down + closing). Projections, not guarantees.
Landlord ↔ Tenant lean methodology
- Overall (STATE)
- 21 Tenant-Leaning
- State New Jersey
- 21 Tenant-Leaning · D+6
- County
- — inherits STATE
- City
- — inherits STATE
ZIP-level market 08611
- Rents YoY
- 4.7%
- Active inventory
- 84
- Price-to-rent
- 7.2×
Monthly cashflow live
- Estimated rent
- $2,091 high interval (Pro) →
- Mortgage (P&I)
- −$943
- Tax from tax record
- −$204 /mo · $2,444/yr
- Insurance
- −$75
- HOA
- −$0
- Vacancy / Maint / Mgmt
- −$439
- Net cashflow
- $430
Break-even live
UW: 25.0% down · 7.5% · 30yr · 1.5% tax · 5.0% vac · 8.0% maint · 8.0% mgmt
Financing live
Cash to close
- Down payment
- $44,975
- Closing costs
- $5,397
- Reserves months
- —
- Total cash needed
- —
Loan-product check · same deal, 3 products live
Conventional
25% down · 7.5% · 30yr
- Down + closing
- —
- Monthly P&I
- —
- Monthly cashflow
- —
- DSCR
- —
- Eligible?
- —
Personal DTI + credit; lowest rate.
DSCR
20% down · 8.5% · 30yr
- Down + closing
- —
- Monthly P&I
- —
- Monthly cashflow
- —
- DSCR
- —
- Eligible?
- —
No personal income docs; deal must DSCR.
Hard money
10% down · 12.0% · 12mo
- Down + closing
- —
- Monthly P&I
- —
- Monthly cashflow
- —
- DSCR
- —
- Eligible?
- —
Short-term bridge; refi at stabilization.
Rent comps 31 comps
| Address | Beds | Baths | Sqft | Rent | $/sqft | DOM | Units | Dist |
|---|---|---|---|---|---|---|---|---|
| 705 Anderson St Trenton, NJ | 3.0 | 1.0 | 1132 | $1,800 | $1.59 | 13d | 1 | 0.15mi |
| 1103 Division St Trenton, NJ | 4.0 | 1.0 | 1296 | $2,000 | $1.54 | 21d | 1 | 0.17mi |
| 176 Division St Apt 106 Trenton, NJ | 2.0 | 1.0 | 975 | $1,700 | $1.74 | 21d | 1 | 0.30mi |
| 203 Genesee St Unit 2 Trenton, NJ | 2.0 | 1.0 | 1452 | $1,700 | $1.17 | 21d | 1 | 0.33mi |
| 837 Genesee St Trenton, NJ | 2.0 | 1.0 | 850 | $1,700 | $2.00 | 21d | 1 | 0.35mi |
| 225 Home Ave Trenton, NJ | 2.0 | 1.0 | 800 | $1,750 | $2.19 | 21d | 1 | 0.35mi |
| 313 Home Ave Trenton, NJ | 3.0 | 1.0 | 1112 | $2,100 | $1.89 | 13d | 1 | 0.40mi |
| 233 Virginia Ave Trenton, NJ | 3.0 | 1.0 | 1302 | $2,500 | $1.92 | 12d | 1 | 0.50mi |
| 1049 Genesee St Trenton, NJ | 3.0 | 1.0 | 1270 | $2,300 | $1.81 | 21d | 1 | 0.50mi |
| 1132 Genesee St Unit 1132 Trenton, NJ | 3.0 | 1.0 | 1198 | $2,500 | $2.09 | 21d | 1 | 0.55mi |
| 244 Jersey St Trenton, NJ | 3.0 | 1.5 | 1368 | $2,300 | $1.68 | 13d | 1 | 0.56mi |
| 71 Clark St Trenton, NJ | 1.0–2.0 | 1.0–2.0 | 975 | $2,350 | $2.41 | 13d | 4 | 0.58mi |
| 635 Chambers St Trenton, NJ | 4.0 | 2.0 | 1312 | $2,500 | $1.91 | 13d | 1 | 0.59mi |
| 720 Monmouth St Unit 204 Trenton, NJ | 2.0 | 1.0 | 1011 | $1,750 | $1.73 | 21d | 1 | 0.64mi |
| 121 Columbus Ave Trenton, NJ | 3.0 | 1.0 | 1050 | $1,900 | $1.81 | 21d | 1 | 0.65mi |
| 1078 Lalor St Unit 1 Trenton, NJ | 2.0 | 1.0 | 1488 | $1,895 | $1.27 | 21d | 1 | 0.67mi |
| 1078 Lalor St Unit 2 Trenton, NJ | 2.0 | 1.0 | 1488 | $1,785 | $1.20 | 21d | 1 | 0.67mi |
| 547 Centre St Trenton, NJ | 3.0 | 1.0 | 1060 | $1,850 | $1.75 | 21d | 1 | 0.75mi |
| 105 Walnut Ave Unit 1 Trenton, NJ | 2.0 | 1.0 | 1200 | $2,000 | $1.67 | 21d | 1 | 0.90mi |
| 234 Walnut Ave Trenton, NJ | 4.0 | 1.0 | 1480 | $2,200 | $1.49 | 21d | 1 | 1.00mi |
| 339 Tioga St #339 Trenton, NJ | 2.0 | 1.0 | 864 | $1,850 | $2.14 | 21d | 1 | 1.04mi |
| 417 Walnut Ave Trenton, NJ | 3.0 | 1.0 | 992 | $2,050 | $2.07 | 21d | 1 | 1.12mi |
| 428 Cleveland Ave Trenton, NJ | 4.0 | 2.0 | 1400 | $2,500 | $1.79 | 21d | 1 | 1.21mi |
| 216 E State St Trenton, NJ | 1.0–2.0 | 1.0 | 811 | $1,895 | $2.34 | 13d | 2 | 1.22mi |
| 42 Grant St Trenton, NJ | 4.0 | 1.0 | 1000 | $2,000 | $2.00 | 13d | 1 | 1.29mi |
| 202 E Hanover St Unit 5G Trenton, NJ | 2.0 | 1.0 | 750 | $1,200 | $1.60 | 21d | 1 | 1.30mi |
| 1163 E State St Unit 9 Trenton, NJ | 2.0 | 1.0 | 775 | $1,770 | $2.28 | 21d | 1 | 1.30mi |
| 1165 E State St Trenton, NJ | 3.0 | 1.0 | 900 | $1,749 | $1.94 | 13d | 1 | 1.31mi |
| 315 Wert Ave Trenton, NJ | 2.0 | 1.0 | 685 | $2,270 | $3.31 | 12d | 9 | 1.34mi |
| 125 Olive St Trenton, NJ | 2.0–3.0 | 1.0–1.5 | 896 | $1,392 | $1.55 | 21d | 1 | 1.35mi |
| 219 Woodlawn Ave Trenton, NJ | 3.0 | 1.0 | 1456 | $2,355 | $1.62 | 13d | 1 | 1.42mi |
Listing history 20 events
-
2026-06-18days on market $179,900 Active 103 DOM
-
2026-06-17days on market $179,900 Active 102 DOM
-
2026-06-16days on market $179,900 Active 101 DOM
-
2026-06-15days on market $179,900 Active 100 DOM
-
2026-06-14days on market $179,900 Active 98 DOM
-
2026-06-10days on market $179,900 Active 95 DOM
-
2026-06-09days on market $179,900 Active 94 DOM
-
2026-06-08days on market $179,900 Active 93 DOM
-
2026-06-07days on market $179,900 Active 92 DOM
-
2026-06-03days on market $179,900 Active 88 DOM
-
2026-06-02days on market $179,900 Active 87 DOM
-
2026-06-01days on market $179,900 Active 86 DOM
-
2026-05-31days on market $179,900 Active 85 DOM
-
2026-05-30days on market $179,900 Active 84 DOM
-
2026-04-29price $179,900
-
2026-04-01status Active
-
2026-01-30status Pending
-
2026-01-05$189,900 Active
-
2006-05-23soldstatus $66,950
-
1983-09-01soldstatus $38,000
ⓘ Source: listings_history table (triggers on properties + properties_extension) + one-shot
backfill from property_details.listing_events for pre-trigger history.
Tax reassessment forecast NJ · Partial reset (capped growth)
- Current annual tax
- $2,444 · $204/mo
- Projected year-2 tax
- $3,462 · $288/mo
- Expected delta
- +$1,018/yr (+$85/mo · 41.6%)
ⓘ Screening estimate from a state-policy table — verify with the county assessor before closing.
Climate risk First Street
- Flood 1/10 Low FEMA zone X (unshaded) · 0% chance over 30 yrs
- Wildfire 1/10 Low
- Heat 6/10 Major 7 d/yr ≥102°F today · 15 d/yr by 30 yrs out
- Wind 6/10 Major 27% chance of damaging wind over 30 yrs
- Air quality 5/10 Major 6 unhealthy d/yr today · 8 by 30 yrs out
Nearby sold comps map
Loading sold comps map…
Walkable amenities ~0.75 mi
Loading nearby amenities…
Taxation est. · year 1
- Rental income
- $25,093
- − Mortgage interest
- −$10,077
- − Property taxes
- −$2,444
- − Insurance
- −$900
- − Repairs & maintenance
- −$2,007
- − Management
- −$2,007
- − Depreciation
- −$5,233
- Taxable income
- $2,424
- Est. tax owed @ 24.0%
- −$582
- After-tax cash flow
- $4,577/yr
For passive investors: Depreciation is non-cash, so a rental often shows a tax loss while cash-flowing — sheltering income. Rental losses are passive: they offset passive income freely, and up to $25,000/yr can offset ordinary (W-2) income if you actively participate and your MAGI is under $100k (phasing out to $0 by $150k); unused losses carry forward. On sale, claimed depreciation is recaptured at up to 25%, and gains may owe capital-gains tax (a 1031 exchange can defer both). Figures are a year-1 estimate at your 24.0% rate — not tax advice; consult a CPA.
Schools (NCES district)
- District
- Trenton Public School District
- NCES district ID
- 3416290
- Math proficiency
- 2% ▼ -8.00%
- Reading proficiency
- 16% ▼ -4.00%
- Median HH income
- $35,078
- Composite
- 7.31/100
- National rank
- #9956
- State rank
- #471 of 472 in NJ
Livability — Trenton
- Score
- 76/100
- State rank
- #133
- US rank
- #3533
Category grades
Schools grade is shown separately in the Schools card above.
Census & demographics
- Census place
- Trenton, NJ
- County
- Mercer County · 327,655 people
- City population
- 177,819
- Metro
- Trenton-Princeton, NJ
- Population (ZIP)
- 31,995
- Household income
- $56,788
- Rent vs Own
- Severe rent burden
- 2147.0
Population outlook (Mercer County) Hauer SSP2
- Today (2025)
- 381,395 people
- By 2030
- 384,640 · +0.9%
- By 2040
- 391,431 · +2.6%
- By 2050
- 397,845 · +4.3%
- By 2075
- 417,281 · +9.4%
- By 2100
- 420,327 · +10.2%
Race, ethnicity, and origin ACS 2023
- Neighborhood character
- Diverse neighborhood (Simpson 0.56)
- Race & ethnicity
- Hispanic / Latino 62% Black 20% Two or more races 18% White 14% Native American 4%
- Hispanic origin (detail)
- Mexican 2% Puerto Rican 12% Dominican 8%
- Common ancestry
- Romanian 2% Swiss 1% Hispanic 1%
- Foreign-born
- 37% · Canada, Jamaica, Guatemala
- Languages at home
- 41% English-only · Spanish 57% French/Haitian/Cajun 2%
Political lean MEDSL · Mercer
- 2024 margin
- Solid D (+33.9) · D 65.9% · R 32.0% · Other 2.1%
- 2008→2024 swing
- -2.2pp toward R · 2008: 36.1pp · 2024: 33.9pp
- All cycles
- 2024: D+33.9 2020: D+40.0 2016: D+36.2 2012: D+36.8 2008: D+36.1
Not yet ingested
- Civics
- —
Market trends
- HPI YoY
- ▼ -267.62%
- Current HPI
- 276.5427
- Rent YoY
- ▲ 4.71%
- Metro
- Trenton-Princeton, NJ
- State GDP YoY
- ▲ 2.05%
- F500 in state
- 34
Industry mix (Fortune 500 HQ in NJ)
| Industry | F500 HQs | Revenue |
|---|---|---|
| Consumer Goods | 3 | $31B |
|
||
| Pharmaceuticals | 2 | $153B |
|
||
| Technology | 2 | $21B |
|
||
| Insurance | 2 | $20B |
|
||
| Healthcare | 2 | $19B |
|
||
| Financial Services | 1 | $70B |
|
||
Price history
+373.4% since first listed6 events — show timeline
- 2026-04-29 Price Changed $179,900 BRIGHT MLS
- 2026-04-01 Relisted — BRIGHT MLS
- 2026-01-30 Pending — BRIGHT MLS
- 2026-01-05 Listed $189,900 BRIGHT MLS
- 2006-05-23 Sold (Public Records) $66,950 Public Records
- 1983-09-01 Sold (Public Records) $38,000 Public Records
Property tax history
-0.8%/yrLatest (2025): $2,444 · +1.5% YoY. Source: county tax records.
Cash-flow waterfall
monthlySold comps — $/sqft
last 12 mo · ≤1 miLoading sold comps…