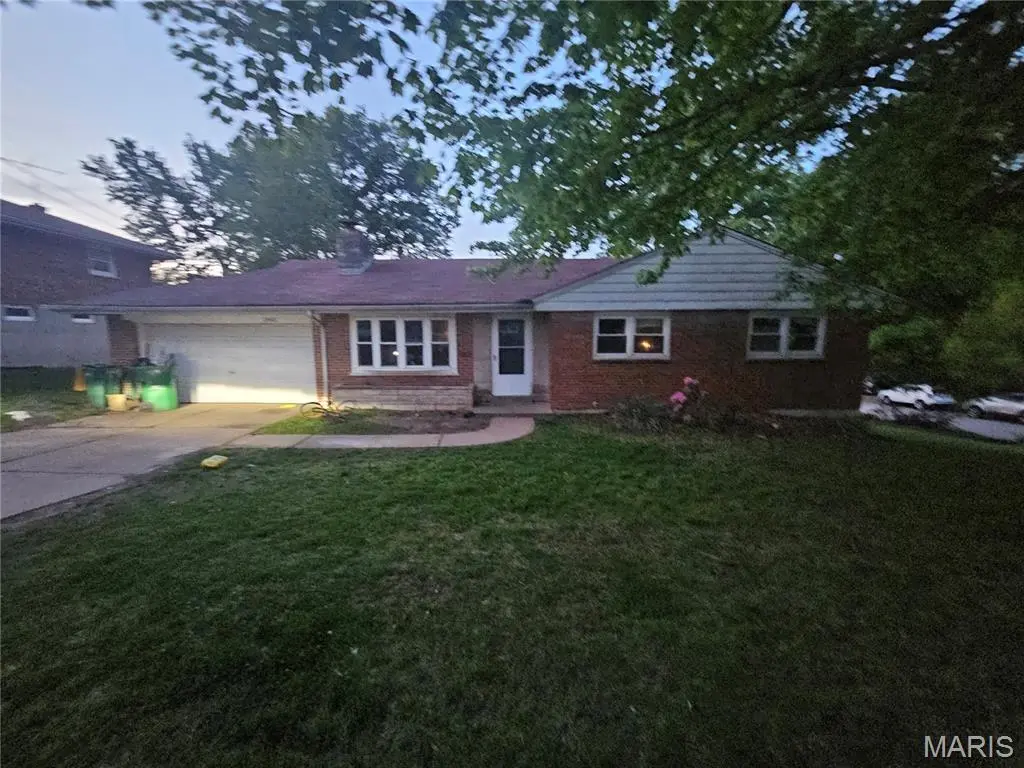
2443 Caverhill Dr · Moline Acres, MO
Flood risk 1/10 · Minimal
- FEMA flood zone
- X (unshaded)
- Chance of flooding over 30 yrs
- 0.0%
- Est. flood insurance / yr
- $473 – $860
Fire risk 1/10 · Minimal
- Est. fire insurance / yr
- $1,054 – $1,958
Heat risk 5/10 · Moderate
- Hot days now (above 107°F)
- 7 days/yr
- Hot days in 30 yrs
- 21 days/yr
Wind risk 2/10 · Minimal
- Chance of severe wind over 30 yrs
- 1.0%
Air-quality risk 4/10 · Minor
- Unhealthy air days now
- 5 days/yr
- Unhealthy air days in 30 yrs
- 6 days/yr
Risk factors via First Street. Map © Google.
Why this score? — see what drove the B- grade
The composite is a weighted blend of 9 inputs, each scored 0–100. Each bar is that input's sub-score; the figure is the points it added to the 100-point composite (weight × sub-score).
- Cash flow +23.3/30.0
- ARV discount +15.0/15.0
- DSCR +7.5/10.0
- Appreciation +6.9/10.0
- 1% rule +6.6/10.0
- Rent growth +3.7/5.0
- Livability +3.0/5.0
- Condition / age +2.5/5.0
- Schools +0.4/10.0
$114,900
🖨 Deal sheet 📄 Offer letter ✓ Due diligence
Listing remarks MLS
Home needs a little TLC, but can be a fantastic all brick home on a nice corner lot,with a double car garage two fireplaces one in the open airy Lower Level with a lot of natural light and finished paneling with a built-in corner bar a second Gas fireplace in the living room with a full rock wall living room also has beautiful plaster cove molding Hardwood flouring though out take a look today for the investor or the do it your selfer
Key facts
- Level yard
- Ample cabinetry
- Attached garage
Tags
Property features AI
Finance
- Other: Living area reported as 1,138 (per public records)
- Financial info: Lease not considered
Exterior
- Parking: Attached 2-car garage (total 2 parking spaces)
- Utilities: Public water; Public sewer; Electric: Other
- Home design: Single-family residence; One story; Private ownership
- Construction: Brick veneer exterior; Composition roof
- Exterior features: Level lot; Paved road frontage on a city street; Lot dimensions approximately 88 x 100
Interior
- Kitchen: Free-standing range; Refrigerator
- Bedrooms: Three bedrooms on the main level
- Flooring: Vinyl flooring; Wood flooring
- Bathrooms: One full bathroom; One half bathroom (main level)
- Heating & cooling: Heating: Other; Central air (electric)
- Interior features: Partially finished full basement; Two fireplaces (living room); Free-standing range; Refrigerator
Neighborhood map
What this means for you Summary
Snapshot
- This is a 3-bed/1.5-bath single-family listed at $115k.
Deal economics
- At list price, monthly cash flow is $211 ($3k/yr) — positive.
- The deal already cash-flows at list — no discount required.
- Meets the 1% rule at list price ($1k rent vs $115k).
- Recommended offer: $111k (3.0% below list) — sets the bar for market timing.
- Cap rate 8.5% vs local median 10.9% in Moline Acres — below-typical yield; the buyer is paying a premium for something (appreciation thesis, condition, location) that the cap rate doesn't capture.
Location & tenants
- Location reads 60/100 on livability (#480 in MO) — a middle-class / working-renter tenant base. Strengths: cost of living A+, housing A-; Watch: health & safety C-, employment D, crime F.
- Riverview Gardens (suburban): math 2% / reading 9% proficiency, ranked #324 of 324 in MO (top 100%) — low school quality limits family demand, transient renter base, plan for 1-2y turnover; 90% free/reduced lunch — lower-income household profile, screen leases tightly.
- Zoned schools: Danforth Elem. (math 2% / reading 2%, grade F, #1,099 of 1,115 statewide, top 100%, 271 students, 99% FRL); Riverview Gardens Sr. High (math 2% / reading 18%, grade F, #501 of 521 statewide, top 97%, 1,331 students, 100% FRL).
- Market conditions: Rents rising fast (+5.0%/yr); 372 active listings in the ZIP; 40 comparable units currently listed for rent nearby; rentals at typical pace (median 24d on market — plan ~3-4 weeks tenant-placement turnaround); lower-income renter base — watch delinquency; 920 units permitted in St. Louis County in 2024 (250 in 5+ unit buildings).
Forward outlook
- In year one you build about $5k of equity ($794 loan paydown + $4k appreciation (3.8% local appreciation)).
- At projected returns (3.8% appreciation + 5.0% rent growth), your $32k cash investment doubles in ~4 years — after that, you're playing with house money.
- By year 7, paydown + projected appreciation supports a ~$33k cash-out refi (75% LTV) — recoverable capital for the next deal without selling this one.
Negotiation context
- It's been on market 41 days — a 3% lower offer ($111k) is reasonable based on typical stale-listing flexibility.
- 2 sale attempts since 7y ago with the ask held roughly flat each time — persistent listings suggest the price (not the market) is what's stuck; bring a comps-based counter.
- Current owner paid $52k; list at $115k implies a 120% gain — meaningful room to come down on a strong offer.
Risks & watch-outs
- Watch-outs: built in 1956 — expect roof / HVAC / electrical / plumbing capex.
- Climate carrying-cost: extreme-heat days projected 7→21/yr by 2055 (HVAC capex compounding) — expect insurance premiums to compound above CPI over the hold.
Questions for the listing agent
- It's been on market 41 days. Have you received any prior offers? Is the seller open to a 3% concession, seller financing, or rate buy-down credit?
- Built in 1956 — when were the roof, HVAC, electrical panel, plumbing, and water heater last replaced?
- Is there a deadline driving the sale (1031 exchange, divorce, estate, relocation)? That informs how much negotiation room exists.
- Schools are F-rated, which usually means shorter tenancies and higher turnover. Who's the typical renter profile here, and what's been the actual vacancy rate?
- Crime grade is F in this area — have there been break-ins, vandalism, or insurance claims at this property in the last 3 years? What carrier currently insures it and at what premium?
- What's the average days-on-market for RENTAL listings here right now (not sales)? A rising rental-DOM trend means longer vacancies and softer asking-rent achievability than the comps imply.
- What's the recent tenant-quality profile in this submarket — average credit score on applications, eviction rate, late-payment / NSF rate, and stable-employment percentage? A property-management company in the area should have these aggregated.
- How much new for-sale + rental construction is in the pipeline within 1–3 miles? Heavy new supply typically softens prices + rents 12–24 months out; constrained supply supports both.
Investment metrics
- 1% rule
- 1.16% ✓
- Cap rate
- 8.50%
- Cash-on-cash
- 7.88%
- DSCR
- 1.35
- GRM
- 7.2
CMA / ARV
- ARV (median comp)
- $140,869
- List price
- $114,900
- Delta
- -18.44%
- Verdict
- UNDERPRICED
- Comps
- 20 within 1.0 mi
Show comp detail 12 sales within ~0.75 mi
| Address | Dist | Beds/Ba | Sqft | Sold | Price | $/sf | Match |
|---|---|---|---|---|---|---|---|
| 9435 Eastchester Dr | 0.40mi | 3/1.0 | 1,195 (+5%) | 2mo | $55,500 | $46 | 70 |
| 2225 Kerwin Dr | 0.62mi | 3/1.0 | 1,135 (-0%) | 2mo | $135,900 | $120 | 68 |
| 1147 Jolene Dr | 0.42mi | 3/2.0 | 1,046 (-8%) | 1mo | $149,000 | $142 | 64 |
| 9481 Adler Ave | 0.45mi | 3/1.0 | 1,046 (-8%) | 3mo | $89,900 | $86 | 61 |
| 9742 Wendell Dr | 0.57mi | 3/1.0 | 1,014 (-11%) | 2mo | $69,900 | $69 | 52 |
| 9418 Pattonwood Dr | 0.46mi | 3/2.0 | 982 (-14%) | 3mo | $134,450 | $137 | 52 |
| 9468 Halls Ferry Rd | 0.41mi | 3/0.5 | 975 (-14%) | 2mo | $67,500 | $69 | 51 |
| 9828 Omega Dr | 0.56mi | 3/1.0 | 988 (-13%) | 0mo | $100,000 | $101 | 50 |
| 9426 Westchester Dr | 0.54mi | 2/1.0 (-1) | 982 (-14%) | 1mo | $68,900 | $70 | 44 |
| 1232 Forest Home Dr | 0.73mi | 3/1.0 | 975 (-14%) | 3mo | $114,900 | $118 | 38 |
| 9240 Hathaway Dr | 0.69mi | 2/1.0 (-1) | 982 (-14%) | 2mo | $130,000 | $132 | 37 |
| 1220 Duenke Dr | 0.68mi | 2/1.0 (-1) | 984 (-14%) | 3mo | $89,900 | $91 | 36 |
Match score weights: distance 35% · size 25% · config 20% · recency 20%. Top-matched comps best support the ARV.
Projected returns pro-forma
3.79% appreciation · 4.97% rent growth · sell at horizon
- IRR
- 18.0%
- Equity multiple
- 2.08×
- Total profit
- $34,896
- Equity at exit
- $56,851
- IRR
- 19.9%
- Equity multiple
- 4.23×
- Total profit
- $103,880
- Equity at exit
- $91,881
Cash invested: $32,172 (down + closing). Projections, not guarantees.
Landlord ↔ Tenant lean methodology
- Overall (STATE)
- 81 Strongly Landlord-Friendly
- State Missouri
- 81 Strongly Landlord-Friendly · R+10
- County
- — inherits STATE
- City
- — inherits STATE
ZIP-level market 63136
- Home prices YoY
- 0.9%
- Rents YoY
- 5.0%
- Active inventory
- 372
- Price-to-rent
- 7.2×
Monthly cashflow live
- Estimated rent
- $1,328 high interval (Pro) →
- Mortgage (P&I)
- −$603
- Tax from tax record
- −$188 /mo · $2,251/yr
- Insurance
- −$48
- HOA
- −$0
- Vacancy / Maint / Mgmt
- −$279
- Net cashflow
- $211
Break-even live
UW: 25.0% down · 7.5% · 30yr · 1.5% tax · 5.0% vac · 8.0% maint · 8.0% mgmt
Financing live
Cash to close
- Down payment
- $28,725
- Closing costs
- $3,447
- Reserves months
- —
- Total cash needed
- —
Loan-product check · same deal, 3 products live
Conventional
25% down · 7.5% · 30yr
- Down + closing
- —
- Monthly P&I
- —
- Monthly cashflow
- —
- DSCR
- —
- Eligible?
- —
Personal DTI + credit; lowest rate.
DSCR
20% down · 8.5% · 30yr
- Down + closing
- —
- Monthly P&I
- —
- Monthly cashflow
- —
- DSCR
- —
- Eligible?
- —
No personal income docs; deal must DSCR.
Hard money
10% down · 12.0% · 12mo
- Down + closing
- —
- Monthly P&I
- —
- Monthly cashflow
- —
- DSCR
- —
- Eligible?
- —
Short-term bridge; refi at stabilization.
Rent comps 40 comps
| Address | Beds | Baths | Sqft | Rent | $/sqft | DOM | Units | Dist |
|---|---|---|---|---|---|---|---|---|
| 1225 Newark Dr Saint Louis, MO | 3.0 | 2.0 | 944 | $1,400 | $1.48 | 3d | 1 | 0.41mi |
| 9418 Pattonwood Dr Saint Louis, MO | 2.0 | 2.0 | 982 | $1,500 | $1.53 | 23d | 1 | 0.45mi |
| 9723 Portage Dr Saint Louis, MO | 3.0 | 1.0 | 1014 | $1,450 | $1.43 | 7d | 1 | 0.51mi |
| 9744 Lanier Dr Saint Louis, MO | 3.0 | 1.0 | 1014 | $1,345 | $1.33 | 43d | 1 | 0.62mi |
| 2152 Nemnich Rd Saint Louis, MO | 2.0 | 1.5 | 1030 | $1,100 | $1.07 | 43d | 1 | 0.67mi |
| 9908 Norbridge Ln Saint Louis, MO | 2.0 | 2.0 | 1240 | $1,650 | $1.33 | 19d | 1 | 0.78mi |
| 2321 Noll Dr Saint Louis, MO | 3.0 | 1.0 | 975 | $1,320 | $1.35 | 23d | 1 | 0.88mi |
| 2056 Coleridge Dr Saint Louis, MO | 3.0 | 1.0 | 949 | $1,195 | $1.26 | 23d | 1 | 0.88mi |
| 1130 Forest Home Dr Saint Louis, MO | 3.0 | 1.0 | 1025 | $1,275 | $1.24 | 43d | 1 | 0.89mi |
| 956 Fontaine Pl Saint Louis, MO | 2.0 | 2.0 | 1192 | $1,400 | $1.17 | 23d | 1 | 0.94mi |
| 2326 Chambers Rd Saint Louis, MO | 2.0 | 1.0 | 1056 | $1,050 | $0.99 | 23d | 1 | 1.00mi |
| 960 Raford Ct St. Louis, MO | 2.0 | 1.0 | 750 | $950 | $1.27 | 23d | 1 | 1.00mi |
| 7 Lamar Dr Saint Louis, MO | 3.0 | 1.0 | 894 | $1,200 | $1.34 | 17d | 1 | 1.02mi |
| 2257 Chambers Rd Saint Louis, MO | 3.0 | 1.0 | 1200 | $1,400 | $1.17 | 23d | 1 | 1.03mi |
| 8817 Shady Grove Ave Saint Louis, MO | 2.0 | 1.0 | 1085 | $1,075 | $0.99 | 23d | 1 | 1.09mi |
| 2008 Kappel Dr Saint Louis, MO | 3.0 | 1.0 | 858 | $1,175 | $1.37 | 23d | 1 | 1.09mi |
| 1255 Bosworth Dr Saint Louis, MO | 3.0 | 1.0 | 1071 | $1,575 | $1.47 | 10d | 1 | 1.14mi |
| 3 Pohlman Ln Saint Louis, MO | 2.0 | 1.0 | 704 | $1,000 | $1.42 | 16d | 1 | 1.15mi |
| 10113 Duke Dr Saint Louis, MO | 3.0 | 1.0 | 770 | $1,325 | $1.72 | 43d | 1 | 1.17mi |
| 10112 Count Dr Saint Louis, MO | 2.0 | 1.0 | 792 | $1,000 | $1.26 | 7d | 1 | 1.20mi |
| 10113 Count Dr Saint Louis, MO | 2.0 | 1.0 | 882 | $775 | $0.88 | 43d | 1 | 1.20mi |
| 10139 Royal Dr Saint Louis, MO | 2.0 | 1.0 | 1016 | $900 | $0.89 | 43d | 1 | 1.21mi |
| 9517 West Ave Unit 1F St. Louis, MO | 3.0 | 1.0 | 1300 | $1,300 | $1.00 | 43d | 1 | 1.22mi |
| 8720 Akins Dr Saint Louis, MO | 2.0 | 1.0 | 1012 | $1,150 | $1.14 | 23d | 1 | 1.26mi |
| 605 Fremont Ave Saint Louis, MO | 2.0 | 1.0 | 750 | $995 | $1.33 | 43d | 1 | 1.29mi |
| 9709 Balboa Dr Saint Louis, MO | 3.0 | 1.0 | 1000 | $1,600 | $1.60 | 43d | 1 | 1.29mi |
| 9823 Winkler Dr Saint Louis, MO | 2.0 | 1.0 | 788 | $900 | $1.14 | 43d | 1 | 1.32mi |
| 9827 Winkler Dr Saint Louis, MO | 3.0 | 1.0 | 864 | $1,450 | $1.68 | 7d | 1 | 1.33mi |
| 1520 Attica Dr Saint Louis, MO | 2.0 | 1.0 | 1062 | $1,200 | $1.13 | 23d | 1 | 1.33mi |
| 9812 Balboa Dr Saint Louis, MO | 4.0 | 2.0 | 1500 | $1,495 | $1.00 | 21d | 1 | 1.33mi |
| 2022 McLaran Ave Saint Louis, MO | 3.0 | 2.0 | 1181 | $1,593 | $1.35 | 14d | 1 | 1.34mi |
| 2415 Shirley Ave Saint Louis, MO | 3.0 | 1.0 | 990 | $1,450 | $1.46 | 23d | 1 | 1.36mi |
| 1942 Damato Ct Saint Louis, MO | 2.0 | 1.0 | 905 | $1,100 | $1.22 | 43d | 1 | 1.39mi |
| 2617 Hord Ave Saint Louis, MO | 2.0 | 1.0 | 800 | $775 | $0.97 | 4d | 1 | 1.40mi |
| 9547 Glen Owen Dr Saint Louis, MO | 2.0 | 1.0 | 923 | $985 | $1.07 | 23d | 1 | 1.41mi |
| 1926 Chambers Rd Saint Louis, MO | 4.0 | 1.0 | 1095 | $995 | $0.91 | 14d | 1 | 1.42mi |
| 2427 Switzer Ave Saint Louis, MO | 3.0 | 1.0 | 1008 | $1,300 | $1.29 | 43d | 1 | 1.42mi |
| 8908 Scottdale Ave Jennings, MO | 2.0 | 1.0 | 790 | $1,000 | $1.27 | 43d | 1 | 1.43mi |
| 623 Ludlow Dr Saint Louis, MO | 2.0 | 1.0 | 840 | $1,199 | $1.43 | 23d | 1 | 1.44mi |
| 10200 Tappan Dr Saint Louis, MO | 3.0 | 1.0 | 912 | $1,450 | $1.59 | 16d | 1 | 1.46mi |
Listing history 20 events
-
2026-06-17status $114,900 Pending 41 DOM
-
2026-06-16days on market $114,900 Active 41 DOM
-
2026-06-15days on market $114,900 Active 40 DOM
-
2026-06-13days on market $114,900 Active 38 DOM
-
2026-06-13days on market $114,900 Active 37 DOM
-
2026-06-09days on market $114,900 Active 34 DOM
-
2026-06-08days on market $114,900 Active 33 DOM
-
2026-06-07days on market $114,900 Active 32 DOM
-
2026-06-05days on market $114,900 Active 29 DOM
-
2026-06-03days on market $114,900 Active 28 DOM
-
2026-06-02days on market $114,900 Active 27 DOM
-
2026-06-01days on market $114,900 Active 26 DOM
-
2026-05-31days on market $114,900 Active 25 DOM
-
2026-05-06$114,900 Active 1176-char remark
-
2019-11-01soldstatus $52,250
-
2019-10-30soldstatus Closed 450-char remark
Show marketing remark (450 chars)
Home needs a little TLC, but can be a fantastic all brick home on a nice corner lot,with a double car garage two fireplaces one in the open airy Lower Level with a lot of natural light and finished paneling with a built-in corner bar a second Gas fireplace in the living room with a full rock wall living room also has beautiful plaster cove molding Hardwood flouring though out take a look today for the investor or the do it your selfer
-
2019-10-15status Pending 450-char remark
Show marketing remark (450 chars)
Home needs a little TLC, but can be a fantastic all brick home on a nice corner lot,with a double car garage two fireplaces one in the open airy Lower Level with a lot of natural light and finished paneling with a built-in corner bar a second Gas fireplace in the living room with a full rock wall living room also has beautiful plaster cove molding Hardwood flouring though out take a look today for the investor or the do it your selfer
-
2019-08-28price $65,000 450-char remark
Show marketing remark (450 chars)
Home needs a little TLC, but can be a fantastic all brick home on a nice corner lot,with a double car garage two fireplaces one in the open airy Lower Level with a lot of natural light and finished paneling with a built-in corner bar a second Gas fireplace in the living room with a full rock wall living room also has beautiful plaster cove molding Hardwood flouring though out take a look today for the investor or the do it your selfer
-
2019-06-13$75,000 Active 450-char remark
Show marketing remark (450 chars)
Home needs a little TLC, but can be a fantastic all brick home on a nice corner lot,with a double car garage two fireplaces one in the open airy Lower Level with a lot of natural light and finished paneling with a built-in corner bar a second Gas fireplace in the living room with a full rock wall living room also has beautiful plaster cove molding Hardwood flouring though out take a look today for the investor or the do it your selfer
-
2001-04-02soldstatus
ⓘ Source: listings_history table (triggers on properties + properties_extension) + one-shot
backfill from property_details.listing_events for pre-trigger history.
Tax reassessment forecast MO · Resets to sale price
- Current annual tax
- $2,251 · $188/mo
- Projected year-2 tax
- $2,251 · $188/mo
- Expected delta
- $0/yr ($0/mo · 0.0%)
ⓘ Screening estimate from a state-policy table — verify with the county assessor before closing.
Climate risk First Street
- Flood 1/10 Low FEMA zone X (unshaded) · 0% chance over 30 yrs
- Wildfire 1/10 Low
- Heat 5/10 Major 7 d/yr ≥107°F today · 21 d/yr by 30 yrs out
- Wind 2/10 Low 100% chance of damaging wind over 30 yrs
- Air quality 4/10 Moderate 5 unhealthy d/yr today · 6 by 30 yrs out
Nearby sold comps map
Loading sold comps map…
Walkable amenities ~0.75 mi
Loading nearby amenities…
Taxation est. · year 1
- Rental income
- $15,937
- − Mortgage interest
- −$6,436
- − Property taxes
- −$2,251
- − Insurance
- −$574
- − Repairs & maintenance
- −$1,275
- − Management
- −$1,275
- − Depreciation
- −$3,343
- Taxable income
- $782
- Est. tax owed @ 24.0%
- −$188
- After-tax cash flow
- $2,346/yr
For passive investors: Depreciation is non-cash, so a rental often shows a tax loss while cash-flowing — sheltering income. Rental losses are passive: they offset passive income freely, and up to $25,000/yr can offset ordinary (W-2) income if you actively participate and your MAGI is under $100k (phasing out to $0 by $150k); unused losses carry forward. On sale, claimed depreciation is recaptured at up to 25%, and gains may owe capital-gains tax (a 1031 exchange can defer both). Figures are a year-1 estimate at your 24.0% rate — not tax advice; consult a CPA.
Schools (NCES district)
- District
- Riverview Gardens
- NCES district ID
- 2926670
- Math proficiency
- 2% ▼ -6.00%
- Reading proficiency
- 9% ▼ -6.00%
- Median HH income
- $32,759
- Composite
- 4.22/100
- National rank
- #10058
- State rank
- #324 of 324 in MO
Livability — Moline Acres
- Score
- 60/100
- State rank
- #480
- US rank
- #18899
Category grades
Schools grade is shown separately in the Schools card above.
Census & demographics
- Census place
- Moline Acres, MO
- County
- Saint Louis County · 888,823 people
- Metro
- St. Louis, MO-IL
- Population (ZIP)
- 40,929
- Household income
- $41,154
- Rent vs Own
- Severe rent burden
- 3085.0
Population outlook (St. Louis County) Hauer SSP2
- Today (2025)
- 1,025,227 people
- By 2030
- 1,028,023 · +0.3%
- By 2040
- 1,020,940 · -0.4%
- By 2050
- 1,007,280 · -1.8%
- By 2075
- 987,277 · -3.7%
- By 2100
- 921,984 · -10.1%
Race, ethnicity, and origin ACS 2023
- Neighborhood character
- Predominantly Black (90%)
- Race & ethnicity
- Black 90% White 5% Two or more races 3%
- Foreign-born
- 1% · Canada
Political lean MEDSL · St. Louis
- 2024 margin
- Strong D (+23.4) · D 60.8% · R 37.4% · Other 1.7%
- 2008→2024 swing
- +3.5pp toward D · 2008: 19.9pp · 2024: 23.4pp
- All cycles
- 2024: D+23.4 2020: D+24.0 2016: D+16.2 2012: D+13.7 2008: D+19.9
Not yet ingested
- Civics
- —
Market trends
- HPI YoY
- ▲ 3.79%
- Current HPI
- 420.28
- Rent YoY
- ▲ 4.97%
- Metro
- St. Louis, MO-IL
- State GDP YoY
- ▲ 1.84%
- F500 in state
- 20
Industry mix (Fortune 500 HQ in MO)
| Industry | F500 HQs | Revenue |
|---|---|---|
| Healthcare | 1 | $163B |
|
||
| Insurance | 1 | $21B |
|
||
| Industrial Technology | 1 | $17B |
|
||
| Retail | 1 | $16B |
|
||
| Industrial Distribution | 1 | $10B |
|
||
| Utilities | 1 | $9B |
|
||
Price history
+53.2% since first listed8 events — show timeline
- 2026-06-17 Pending — MARIS as Distributed by MLS Grid
- 2026-05-06 Listed $114,900 MARIS as Distributed by MLS Grid
- 2019-11-01 Sold (Public Records) $52,250 Public Records
- 2019-10-30 Sold (MLS) — MARIS as Distributed by MLS Grid
- 2019-10-15 Pending — MARIS as Distributed by MLS Grid
- 2019-08-28 Price Changed $65,000 MARIS as Distributed by MLS Grid
- 2019-06-13 Listed $75,000 MARIS as Distributed by MLS Grid
- 2001-04-02 Sold (Public Records) — Public Records
Property tax history
+5.1%/yrLatest (2022): $2,251 · +0.8% YoY. Source: county tax records.
Cash-flow waterfall
monthlySold comps — $/sqft
last 12 mo · ≤1 miLoading sold comps…