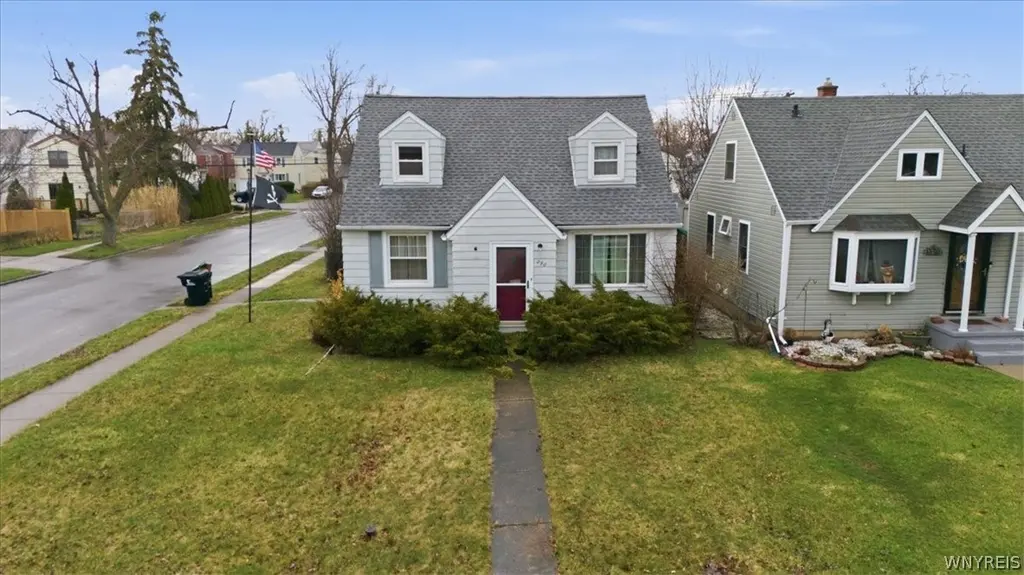
290 Traverse Blvd · Tonawanda Town, NY
Flood risk 1/10 · Minimal
- FEMA flood zone
- X (unshaded)
- Chance of flooding over 30 yrs
- 0.0%
- Est. flood insurance / yr
- $473 – $860
Fire risk 1/10 · Minimal
- Est. fire insurance / yr
- $691 – $1,283
Heat risk 2/10 · Minimal
- Hot days now (above 93°F)
- 7 days/yr
- Hot days in 30 yrs
- 15 days/yr
Wind risk 1/10 · Minimal
- Chance of severe wind over 30 yrs
- —
Air-quality risk 3/10 · Minor
- Unhealthy air days now
- 3 days/yr
- Unhealthy air days in 30 yrs
- 4 days/yr
Risk factors via First Street. Map © Google.
Why this score? — see what drove the C- grade
The composite is a weighted blend of 9 inputs, each scored 0–100. Each bar is that input's sub-score; the figure is the points it added to the 100-point composite (weight × sub-score).
- ARV discount +15.0/15.0
- Cash flow +14.3/30.0
- 1% rule +5.8/10.0
- DSCR +4.4/10.0
- Schools +3.9/10.0
- Rent growth +2.5/5.0
- Livability +2.5/5.0
- Condition / age +2.5/5.0
- Appreciation +0.0/10.0
$185,000
🖨 Deal sheet (PDF) 📄 Offer letter ✓ Due diligence
Listing remarks MLS
Very cute Cape Cod! Two bdrms on the first floor, and two upstairs or a Primary Suite with half bath. Replacement windows, neutral decor awaits your personal touch. LR/DR combo flows from eat-in kitchen. Large corner lot, fully fenced yard.
Key facts
- Updated electrical
- Tankless hot water
- Forced air heating
Tags
Neighborhood map
What this means for you Summary
Snapshot
- This is a 3-bed/1.5-bath single-family listed at $185k.
Deal economics
- At list price, monthly cash flow is $35 ($422/yr) — positive.
- The deal already cash-flows at list — no discount required.
- Meets the 1% rule at list price ($2k rent vs $185k).
- Cap rate 6.5% vs local median 4.1% in Tonawanda Town — top-decile yield for the area; either an underpriced asset or a hidden risk that comps aren't pricing in. Stress-test before assuming the spread holds.
Location & tenants
- Location reads: area grade C — affects rentability + tenant quality, not the cash-flow math above.
- Kenmore-Tonawanda Union Free School District (suburban): math 44% / reading 47% proficiency, ranked #453 of 590 in NY (top 77%) — families likely to look elsewhere, expect single-tenant / working-renter base with shorter leases.
- Zoned schools: Herbert Hoover Elementary School (math 37% / reading 52%, grade F, #1,277 of 2,108 statewide, top 64%, 565 students, 43% FRL); Herbert Hoover Middle School (math 24% / reading 39%, grade F, #522 of 729 statewide, top 73%, 758 students, 51% FRL); Kenmore West Senior High School (math 74% / reading 57%, grade B, #773 of 1,100 statewide, top 70%, 1,358 students, 51% FRL) — zoned schools average 48% FRL vs 33% district-wide (15 pts higher); higher-poverty schools than district average — tighter screening recommended.
- Market conditions: 122 active listings in the ZIP; 11 comparable units currently listed for rent nearby; rentals at typical pace (median 26d on market — plan ~3-4 weeks tenant-placement turnaround); solid renter incomes; 1,244 units permitted in Erie County in 2024 (563 in 5+ unit buildings).
Forward outlook
- Local home prices are declining (-3.0%/yr); year-one equity from $1k of loan paydown is wiped out by about $6k of value loss. Plan a longer hold.
Negotiation context
- Only 5 days on market — expect competitive offers; lowballing is unlikely to land.
- 2 sale attempts since 5y ago with the ask held roughly flat each time — persistent listings suggest the price (not the market) is what's stuck; bring a comps-based counter.
Risks & watch-outs
- Watch-outs: property tax is 3.3% of price; built in 1950 — expect roof / HVAC / electrical / plumbing capex.
Questions for the listing agent
- Built in 1950 — when were the roof, HVAC, electrical panel, plumbing, and water heater last replaced?
- Property tax is high relative to price — has the assessment been appealed recently, and will the sale trigger a re-assessment?
- Is there a deadline driving the sale (1031 exchange, divorce, estate, relocation)? That informs how much negotiation room exists.
- What's the average days-on-market for RENTAL listings here right now (not sales)? A rising rental-DOM trend means longer vacancies and softer asking-rent achievability than the comps imply.
- What's the recent tenant-quality profile in this submarket — average credit score on applications, eviction rate, late-payment / NSF rate, and stable-employment percentage? A property-management company in the area should have these aggregated.
- How much new for-sale + rental construction is in the pipeline within 1–3 miles? Heavy new supply typically softens prices + rents 12–24 months out; constrained supply supports both.
Investment metrics
- 1% rule
- 1.08% ✓
- Cap rate
- 6.52%
- Cash-on-cash
- 0.81%
- DSCR
- 1.04
- GRM
- 7.7
CMA / ARV
- ARV (on-the-fly)
- $293,480
- Comps found
- 12
Show comp detail 12 sales within ~0.75 mi
| Address | Dist | Beds/Ba | Sqft | Sold | Price | $/sf | Match |
|---|---|---|---|---|---|---|---|
| 207 Zimmerman Blvd | 0.17mi | 3/2.0 | 1,389 (+4%) | 0mo | $280,000 | $202 | 83 |
| 259 Traverse Blvd | 0.07mi | 2/1.0 (-1) | 1,248 (-6%) | 0mo | $293,000 | $235 | 79 |
| 110 Traverse Blvd | 0.35mi | 3/1.5 | 1,290 (-3%) | 2mo | $255,000 | $198 | 77 |
| 435 Zimmerman Blvd | 0.27mi | 3/1.0 | 1,254 (-6%) | 1mo | $210,000 | $167 | 75 |
| 119 Orchard Dr | 0.48mi | 3/1.5 | 1,414 (+6%) | 1mo | $230,000 | $163 | 67 |
| 11 Colvinhurst Dr | 0.50mi | 3/2.0 | 1,400 (+5%) | 2mo | $333,000 | $238 | 65 |
| 175 Cleveland Dr | 0.28mi | 4/2.0 (+1) | 1,470 (+10%) | 1mo | $330,000 | $224 | 62 |
| 71 Gardenwood Ln | 0.36mi | 3/1.5 | 1,499 (+12%) | 3mo | $237,750 | $159 | 60 |
| 177 Mcconkey Dr | 0.44mi | 3/1.0 | 1,200 (-10%) | 2mo | $250,000 | $208 | 59 |
| 86 Highland Pkwy | 0.67mi | 3/1.5 | 1,428 (+7%) | 1mo | $342,500 | $240 | 56 |
| 131 Colvinhurst Dr | 0.57mi | 3/1.0 | 1,170 (-12%) | 0mo | $260,000 | $222 | 51 |
| 74 Old Colony Ave | 0.64mi | 3/1.0 | 1,160 (-13%) | 1mo | $255,000 | $220 | 45 |
Match score weights: distance 35% · size 25% · config 20% · recency 20%. Top-matched comps best support the ARV.
Projected returns pro-forma
-3.0% appreciation · 3.0% rent growth · sell at horizon
- IRR
- -14.9%
- Equity multiple
- 0.47×
- Total profit
- $-27,541
- Equity at exit
- $27,584
- IRR
- -6.0%
- Equity multiple
- 0.61×
- Total profit
- $-20,299
- Equity at exit
- $15,995
Cash invested: $51,800 (down + closing). Projections, not guarantees.
Landlord ↔ Tenant lean methodology
- Overall (STATE)
- 15 Strongly Tenant-Friendly
- State New York
- 15 Strongly Tenant-Friendly · D+10
- County
- — inherits STATE
- City
- — inherits STATE
ZIP-level market 14223
- Active inventory
- 122
- Price-to-rent
- 7.7×
Monthly cashflow live
- Estimated rent
- $2,006 high interval (Pro) →
- Mortgage (P&I)
- −$970
- Tax from tax record
- −$502 /mo · $6,025/yr
- Insurance
- −$77
- HOA
- −$0
- Vacancy / Maint / Mgmt
- −$421
- Net cashflow
- $35
Break-even live
Sensitivity live
| Price | -10% $140 | -5% $88 | +0% $35 | +5% $-17 | +10% $-70 |
|---|---|---|---|---|---|
| Rent | -10% $-123 | -5% $-44 | +0% $35 | +5% $114 | +10% $194 |
| Rate | -1.0pp $128 | -0.5pp $82 | base $35 | +0.5pp $-13 | +1.0pp $-62 |
UW: 25.0% down · 7.5% · 30yr · 1.5% tax · 5.0% vac · 8.0% maint · 8.0% mgmt
Financing live
Cash to close
- Down payment
- $46,250
- Closing costs
- $5,550
- Reserves months
- —
- Total cash needed
- —
Loan-product check · same deal, 3 products live
Conventional
25% down · 7.5% · 30yr
- Down + closing
- —
- Monthly P&I
- —
- Monthly cashflow
- —
- DSCR
- —
- Eligible?
- —
Personal DTI + credit; lowest rate.
DSCR
20% down · 8.5% · 30yr
- Down + closing
- —
- Monthly P&I
- —
- Monthly cashflow
- —
- DSCR
- —
- Eligible?
- —
No personal income docs; deal must DSCR.
Hard money
10% down · 12.0% · 12mo
- Down + closing
- —
- Monthly P&I
- —
- Monthly cashflow
- —
- DSCR
- —
- Eligible?
- —
Short-term bridge; refi at stabilization.
Rent comps 11 comps
| Address | Beds | Baths | Sqft | Rent | $/sqft | DOM | Units | Dist |
|---|---|---|---|---|---|---|---|---|
| 148 Colonial Ave Buffalo, NY | 4.0 | 2.0 | 1240 | $2,900 | $2.34 | 25d | 1 | 0.83mi |
| 49 Tulane Rd Buffalo, NY | 2.0 | 1.0 | 1100 | $1,600 | $1.45 | 19d | 1 | 0.87mi |
| 52 Somerton Ave Unit Upper Buffalo, NY | 2.0 | 1.0 | 900 | $1,200 | $1.33 | 25d | 1 | 1.02mi |
| 52 Kenwood Rd Unit 1 Buffalo, NY | 2.0 | 1.0 | 1100 | $1,250 | $1.14 | 25d | 1 | 1.11mi |
| 3113 Delaware Ave Unit 1 Buffalo, NY | 2.0 | 1.0 | 1083 | $1,200 | $1.11 | 25d | 1 | 1.11mi |
| 1835 Military Rd Buffalo, NY | 2.0 | 1.0 | 1064 | $2,175 | $2.04 | 19d | 1 | 1.13mi |
| 2776 Eggert Rd #2 Tonawanda, NY | 3.0 | 1.0 | 972 | $1,600 | $1.65 | 25d | 1 | 1.22mi |
| 237 W Girard Blvd Buffalo, NY | 4.0 | 1.5 | 1329 | $4,000 | $3.01 | 25d | 1 | 1.28mi |
| 53 Winkler Dr Tonawanda, NY | 3.0 | 1.0 | 1060 | $2,100 | $1.98 | 13d | 1 | 1.33mi |
| 954 Brighton Rd Tonawanda, NY | 3.0 | 2.0 | 1560 | $1,700 | $1.09 | 5d | 1 | 1.33mi |
| 172 Tremont Ave Kenmore, NY | 3.0 | 1.5 | 1569 | $2,500 | $1.59 | 12d | 1 | 1.47mi |
Listing history 7 events
-
2026-04-06status Pending
-
2026-04-01$185,000 Active
-
2021-11-15soldstatus $180,000 Closed Sale or Rented 240-char remark
Show marketing remark (240 chars)
Very cute Cape Cod! Two bdrms on the first floor, and two upstairs or a Primary Suite with half bath. Replacement windows, neutral decor awaits your personal touch. LR/DR combo flows from eat-in kitchen. Large corner lot, fully fenced yard.
-
2021-11-15soldstatus $180,000
Show marketing remark (240 chars)
Very cute Cape Cod! Two bdrms on the first floor, and two upstairs or a Primary Suite with half bath. Replacement windows, neutral decor awaits your personal touch. LR/DR combo flows from eat-in kitchen. Large corner lot, fully fenced yard.
-
2021-09-14status Under Contract- Do Not Show 240-char remark
Show marketing remark (240 chars)
Very cute Cape Cod! Two bdrms on the first floor, and two upstairs or a Primary Suite with half bath. Replacement windows, neutral decor awaits your personal touch. LR/DR combo flows from eat-in kitchen. Large corner lot, fully fenced yard.
-
2021-08-26$169,900 Active 240-char remark
Show marketing remark (240 chars)
Very cute Cape Cod! Two bdrms on the first floor, and two upstairs or a Primary Suite with half bath. Replacement windows, neutral decor awaits your personal touch. LR/DR combo flows from eat-in kitchen. Large corner lot, fully fenced yard.
-
2007-04-13soldstatus $105,000
ⓘ Source: listings_history table (triggers on properties + properties_extension) + one-shot
backfill from property_details.listing_events for pre-trigger history.
Tax reassessment forecast NY · Partial reset (capped growth)
- Current annual tax
- $6,025 · $502/mo
- Projected year-2 tax
- $6,025 · $502/mo
- Expected delta
- $0/yr ($0/mo · 0.0%)
ⓘ Screening estimate from a state-policy table — verify with the county assessor before closing.
Climate risk First Street
- Flood 1/10 Low FEMA zone X (unshaded) · 0% chance over 30 yrs
- Wildfire 1/10 Low
- Heat 2/10 Low 7 d/yr ≥93°F today · 15 d/yr by 30 yrs out
- Wind 1/10 Low
- Air quality 3/10 Moderate 3 unhealthy d/yr today · 4 by 30 yrs out
Nearby sold comps map
Loading sold comps map…
Walkable amenities ~0.75 mi
Loading nearby amenities…
Taxation est. · year 1
- Rental income
- $24,068
- − Mortgage interest
- −$10,363
- − Property taxes
- −$6,025
- − Insurance
- −$925
- − Repairs & maintenance
- −$1,925
- − Management
- −$1,925
- − Depreciation
- −$5,382
- Taxable loss
- −$2,477
- Est. tax savings @ 24.0%
- +$595
- After-tax cash flow
- $1,017/yr
For passive investors: Depreciation is non-cash, so a rental often shows a tax loss while cash-flowing — sheltering income. Rental losses are passive: they offset passive income freely, and up to $25,000/yr can offset ordinary (W-2) income if you actively participate and your MAGI is under $100k (phasing out to $0 by $150k); unused losses carry forward. On sale, claimed depreciation is recaptured at up to 25%, and gains may owe capital-gains tax (a 1031 exchange can defer both). Figures are a year-1 estimate at your 24.0% rate — not tax advice; consult a CPA.
Schools (NCES district)
- District
- Kenmore-Tonawanda Union Free School District
- NCES district ID
- 3616230
- Math proficiency
- 44% ▼ -12.00%
- Reading proficiency
- 47% ▼ -1.00%
- Median HH income
- $51,433
- Composite
- 39.18/100
- National rank
- #4024
- State rank
- #453 of 590 in NY
Livability — Tonawanda Town
No livability data for this city. (Only ~50 U.S. cities are tracked.)
Census & demographics
- Census place
- Tonawanda Town, NY
- County
- Erie County · 714,559 people
- City population
- 63,948
- Metro
- Buffalo-Cheektowaga, NY
- Population (ZIP)
- 22,611
- Household income
- $84,161
- Rent vs Own
- Severe rent burden
- 368.0
Population outlook (Erie County) Hauer SSP2
- Today (2025)
- 933,037 people
- By 2030
- 935,181 · +0.2%
- By 2040
- 928,531 · -0.5%
- By 2050
- 905,725 · -2.9%
- By 2075
- 834,037 · -10.6%
- By 2100
- 708,033 · -24.1%
Race, ethnicity, and origin ACS 2023
- Neighborhood character
- Predominantly White (84%)
- Race & ethnicity
- White 84% Asian 5% Two or more races 4% Black 4% Hispanic / Latino 3%
- Common ancestry
- Romanian 12% Slovak 2% Lithuanian 2%
- Foreign-born
- 7% · Canada, Vietnam, India
- Languages at home
- 92% English-only · Other Indo-European 3% French/Haitian/Cajun 1% Arabic 1%
Political lean MEDSL · Erie
- 2024 margin
- Lean D (+9.7) · D 54.8% · R 45.2%
- 2008→2024 swing
- -7.9pp toward R · 2008: 17.5pp · 2024: 9.7pp
- All cycles
- 2024: D+9.7 2020: D+14.7 2016: D+4.8 2012: D+15.6 2008: D+17.5
Not yet ingested
- Civics
- —
Market trends
- HPI YoY
- ▼ -245.18%
- Current HPI
- 320.9379
- Rent YoY
- —
- Metro
- Buffalo-Cheektowaga, NY
- State GDP YoY
- ▲ 2.60%
- F500 in state
- 92
Industry mix (Fortune 500 HQ in NY)
| Industry | F500 HQs | Revenue |
|---|---|---|
| Financial Services | 10 | $950B |
|
||
| Consumer Goods | 9 | $162B |
|
||
| Insurance | 4 | $225B |
|
||
| Telecommunications | 2 | $144B |
|
||
| Pharmaceuticals | 2 | $112B |
|
||
| Media / Entertainment | 2 | $69B |
|
||
Price history
+76.2% since first listed7 events — show timeline
- 2026-04-06 Pending — WNYREIS
- 2026-04-01 Listed $185,000 WNYREIS
- 2021-11-15 Sold (Public Records) $180,000 Public Records
- 2021-11-15 Sold (MLS) $180,000 WNYREIS
- 2021-09-14 Pending — WNYREIS
- 2021-08-26 Listed $169,900 WNYREIS
- 2007-04-13 Sold (Public Records) $105,000 Public Records
Property tax history
+3.8%/yrLatest (2025): $6,025 · +1.1% YoY. Source: county tax records.
Cash-flow waterfall
monthlySold comps — $/sqft
last 12 mo · ≤1 miLoading sold comps…