 🏷️ Likely Rental
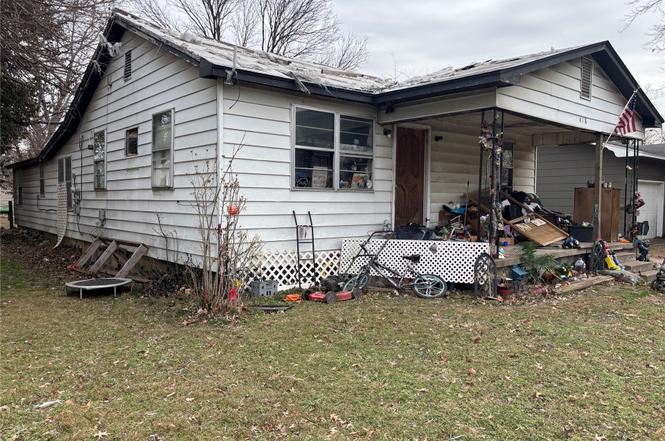
418 S Thompson · Vinita, OK
Flood risk 1/10 · Minimal
- FEMA flood zone
- X (unshaded)
- Chance of flooding over 30 yrs
- 0.0%
- Est. flood insurance / yr
- $507 – $1,088
Fire risk 5/10 · Moderate
- Est. fire insurance / yr
- $2,463 – $4,575
Heat risk 6/10 · Moderate
- Hot days now (above 110°F)
- 7 days/yr
- Hot days in 30 yrs
- 20 days/yr
Wind risk 2/10 · Minimal
- Chance of severe wind over 30 yrs
- 3.0%
Air-quality risk 2/10 · Minimal
- Unhealthy air days now
- 1 days/yr
- Unhealthy air days in 30 yrs
- 2 days/yr
Risk factors via First Street. Map © Google.
Why this score? — see what drove the B+ grade
The composite is a weighted blend of 9 inputs, each scored 0–100. Each bar is that input's sub-score; the figure is the points it added to the 100-point composite (weight × sub-score).
- Cash flow +30.0/30.0
- 1% rule +10.0/10.0
- DSCR +10.0/10.0
- Appreciation +10.0/10.0
- ARV discount +7.5/15.0
- Livability +3.2/5.0
- Rent growth +2.5/5.0
- Condition / age +2.5/5.0
- Schools +1.8/10.0
$41,000
🖨 Deal sheet (PDF) 📄 Offer letter ✓ Due diligence
Listing remarks
Check out this investment opportunity! Tenant in place. Property sold as-is with potential for improvements. Exterior viewing only, no interior access. Contact me for details!
Key facts
- 7,500 sq ft lot
- Garage
- Built 1935
Property features AI
Exterior
- Parking: Detached garage (1 car)
- Security: No safety shelter
- Utilities: Electricity available; Natural gas available; Public water; Public sewer
- Home design: Single-story home; Faces west; Crawlspace foundation
- Construction: Vinyl siding with wood frame construction; Asphalt/fiberglass roof; Built from public records
- Exterior features: Covered porch
Interior
- Bathrooms: 1 full bathroom
- Heating & cooling: Gas heating
- Interior features: No notable interior features listed
Neighborhood map
What this means for you Summary
Snapshot
- This is a 2-bed/1.0-bath single-family listed at $41k.
Deal economics
- At list price, monthly cash flow is $622 ($7k/yr) — positive.
- The deal already cash-flows at list — no discount required.
- Meets the 1% rule at list price ($1k rent vs $41k).
- Recommended offer: $36k (12.0% below list) — sets the bar for market timing.
- Cap rate 24.5% vs local median 4.7% in Vinita — top-decile yield for the area; either an underpriced asset or a hidden risk that comps aren't pricing in. Stress-test before assuming the spread holds.
Location & tenants
- Location reads 63/100 on livability (#227 in OK) — a middle-class / working-renter tenant base. Strengths: cost of living A+, housing A+, crime B; Watch: amenities F, commute F, employment F.
- Vinita (town): math 24% / reading 20% proficiency, ranked #156 of 270 in OK (top 58%) — low school quality limits family demand, transient renter base, plan for 1-2y turnover.
- Zoned schools: Vinita Es (math 33% / reading 18%, grade F, #345 of 845 statewide, top 41%, 595 students, 0% FRL); Ewing Halsell Ms (math 17% / reading 20%, grade F, #182 of 345 statewide, top 53%, 307 students, 0% FRL); Vinita Hs (math 22% / reading 27%, grade F, #150 of 447 statewide, top 48%, 419 students, 0% FRL) — zoned schools average 0% FRL vs 56% district-wide (56 pts lower); this property's tenant base skews higher-income than the district average.
- Market conditions: 113 active listings in the ZIP; 1 comparable units currently listed for rent nearby; 24 units permitted in Craig County in 2024 (0 in 5+ unit buildings).
Forward outlook
- In year one you build about $4k of equity ($283 loan paydown + $4k appreciation (10.0% local appreciation)).
- Craig County population projected to shrink 7% by 2050 — rents likely to lag national; underwrite the cash flow, not the appreciation.
- At projected returns (10.0% appreciation + 3.0% rent growth), your $11k cash investment doubles in ~1 year — after that, you're playing with house money.
- By year 7, paydown + projected appreciation supports a ~$32k cash-out refi (75% LTV) — recoverable capital for the next deal without selling this one.
Negotiation context
- It's been on market 148 days — a 12% lower offer ($36k) is reasonable based on typical stale-listing flexibility.
Risks & watch-outs
- Watch-outs: built in 1935 — expect roof / HVAC / electrical / plumbing capex.
- Climate carrying-cost: moderate wildfire risk; extreme-heat days projected 7→20/yr by 2055 (HVAC capex compounding) — expect insurance premiums to compound above CPI over the hold.
Questions for the listing agent
- It's been on market 148 days. Have you received any prior offers? Is the seller open to a 12% concession, seller financing, or rate buy-down credit?
- Built in 1935 — when were the roof, HVAC, electrical panel, plumbing, and water heater last replaced?
- Why hasn't it sold? Are there any deal-killer items the seller is aware of (foundation, flood, title, zoning, code violations)?
- Is there a deadline driving the sale (1031 exchange, divorce, estate, relocation)? That informs how much negotiation room exists.
- Schools are F-rated, which usually means shorter tenancies and higher turnover. Who's the typical renter profile here, and what's been the actual vacancy rate?
- What's the average days-on-market for RENTAL listings here right now (not sales)? A rising rental-DOM trend means longer vacancies and softer asking-rent achievability than the comps imply.
- What's the recent tenant-quality profile in this submarket — average credit score on applications, eviction rate, late-payment / NSF rate, and stable-employment percentage? A property-management company in the area should have these aggregated.
- How much new for-sale + rental construction is in the pipeline within 1–3 miles? Heavy new supply typically softens prices + rents 12–24 months out; constrained supply supports both.
Investment metrics
- 1% rule
- 2.68% ✓
- Cap rate
- 24.51%
- Cash-on-cash
- 65.07%
- DSCR
- 3.90
- GRM
- 3.1
CMA / ARV
- ARV (on-the-fly)
- $152,568
- Comps found
- 6
Show comp detail 6 sales within ~0.75 mi
| Address | Dist | Beds/Ba | Sqft | Sold | Price | $/sf | Match |
|---|---|---|---|---|---|---|---|
| 501 S Miller St | 0.22mi | 3/2.0 (+1) | 1,260 (-3%) | 1mo | $215,000 | $171 | 74 |
| 617 S Thompson St | 0.26mi | 3/2.0 (+1) | 1,344 (+3%) | 1mo | $80,000 | $60 | 73 |
| 504 S Foreman St | 0.32mi | 2/1.0 | 1,232 (-6%) | 21mo | $68,200 | $55 | 58 |
| 103 S Brown | 0.71mi | 2/2.0 | 1,326 (+2%) | 8mo | $65,000 | $49 | 53 |
| 240 S 2nd | 0.43mi | 2/2.0 | 1,128 (-14%) | 9mo | $139,900 | $124 | 46 |
| 122 Prairie Ln | 0.35mi | 3/2.0 (+1) | 1,484 (+14%) | 15mo | $174,000 | $117 | 39 |
Match score weights: distance 35% · size 25% · config 20% · recency 20%. Top-matched comps best support the ARV.
Projected returns pro-forma
10.0% appreciation · 3.0% rent growth · sell at horizon
- IRR
- 76.6%
- Equity multiple
- 6.40×
- Total profit
- $61,970
- Equity at exit
- $36,936
- IRR
- 70.6%
- Equity multiple
- 14.18×
- Total profit
- $151,303
- Equity at exit
- $79,654
Cash invested: $11,480 (down + closing). Projections, not guarantees.
Landlord ↔ Tenant lean methodology
- Overall (STATE)
- 83 Strongly Landlord-Friendly
- State Oklahoma
- 83 Strongly Landlord-Friendly · R+20
- County
- — inherits STATE
- City
- — inherits STATE
ZIP-level market 74301
- Home prices YoY
- 7.1%
- Active inventory
- 113
- Price-to-rent
- 3.1×
Monthly cashflow live
- Estimated rent
- $1,100 medium interval (Pro) →
- Mortgage (P&I)
- −$215
- Tax from tax record
- −$14 /mo · $173/yr
- Insurance
- −$17
- HOA
- −$0
- Vacancy / Maint / Mgmt
- −$231
- Net cashflow
- $622
Break-even live
Sensitivity live
| Price | -10% $646 | -5% $634 | +0% $622 | +5% $611 | +10% $599 |
|---|---|---|---|---|---|
| Rent | -10% $536 | -5% $579 | +0% $622 | +5% $666 | +10% $709 |
| Rate | -1.0pp $643 | -0.5pp $633 | base $622 | +0.5pp $612 | +1.0pp $601 |
UW: 25.0% down · 7.5% · 30yr · 1.5% tax · 5.0% vac · 8.0% maint · 8.0% mgmt
Financing live
Cash to close
- Down payment
- $10,250
- Closing costs
- $1,230
- Reserves months
- —
- Total cash needed
- —
Loan-product check · same deal, 3 products live
Conventional
25% down · 7.5% · 30yr
- Down + closing
- —
- Monthly P&I
- —
- Monthly cashflow
- —
- DSCR
- —
- Eligible?
- —
Personal DTI + credit; lowest rate.
DSCR
20% down · 8.5% · 30yr
- Down + closing
- —
- Monthly P&I
- —
- Monthly cashflow
- —
- DSCR
- —
- Eligible?
- —
No personal income docs; deal must DSCR.
Hard money
10% down · 12.0% · 12mo
- Down + closing
- —
- Monthly P&I
- —
- Monthly cashflow
- —
- DSCR
- —
- Eligible?
- —
Short-term bridge; refi at stabilization.
Rent comps 1 comps
| Address | Beds | Baths | Sqft | Rent | $/sqft | DOM | Units | Dist |
|---|---|---|---|---|---|---|---|---|
| 229 S 5th St Vinita, OK | 2.0 | 1.0 | 970 | $1,100 | $1.13 | 3d | 1 | 0.61mi |
Listing history 21 events
-
2026-06-21days on market $41,000 Active 148 DOM
-
2026-06-21days on market $41,000 Active 147 DOM
-
2026-06-18days on market $41,000 Active 145 DOM
-
2026-06-17days on market $41,000 Active 144 DOM
-
2026-06-16days on market $41,000 Active 143 DOM
-
2026-06-15days on market $41,000 Active 142 DOM
-
2026-06-13days on market $41,000 Active 140 DOM
-
2026-06-12days on market $41,000 Active 139 DOM
-
2026-06-09days on market $41,000 Active 136 DOM
-
2026-06-08days on market $41,000 Active 135 DOM
-
2026-06-08days on market $41,000 Active 134 DOM
-
2026-06-07days on market $41,000 Active 133 DOM
-
2026-06-04days on market $41,000 Active 130 DOM
-
2026-06-02days on market $41,000 Active 129 DOM
-
2026-06-01days on market $41,000 Active 128 DOM
-
2026-05-31days on market $41,000 Active 127 DOM
-
2026-05-23price $41,000
-
2026-05-23price $25,000
-
2026-04-21price $41,000
-
2026-01-28price $36,000
-
2026-01-24$50,000 Active
ⓘ Source: listings_history table (triggers on properties + properties_extension) + one-shot
backfill from property_details.listing_events for pre-trigger history.
Tax reassessment forecast OK · Resets to sale price
- Current annual tax
- $173 · $14/mo
- Projected year-2 tax
- $369 · $31/mo
- Expected delta
- +$196/yr (+$16/mo · 113.3%)
ⓘ Screening estimate from a state-policy table — verify with the county assessor before closing.
Climate risk First Street
- Flood 1/10 Low FEMA zone X (unshaded) · 0% chance over 30 yrs
- Wildfire 5/10 Major
- Heat 6/10 Major 7 d/yr ≥110°F today · 20 d/yr by 30 yrs out
- Wind 2/10 Low 3% chance of damaging wind over 30 yrs
- Air quality 2/10 Low 1 unhealthy d/yr today · 2 by 30 yrs out
Nearby sold comps map
Loading sold comps map…
Walkable amenities ~0.75 mi
Loading nearby amenities…
Taxation est. · year 1
- Rental income
- $13,200
- − Mortgage interest
- −$2,297
- − Property taxes
- −$173
- − Insurance
- −$205
- − Repairs & maintenance
- −$1,056
- − Management
- −$1,056
- − Depreciation
- −$1,193
- Taxable income
- $7,221
- Est. tax owed @ 24.0%
- −$1,733
- After-tax cash flow
- $5,737/yr
For passive investors: Depreciation is non-cash, so a rental often shows a tax loss while cash-flowing — sheltering income. Rental losses are passive: they offset passive income freely, and up to $25,000/yr can offset ordinary (W-2) income if you actively participate and your MAGI is under $100k (phasing out to $0 by $150k); unused losses carry forward. On sale, claimed depreciation is recaptured at up to 25%, and gains may owe capital-gains tax (a 1031 exchange can defer both). Figures are a year-1 estimate at your 24.0% rate — not tax advice; consult a CPA.
Schools (NCES district)
- District
- Vinita
- NCES district ID
- 4031290
- Math proficiency
- 24% ▼ -10.00%
- Reading proficiency
- 20% ▼ -7.00%
- Median HH income
- $37,171
- Composite
- 18.37/100
- National rank
- #8943
- State rank
- #156 of 270 in OK
Livability — Vinita
- Score
- 63/100
- State rank
- #227
- US rank
- #15843
Category grades
Schools grade is shown separately in the Schools card above.
Census & demographics
- Census place
- Vinita, OK
- Population (ZIP)
- 11,126
Population outlook (Craig County) Hauer SSP2
- Today (2025)
- 14,522 people
- By 2030
- 14,263 · -1.8%
- By 2040
- 13,814 · -4.9%
- By 2050
- 13,457 · -7.3%
- By 2075
- 13,123 · -9.6%
- By 2100
- 12,323 · -15.1%
Race, ethnicity, and origin ACS 2023
- Neighborhood character
- Diverse neighborhood (Simpson 0.64)
- Race & ethnicity
- White 60% Native American 20% Two or more races 12% Black 4% Hispanic / Latino 4% Asian 1%
- Common ancestry
- Slovak 2% Lithuanian 1% Italian 1%
- Foreign-born
- 2% · Canada, Vietnam
- Languages at home
- 96% English-only · Spanish 3% Other Asian/Pacific 1%
Political lean MEDSL · Craig
- 2024 margin
- Solid R (+58.3) · D 20.0% · R 78.3% · Other 1.7%
- 2008→2024 swing
- -28.2pp toward R · 2008: -30.1pp · 2024: -58.3pp
- All cycles
- 2024: R+58.3 2020: R+57.5 2016: R+52.4 2012: R+34.1 2008: R+30.1
Not yet ingested
- Civics
- —
Market trends
- HPI YoY
- ▲ 17.37%
- Current HPI
- 262.4336
- Rent YoY
- —
- Metro
- —
- State GDP YoY
- ▲ 1.55%
- F500 in state
- 6
Industry mix (Fortune 500 HQ in OK)
| Industry | F500 HQs | Revenue |
|---|---|---|
| Energy | 3 | $48B |
|
||
Price history
-18.0% since first listed5 events — show timeline
- 2026-05-23 Price Changed $41,000 MLS Technology, Inc.
- 2026-05-23 Price Changed $25,000 MLS Technology, Inc.
- 2026-04-21 Price Changed $41,000 MLS Technology, Inc.
- 2026-01-28 Price Changed $36,000 MLS Technology, Inc.
- 2026-01-24 Listed $50,000 MLS Technology, Inc.
Property tax history
-5.6%/yrLatest (2025): $173 · +6.1% YoY. Source: county tax records.
Cash-flow waterfall
monthlySold comps — $/sqft
last 12 mo · ≤1 miLoading sold comps…