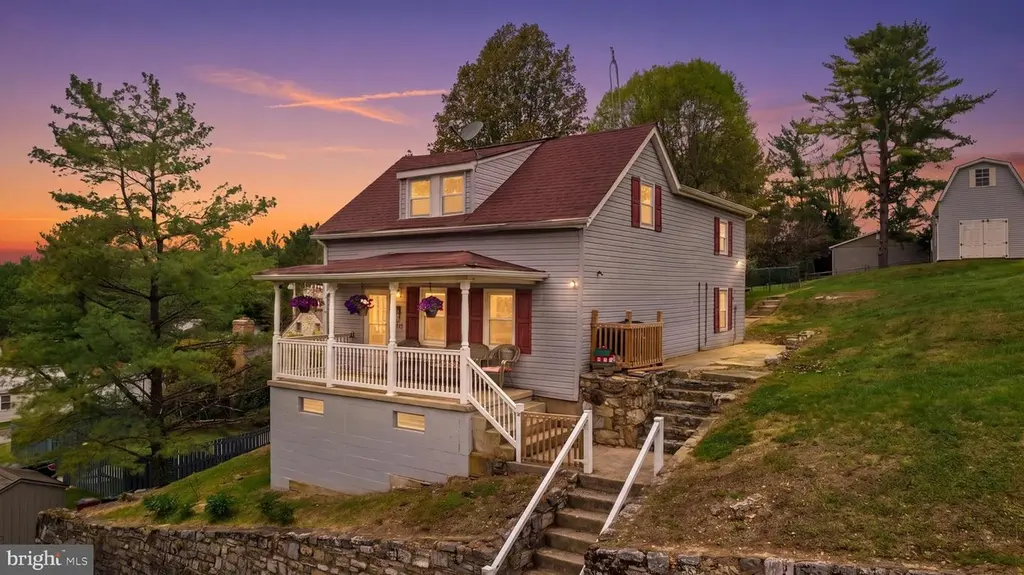
205 E Antietam St · Sharpsburg, MD
Flood risk 1/10 · Minimal
- FEMA flood zone
- X (unshaded)
- Chance of flooding over 30 yrs
- 0.0%
- Est. flood insurance / yr
- $473 – $860
Fire risk 3/10 · Minor
- Est. fire insurance / yr
- $755 – $1,403
Heat risk 5/10 · Moderate
- Hot days now (above 102°F)
- 7 days/yr
- Hot days in 30 yrs
- 16 days/yr
Wind risk 3/10 · Minor
- Chance of severe wind over 30 yrs
- 4.0%
Air-quality risk 2/10 · Minimal
- Unhealthy air days now
- 1 days/yr
- Unhealthy air days in 30 yrs
- 2 days/yr
Risk factors via First Street. Map © Google.
Why this score? — see what drove the C grade
The composite is a weighted blend of 9 inputs, each scored 0–100. Each bar is that input's sub-score; the figure is the points it added to the 100-point composite (weight × sub-score).
- Cash flow +19.7/30.0
- ARV discount +15.0/15.0
- DSCR +6.2/10.0
- 1% rule +4.1/10.0
- Livability +2.9/5.0
- Rent growth +2.5/5.0
- Condition / age +2.5/5.0
- Schools +2.3/10.0
- Appreciation +0.0/10.0
$225,000
🖨 Deal sheet 📄 Offer letter ✓ Due diligence
Listing remarks
Nestled in the heart of Sharpsburg, this charming home offers a unique opportunity to enjoy small-town living just steps from local shops and dining. Within walking distance to the historic Antietam National Battlefield, the location blends everyday convenience with rich history. The home features three bedrooms on the second level, including a pass-through layout between two rooms, and a full bath on the main level. While the interior remains ready for your personal touch, key updates have already been completed, including a roof replacement just two years ago, along with new gutters, downspouts, and an updated oil tank with hookup. PRICE ADJUSTMENT! We discovered the oil furnace has run
Key facts
- 0.38 acre lot
- Built 1906
- Listed 49 days
Property features AI
Finance
- Other: Fee simple ownership
Exterior
- Parking: Off-street parking; Alley access; On-street parking
- Utilities: Public water; Public sewer; Electric service
- Home design: Detached property; Above-grade finished area recorded by assessor
- Construction: Shingle roof; Permanent foundation; Above-grade and below-grade structures
- Exterior features: No tidal water
Interior
- Kitchen: Dishwasher; Stove
- Bedrooms: Three bedrooms on the first upper level
- Bathrooms: One full bathroom
- Heating & cooling: 90% forced air heating (oil); Central air conditioning (electric)
- Interior features: Partial basement; Finished living area measured by assessor
- Laundry & utility: Electric hot water
Neighborhood map
What this means for you Summary
Snapshot
- This is a 3-bed/1.0-bath single-family listed at $225k.
Deal economics
- At list price, monthly cash flow is $262 ($3k/yr) — positive.
- The deal already cash-flows at list — no discount required.
- To meet the 1% rule (rent ≥ 1% of price), the offer needs to be $204k (9.2% below list).
- Recommended offer: $204k (9.2% below list) — sets the bar for 1% rule.
Location & tenants
- Location reads 57/100 on livability (#395 in MD) — a working-class tenant base; expect higher turnover. Strengths: housing A+, cost of living A, employment B+; Watch: crime F, amenities F, commute F.
- Washingtion County Public Schools (suburban): math 18% / reading 33% proficiency, ranked #13 of 24 in MD (top 54%) — low school quality limits family demand, transient renter base, plan for 1-2y turnover.
- Zoned schools: Sharpsburg Elementary (math 27% / reading 27%, grade F, #225 of 860 statewide, top 27%, 349 students, 37% FRL); Boonsboro Middle (math 16% / reading 41%, grade F, #74 of 225 statewide, top 33%, 610 students, 36% FRL); Boonsboro High (math 52% / reading 67%, grade C+, #73 of 222 statewide, top 34%, 747 students, 36% FRL) — zoned schools at 36% FRL track the district average.
- Zoned-school proficiency averages 38% at this address vs 26% district-wide (+13 pts) — the actual schools serving this property are materially stronger than the Washingtion County Public Schools average implies; a family-tenant draw the district grade alone would hide.
- Market conditions: 25 active listings in the ZIP; 232 units permitted in Washington County in 2024 (12 in 5+ unit buildings).
Forward outlook
- Local home prices are declining (-3.0%/yr); year-one equity from $2k of loan paydown is wiped out by about $7k of value loss. Plan a longer hold.
Negotiation context
- It's been on market 49 days — a 3% lower offer ($218k) is reasonable based on typical stale-listing flexibility.
Risks & watch-outs
- Watch-outs: built in 1906 — expect roof / HVAC / electrical / plumbing capex.
- Climate carrying-cost: extreme-heat days projected 7→16/yr by 2055 (HVAC capex compounding) — expect insurance premiums to compound above CPI over the hold.
Questions for the listing agent
- It's been on market 49 days. Have you received any prior offers? Is the seller open to a 9% concession, seller financing, or rate buy-down credit?
- Built in 1906 — when were the roof, HVAC, electrical panel, plumbing, and water heater last replaced?
- Is there a deadline driving the sale (1031 exchange, divorce, estate, relocation)? That informs how much negotiation room exists.
- Schools are D-rated, which usually means shorter tenancies and higher turnover. Who's the typical renter profile here, and what's been the actual vacancy rate?
- Crime grade is F in this area — have there been break-ins, vandalism, or insurance claims at this property in the last 3 years? What carrier currently insures it and at what premium?
- What's the average days-on-market for RENTAL listings here right now (not sales)? A rising rental-DOM trend means longer vacancies and softer asking-rent achievability than the comps imply.
- What's the recent tenant-quality profile in this submarket — average credit score on applications, eviction rate, late-payment / NSF rate, and stable-employment percentage? A property-management company in the area should have these aggregated.
- How much new for-sale + rental construction is in the pipeline within 1–3 miles? Heavy new supply typically softens prices + rents 12–24 months out; constrained supply supports both.
Investment metrics
- 1% rule
- 0.91% ✗
- Cap rate
- 7.69%
- Cash-on-cash
- 4.99%
- DSCR
- 1.22
- GRM
- 9.2
CMA / ARV
- ARV (median comp)
- $301,970
- List price
- $225,000
- Delta
- -25.49%
- Verdict
- UNDERPRICED
- Comps
- 20 within 1.0 mi
Show comp detail 6 sales within ~0.75 mi
| Address | Dist | Beds/Ba | Sqft | Sold | Price | $/sf | Match |
|---|---|---|---|---|---|---|---|
| 208 E Antietam St | 0.04mi | 3/2.0 | 1,421 (-3%) | 21mo | $284,000 | $200 | 72 |
| 213 W High St | 0.39mi | 3/1.0 | 1,548 (+6%) | 9mo | $229,900 | $149 | 64 |
| 215 W High St | 0.41mi | 4/2.0 (+1) | 1,476 (+1%) | 16mo | $345,000 | $234 | 57 |
| 17717 Davidson Dr | 0.41mi | 3/2.0 | 1,561 (+7%) | 15mo | $416,965 | $267 | 53 |
| 222 W Main St | 0.43mi | 3/2.0 | 1,548 (+6%) | 18mo | $324,900 | $210 | 51 |
| 5019 General Branch Ct | 0.73mi | 3/2.0 | 1,680 (+15%) | 1mo | $389,999 | $232 | 36 |
Match score weights: distance 35% · size 25% · config 20% · recency 20%. Top-matched comps best support the ARV.
Projected returns pro-forma
-3.0% appreciation · 3.0% rent growth · sell at horizon
- IRR
- -8.6%
- Equity multiple
- 0.68×
- Total profit
- $-19,876
- Equity at exit
- $33,548
- IRR
- 0.9%
- Equity multiple
- 1.06×
- Total profit
- $3,788
- Equity at exit
- $19,454
Cash invested: $63,000 (down + closing). Projections, not guarantees.
Landlord ↔ Tenant lean methodology
- Overall (STATE)
- 27 Tenant-Leaning
- State Maryland
- 27 Tenant-Leaning · D+14
- County
- — inherits STATE
- City
- — inherits STATE
ZIP-level market 21782
- Home prices YoY
- -9.3%
- Active inventory
- 25
- Price-to-rent
- 9.2×
Monthly cashflow live
- Estimated rent
- $2,044 medium interval (Pro) →
- Mortgage (P&I)
- −$1,180
- Tax from tax record
- −$79 /mo · $952/yr
- Insurance
- −$94
- HOA
- −$0
- Vacancy / Maint / Mgmt
- −$429
- Net cashflow
- $262
Break-even live
UW: 25.0% down · 7.5% · 30yr · 1.5% tax · 5.0% vac · 8.0% maint · 8.0% mgmt
Financing live
Cash to close
- Down payment
- $56,250
- Closing costs
- $6,750
- Reserves months
- —
- Total cash needed
- —
Loan-product check · same deal, 3 products live
Conventional
25% down · 7.5% · 30yr
- Down + closing
- —
- Monthly P&I
- —
- Monthly cashflow
- —
- DSCR
- —
- Eligible?
- —
Personal DTI + credit; lowest rate.
DSCR
20% down · 8.5% · 30yr
- Down + closing
- —
- Monthly P&I
- —
- Monthly cashflow
- —
- DSCR
- —
- Eligible?
- —
No personal income docs; deal must DSCR.
Hard money
10% down · 12.0% · 12mo
- Down + closing
- —
- Monthly P&I
- —
- Monthly cashflow
- —
- DSCR
- —
- Eligible?
- —
Short-term bridge; refi at stabilization.
Listing history 18 events
-
2026-06-18days on market $225,000 Active 49 DOM
-
2026-06-17days on market $225,000 Active 48 DOM
-
2026-06-16days on market $225,000 Active 47 DOM
-
2026-06-15days on market $225,000 Active 46 DOM
-
2026-06-14days on market $225,000 Active 44 DOM
-
2026-06-13days on market $225,000 Active 43 DOM
-
2026-06-10days on market $225,000 Active 41 DOM
-
2026-06-09days on market $225,000 Active 40 DOM
-
2026-06-08days on market $225,000 Active 39 DOM
-
2026-06-07days on market $225,000 Active 38 DOM
-
2026-06-03days on market $225,000 Active 34 DOM
-
2026-06-02days on market $225,000 Active 33 DOM
-
2026-06-01days on market $225,000 Active 32 DOM
-
2026-05-31days on market $225,000 Active 31 DOM
-
2026-05-30remarks 699-char remark
-
2026-05-30pricedays on market $225,000 Active 30 DOM
-
2026-05-01$240,000 Active 641-char remark
-
2026-04-28historical $240,000 641-char remark
ⓘ Source: listings_history table (triggers on properties + properties_extension) + one-shot
backfill from property_details.listing_events for pre-trigger history.
Tax reassessment forecast MD · Partial reset (capped growth)
- Current annual tax
- $952 · $79/mo
- Projected year-2 tax
- $1,702 · $142/mo
- Expected delta
- +$750/yr (+$63/mo · 78.9%)
ⓘ Screening estimate from a state-policy table — verify with the county assessor before closing.
Climate risk First Street
- Flood 1/10 Low FEMA zone X (unshaded) · 0% chance over 30 yrs
- Wildfire 3/10 Moderate
- Heat 5/10 Major 7 d/yr ≥102°F today · 16 d/yr by 30 yrs out
- Wind 3/10 Moderate 4% chance of damaging wind over 30 yrs
- Air quality 2/10 Low 1 unhealthy d/yr today · 2 by 30 yrs out
Nearby sold comps map
Loading sold comps map…
Walkable amenities ~0.75 mi
Loading nearby amenities…
Taxation est. · year 1
- Rental income
- $24,529
- − Mortgage interest
- −$12,603
- − Property taxes
- −$952
- − Insurance
- −$1,125
- − Repairs & maintenance
- −$1,962
- − Management
- −$1,962
- − Depreciation
- −$6,545
- Taxable loss
- −$621
- Est. tax savings @ 24.0%
- +$149
- After-tax cash flow
- $3,291/yr
For passive investors: Depreciation is non-cash, so a rental often shows a tax loss while cash-flowing — sheltering income. Rental losses are passive: they offset passive income freely, and up to $25,000/yr can offset ordinary (W-2) income if you actively participate and your MAGI is under $100k (phasing out to $0 by $150k); unused losses carry forward. On sale, claimed depreciation is recaptured at up to 25%, and gains may owe capital-gains tax (a 1031 exchange can defer both). Figures are a year-1 estimate at your 24.0% rate — not tax advice; consult a CPA.
Schools (NCES district)
- District
- Washingtion County Public Schools
- NCES district ID
- 2400660
- Math proficiency
- 18% ▼ -20.00%
- Reading proficiency
- 33% ▼ -17.00%
- Median HH income
- $54,784
- Composite
- 22.87/100
- National rank
- #8007
- State rank
- #13 of 24 in MD
Livability — Sharpsburg
- Score
- 57/100
- State rank
- #395
- US rank
- #21662
Category grades
Schools grade is shown separately in the Schools card above.
Census & demographics
- Census place
- Sharpsburg, MD
- Population (ZIP)
- 4,056
Population outlook (Washington County) Hauer SSP2
- Today (2025)
- 151,614 people
- By 2030
- 151,455 · -0.1%
- By 2040
- 150,097 · -1.0%
- By 2050
- 148,193 · -2.3%
- By 2075
- 146,581 · -3.3%
- By 2100
- 138,025 · -9.0%
Race, ethnicity, and origin ACS 2023
- Neighborhood character
- Predominantly White (97%)
- Race & ethnicity
- White 97% Two or more races 2%
- Common ancestry
- Italian 7% Slovak 5% Serbian 1%
- Foreign-born
- 1% · Canada
- Languages at home
- 99% English-only · Spanish 1%
Political lean MEDSL · Washington
- 2024 margin
- Strong R (+23.0) · D 37.3% · R 60.4% · Other 2.3%
- 2008→2024 swing
- -10.2pp toward R · 2008: -12.9pp · 2024: -23.0pp
- All cycles
- 2024: R+23.0 2020: R+20.9 2016: R+32.4 2012: R+18.5 2008: R+12.9
Not yet ingested
- Civics
- —
Market trends
- HPI YoY
- ▼ -28.45%
- Current HPI
- 278.6603
- Rent YoY
- —
- Metro
- —
- State GDP YoY
- ▲ 2.97%
- F500 in state
- 12
Industry mix (Fortune 500 HQ in MD)
| Industry | F500 HQs | Revenue |
|---|---|---|
| Aerospace / Defense | 1 | $71B |
|
||
| Utilities | 1 | $25B |
|
||
| Hotels | 1 | $24B |
|
||
| Consumer Goods | 1 | $7B |
|
||
| Real Estate | 1 | $6B |
|
||
| Chemicals | 1 | $2B |
|
||
Price history
-6.2% since first listed3 events — show timeline
- 2026-05-30 Price Changed $225,000 BRIGHT MLS
- 2026-05-01 Listed $240,000 BRIGHT MLS
- 2026-04-28 Coming Soon $240,000 BRIGHT MLS
Property tax history
+0.5%/yrLatest (2025): $952 · +7.4% YoY. Source: county tax records.
Cash-flow waterfall
monthlySold comps — $/sqft
last 12 mo · ≤1 miLoading sold comps…