 🏗️ New Construction
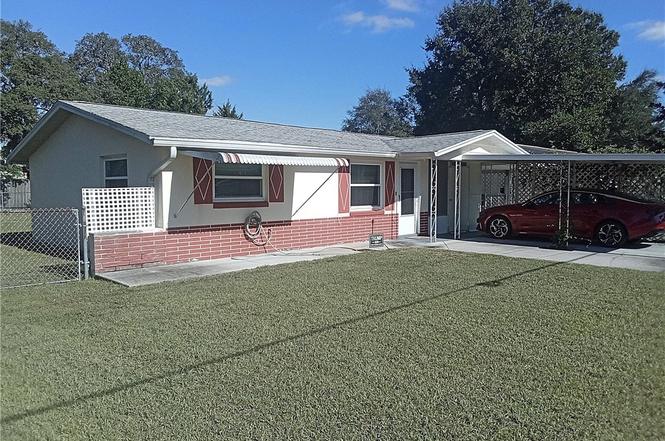
21 Regina Blvd · Beverly Hills, FL
Flood risk 1/10 · Minimal
- FEMA flood zone
- X (unshaded)
- Chance of flooding over 30 yrs
- 0.0%
- Est. flood insurance / yr
- $507 – $1,088
Fire risk 2/10 · Minimal
- Est. fire insurance / yr
- $947 – $1,759
Heat risk 9/10 · Severe
- Hot days now (above 108°F)
- 7 days/yr
- Hot days in 30 yrs
- 23 days/yr
Wind risk 9/10 · Severe
- Chance of severe wind over 30 yrs
- 99.0%
Air-quality risk 1/10 · Minimal
- Unhealthy air days now
- 0 days/yr
- Unhealthy air days in 30 yrs
- 0 days/yr
Risk factors via First Street. Map © Google.
Why this score? — see what drove the C grade
The composite is a weighted blend of 9 inputs, each scored 0–100. Each bar is that input's sub-score; the figure is the points it added to the 100-point composite (weight × sub-score).
- Cash flow +23.9/30.0
- DSCR +7.7/10.0
- ARV discount +7.5/15.0
- 1% rule +5.1/10.0
- Schools +4.1/10.0
- Livability +3.2/5.0
- Rent growth +2.5/5.0
- Condition / age +2.5/5.0
- Appreciation +0.0/10.0
$155,000
🖨 Deal sheet 📄 Offer letter ✓ Due diligence
Listing remarks MLS
Clean, cozy 1 Bedroom, 1 Bath with Living Room, Family Room, Glassed in Front Room, Utility Room, Tiled Floors throughout, Fresh Paint, Backyard Patio, Chain Fence & 2 Sheds. Some Furniture included. Affordable home or investment. Call to see before its gone.
Key facts
- 2 carports
- Thermal windows
- 2 storage sheds
Tags
Neighborhood map
What this means for you Summary
Snapshot
- This is a 1-bed/1.0-bath single-family listed at $155k.
Deal economics
- At list price, monthly cash flow is $234 ($3k/yr) — positive.
- The deal already cash-flows at list — no discount required.
- To meet the 1% rule (rent ≥ 1% of price), the offer needs to be $122k (21.5% below list).
- Recommended offer: $122k (21.5% below list) — sets the bar for 1% rule.
- Cap rate 8.6% vs local median 5.8% in Beverly Hills — top-decile yield for the area; either an underpriced asset or a hidden risk that comps aren't pricing in. Stress-test before assuming the spread holds.
Location & tenants
- Location reads 64/100 on livability (#666 in FL) — a middle-class / working-renter tenant base. Strengths: cost of living A+, housing A+, health & safety A+; Watch: amenities F, commute F, employment F.
- Citrus (rural): math 49% / reading 50% proficiency, ranked #44 of 73 in FL (top 60%) — families likely to look elsewhere, expect single-tenant / working-renter base with shorter leases.
- Zoned schools: Forest Ridge Elementary School (math 55% / reading 59%, grade C+, #781 of 2,144 statewide, top 38%, 708 students, 67% FRL); Lecanto Middle School (math 49% / reading 49%, grade C-, #265 of 571 statewide, top 48%, 809 students, 55% FRL); Lecanto High School (math 46% / reading 53%, grade D, #179 of 667 statewide, top 29%, 1,630 students, 46% FRL) — zoned schools at 56% FRL track the district average.
- Market conditions: 396 active listings in the ZIP; 1 comparable units currently listed for rent nearby; 2,443 units permitted in Citrus County in 2024 (0 in 5+ unit buildings).
Forward outlook
- Local home prices are declining (-3.0%/yr); year-one equity from $830 of loan paydown is wiped out by about $4k of value loss. Plan a longer hold.
- Citrus County population projected to shrink 10% by 2050 — rents likely to lag national; underwrite the cash flow, not the appreciation.
Negotiation context
- It's been on market 147 days — a 12% lower offer ($136k) is reasonable based on typical stale-listing flexibility.
- 2 sale attempts since 8y ago with the ask held roughly flat each time — persistent listings suggest the price (not the market) is what's stuck; bring a comps-based counter.
- Current owner paid $62k; list at $155k implies a 150% gain — meaningful room to come down on a strong offer.
Risks & watch-outs
- Climate carrying-cost: severe wind risk, 99% chance of damaging wind over 30y; extreme-heat days projected 7→23/yr by 2055 (HVAC capex compounding) — expect insurance premiums to compound above CPI over the hold.
Questions for the listing agent
- It's been on market 147 days. Have you received any prior offers? Is the seller open to a 21% concession, seller financing, or rate buy-down credit?
- Built in 1974 — when were the roof, HVAC, electrical panel, plumbing, and water heater last replaced?
- Why hasn't it sold? Are there any deal-killer items the seller is aware of (foundation, flood, title, zoning, code violations)?
- Is there a deadline driving the sale (1031 exchange, divorce, estate, relocation)? That informs how much negotiation room exists.
- Schools are F-rated, which usually means shorter tenancies and higher turnover. Who's the typical renter profile here, and what's been the actual vacancy rate?
- What's the average days-on-market for RENTAL listings here right now (not sales)? A rising rental-DOM trend means longer vacancies and softer asking-rent achievability than the comps imply.
- What's the recent tenant-quality profile in this submarket — average credit score on applications, eviction rate, late-payment / NSF rate, and stable-employment percentage? A property-management company in the area should have these aggregated.
- How much new for-sale + rental construction is in the pipeline within 1–3 miles? Heavy new supply typically softens prices + rents 12–24 months out; constrained supply supports both.
Investment metrics
- 1% rule
- 1.01% ✓
- Cap rate
- 8.63%
- Cash-on-cash
- 8.35%
- DSCR
- 1.37
- GRM
- 8.2
CMA / ARV
- ARV (on-the-fly)
- $120,150
- Comps found
- 5
Show comp detail 5 sales within ~0.75 mi
| Address | Dist | Beds/Ba | Sqft | Sold | Price | $/sf | Match |
|---|---|---|---|---|---|---|---|
| 1 Donna Ct | 0.12mi | 1/1.0 | 675 (0%) | 7mo | $118,500 | $176 | 88 |
| 14 James St | 0.17mi | 1/1.0 | 700 (+4%) | 2mo | $142,500 | $204 | 85 |
| 13 Oak Knoll St | 0.48mi | 1/1.0 | 675 (0%) | 5mo | $133,000 | $197 | 74 |
| 30 Plaza St | 0.40mi | 1/1.0 | 675 (0%) | 12mo | $120,000 | $178 | 72 |
| 9 Taft St | 0.43mi | 2/1.0 (+1) | 729 (+8%) | 16mo | $122,000 | $167 | 48 |
Match score weights: distance 35% · size 25% · config 20% · recency 20%. Top-matched comps best support the ARV.
Projected returns pro-forma
-3.0% appreciation · 3.0% rent growth · sell at horizon
- IRR
- -3.7%
- Equity multiple
- 0.86×
- Total profit
- $-4,610
- Equity at exit
- $17,915
- IRR
- 6.0%
- Equity multiple
- 1.45×
- Total profit
- $14,995
- Equity at exit
- $10,388
Cash invested: $33,642 (down + closing). Projections, not guarantees.
Landlord ↔ Tenant lean methodology
- Overall (STATE)
- 87 Strongly Landlord-Friendly
- State Florida
- 87 Strongly Landlord-Friendly · R+3
- County
- — inherits STATE
- City
- — inherits STATE
ZIP-level market 34465
- Home prices YoY
- -33.1%
- Active inventory
- 396
- Price-to-rent
- 10.6×
Monthly cashflow live
- Estimated rent
- $1,217 medium interval (Pro) →
- Mortgage (P&I)
- −$630
- Tax from tax record
- −$48 /mo · $572/yr
- Insurance
- −$50
- HOA
- −$0
- Vacancy / Maint / Mgmt
- −$256
- Net cashflow
- $234
Break-even live
UW: 25.0% down · 7.5% · 30yr · 1.5% tax · 5.0% vac · 8.0% maint · 8.0% mgmt
Financing live
Cash to close
- Down payment
- $30,038
- Closing costs
- $3,604
- Reserves months
- —
- Total cash needed
- —
Loan-product check · same deal, 3 products live
Conventional
25% down · 7.5% · 30yr
- Down + closing
- —
- Monthly P&I
- —
- Monthly cashflow
- —
- DSCR
- —
- Eligible?
- —
Personal DTI + credit; lowest rate.
DSCR
20% down · 8.5% · 30yr
- Down + closing
- —
- Monthly P&I
- —
- Monthly cashflow
- —
- DSCR
- —
- Eligible?
- —
No personal income docs; deal must DSCR.
Hard money
10% down · 12.0% · 12mo
- Down + closing
- —
- Monthly P&I
- —
- Monthly cashflow
- —
- DSCR
- —
- Eligible?
- —
Short-term bridge; refi at stabilization.
Rent comps 1 comps
| Address | Beds | Baths | Sqft | Rent | $/sqft | DOM | Units | Dist |
|---|---|---|---|---|---|---|---|---|
| 7 Donna Ct Beverly Hills, FL | 1.0 | 1.0 | 675 | $1,225 | $1.81 | 21d | 1 | 0.17mi |
Listing history 9 events
-
2026-04-02status Pending
-
2025-11-05$155,000 Active
-
2018-06-22soldstatus $62,000
-
2018-06-15soldstatus $62,000 265-char remark
Show marketing remark (265 chars)
Clean, cozy 1 Bedroom, 1 Bath with Living Room, Family Room, Glassed in Front Room, Utility Room, Tiled Floors throughout, Fresh Paint, Backyard Patio, Chain Fence & 2 Sheds. Some Furniture included. Affordable home or investment. Call to see before its gone.
-
2018-04-18$64,900 265-char remark
Show marketing remark (265 chars)
Clean, cozy 1 Bedroom, 1 Bath with Living Room, Family Room, Glassed in Front Room, Utility Room, Tiled Floors throughout, Fresh Paint, Backyard Patio, Chain Fence & 2 Sheds. Some Furniture included. Affordable home or investment. Call to see before its gone.
-
1990-10-01soldstatus $28,000
-
1986-06-01soldstatus $33,000
-
1984-07-01soldstatus $14,150
-
1983-09-01soldstatus $27,400
ⓘ Source: listings_history table (triggers on properties + properties_extension) + one-shot
backfill from property_details.listing_events for pre-trigger history.
Tax reassessment forecast FL · Resets to sale price
- Current annual tax
- $572 · $48/mo
- Projected year-2 tax
- $1,286 · $107/mo
- Expected delta
- +$715/yr (+$60/mo · 124.9%)
ⓘ Screening estimate from a state-policy table — verify with the county assessor before closing.
Climate risk First Street
- Flood 1/10 Low FEMA zone X (unshaded) · 0% chance over 30 yrs
- Wildfire 2/10 Low
- Heat 9/10 Extreme 7 d/yr ≥108°F today · 23 d/yr by 30 yrs out
- Wind 9/10 Extreme 99% chance of damaging wind over 30 yrs
- Air quality 1/10 Low 0 unhealthy d/yr today · 0 by 30 yrs out
Nearby sold comps map
Loading sold comps map…
Walkable amenities ~0.75 mi
Loading nearby amenities…
Taxation est. · year 1
- Rental income
- $14,610
- − Mortgage interest
- −$6,730
- − Property taxes
- −$572
- − Insurance
- −$601
- − Repairs & maintenance
- −$1,169
- − Management
- −$1,169
- − Depreciation
- −$3,495
- Taxable income
- $874
- Est. tax owed @ 24.0%
- −$210
- After-tax cash flow
- $2,598/yr
For passive investors: Depreciation is non-cash, so a rental often shows a tax loss while cash-flowing — sheltering income. Rental losses are passive: they offset passive income freely, and up to $25,000/yr can offset ordinary (W-2) income if you actively participate and your MAGI is under $100k (phasing out to $0 by $150k); unused losses carry forward. On sale, claimed depreciation is recaptured at up to 25%, and gains may owe capital-gains tax (a 1031 exchange can defer both). Figures are a year-1 estimate at your 24.0% rate — not tax advice; consult a CPA.
Schools (NCES district)
- District
- Citrus
- NCES district ID
- 1200270
- Math proficiency
- 49% ▼ -10.00%
- Reading proficiency
- 50% ▼ -6.00%
- Median HH income
- $38,618
- Composite
- 41.28/100
- National rank
- #3519
- State rank
- #44 of 73 in FL
Livability — Beverly Hills
- Score
- 64/100
- State rank
- #666
- US rank
- #13671
Category grades
Schools grade is shown separately in the Schools card above.
Census & demographics
- Census place
- Beverly Hills, FL
- County
- Citrus County · 111,314 people
- City population
- 18,879
- Metro
- Homosassa Springs, FL
- Population (ZIP)
- 18,879
- Household income
- $54,869
- Rent vs Own
- Severe rent burden
- 334.0
Population outlook (Citrus County) Hauer SSP2
- Today (2025)
- 138,622 people
- By 2030
- 136,886 · -1.3%
- By 2040
- 132,009 · -4.8%
- By 2050
- 125,196 · -9.7%
- By 2075
- 108,570 · -21.7%
- By 2100
- 84,454 · -39.1%
Race, ethnicity, and origin ACS 2023
- Neighborhood character
- Predominantly White (82%)
- Race & ethnicity
- White 82% Hispanic / Latino 8% Black 4% Two or more races 3% Asian 2%
- Hispanic origin (detail)
- Mexican 1% Puerto Rican 3%
- Common ancestry
- Romanian 4% Lithuanian 3% Slovak 2%
- Foreign-born
- 8% · Canada, Vietnam, Dominican Republic
- Languages at home
- 93% English-only · Spanish 4% French/Haitian/Cajun 1% Other Asian/Pacific 1%
Political lean MEDSL · Citrus
- 2024 margin
- Solid R (+45.9) · D 26.8% · R 72.6%
- 2008→2024 swing
- -29.8pp toward R · 2008: -16.1pp · 2024: -45.9pp
- All cycles
- 2024: R+45.9 2020: R+41.0 2016: R+39.7 2012: R+21.9 2008: R+16.1
Not yet ingested
- Civics
- —
Market trends
- HPI YoY
- ▼ -138.62%
- Current HPI
- 279.7183
- Rent YoY
- —
- Metro
- Homosassa Springs, FL
- State GDP YoY
- ▲ 3.28%
- F500 in state
- 36
Industry mix (Fortune 500 HQ in FL)
| Industry | F500 HQs | Revenue |
|---|---|---|
| Industrial Technology | 2 | $29B |
|
||
| Insurance | 2 | $17B |
|
||
| Retail | 1 | $60B |
|
||
| Technology Distribution | 1 | $58B |
|
||
| Homebuilding | 1 | $35B |
|
||
| Technology Manufacturing | 1 | $35B |
|
||
Price history
+465.7% since first listed9 events — show timeline
- 2026-04-02 Pending — RACC
- 2025-11-05 Listed $155,000 RACC
- 2018-06-22 Sold (Public Records) $62,000 Public Records
- 2018-06-15 Sold (MLS) $62,000 RACC
- 2018-04-18 Listed $64,900 RACC
- 1990-10-01 Sold (Public Records) $28,000 Public Records
- 1986-06-01 Sold (Public Records) $33,000 Public Records
- 1984-07-01 Sold (Public Records) $14,150 Public Records
- 1983-09-01 Sold (Public Records) $27,400 Public Records
Property tax history
+18.7%/yrLatest (2025): $572 · +11.5% YoY. Source: county tax records.
Cash-flow waterfall
monthlySold comps — $/sqft
last 12 mo · ≤1 miLoading sold comps…