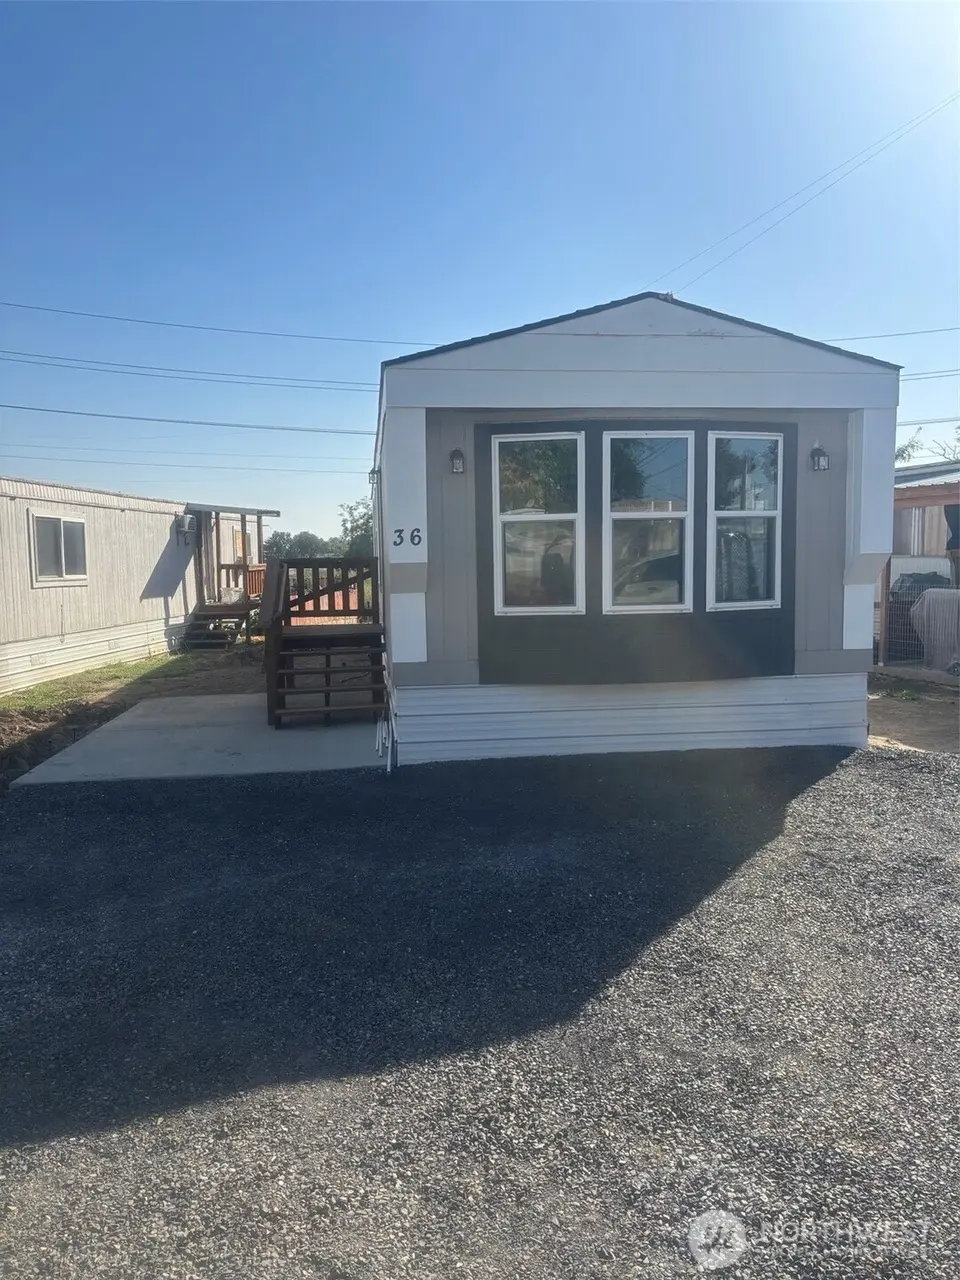
1331 W Pine #36 · Walla Walla, WA
Flood risk 1/10 · Minimal
- FEMA flood zone
- X
- Chance of flooding over 30 yrs
- 0.0%
- Est. flood insurance / yr
- $507 – $1,088
Fire risk 3/10 · Minor
- Est. fire insurance / yr
- $604 – $1,122
Heat risk 4/10 · Minor
- Hot days now (above 98°F)
- 7 days/yr
- Hot days in 30 yrs
- 15 days/yr
Wind risk 1/10 · Minimal
- Chance of severe wind over 30 yrs
- —
Air-quality risk 8/10 · Major
- Unhealthy air days now
- 11 days/yr
- Unhealthy air days in 30 yrs
- 14 days/yr
Risk factors via First Street. Map © Google.
Why this score? — see what drove the C+ grade
The composite is a weighted blend of 9 inputs, each scored 0–100. Each bar is that input's sub-score; the figure is the points it added to the 100-point composite (weight × sub-score).
- Cash flow +30.0/30.0
- 1% rule +10.0/10.0
- DSCR +10.0/10.0
- Schools +4.1/10.0
- Livability +4.0/5.0
- Rent growth +3.1/5.0
- Condition / age +2.5/5.0
- ARV discount +0.0/15.0
- Appreciation +0.0/10.0
$59,900
🖨 Deal sheet 📄 Offer letter ✓ Due diligence
Listing remarks
Discover this beautifully refreshed 1993 Mobile home featuring 2-bedroom, 1 full bath and a long list of recent upgrades! Step inside to a bright and welcoming interior with brand new paint throughout, new flooring and a clean, modern feel. Enjoy peace of mind with a newer roof and enhanced curb appeal thanks to a fresh coat of exterior paint. The open floor plan offers a comfortable living area, efficient kitchen and great natural light -perfect for first time home buyers or downsizers. This home combines affordability with stylish updates and is ready for its next own. Don't miss tour chance to own this move in ready gem - Schedule your showing today! Lot rent is $650 for the first 10 mon
Key facts
- Open floor plan
- Great natural light
- Newer roof
Tags
Neighborhood map
What this means for you Summary
Snapshot
- This is a 2-bed/1.0-bath land listed at $60k.
Deal economics
- At list price, monthly cash flow is $745 ($9k/yr) — positive.
- The deal already cash-flows at list — no discount required.
- Meets the 1% rule at list price ($1k rent vs $60k).
- Recommended offer: $53k (12.0% below list) — sets the bar for market timing.
- Cap rate 21.2% vs local median 2.3% in Walla Walla — top-decile yield for the area; either an underpriced asset or a hidden risk that comps aren't pricing in. Stress-test before assuming the spread holds.
Location & tenants
- Location reads 79/100 on livability (#105 in WA, #2,015 nationally) — a middle-class / working-renter tenant base. Strengths: amenities A+, commute A+, housing A+; Watch: schools C-.
- Walla Walla Public Schools (urban): math 41% / reading 50% proficiency, ranked #179 of 291 in WA (top 62%) — families likely to look elsewhere, expect single-tenant / working-renter base with shorter leases.
- Market conditions: Rents rising (+2.4%/yr); 422 active listings in the ZIP; 11 comparable units currently listed for rent nearby; rentals lingering (median 44d on market — plan ~5-8 weeks vacancy on turnover, expect pricing pressure); 82% of comp listings sitting > 30 days — soft ceiling on asking rent; 206 units permitted in Walla Walla County in 2024 (50 in 5+ unit buildings).
Forward outlook
- Local home prices are declining (-3.0%/yr); year-one equity from $414 of loan paydown is wiped out by about $2k of value loss. Plan a longer hold.
- Walla Walla County population projected at +8% by 2050 — modest demand growth; plan on rents tracking national, not racing it.
- At projected returns (-3.0% appreciation + 2.4% rent growth), your $17k cash investment doubles in ~3 years — after that, you're playing with house money.
Negotiation context
- It's been on market 262 days — a 12% lower offer ($53k) is reasonable based on typical stale-listing flexibility.
- 2 sale attempts; this cycle's ask has dropped $12k (17%) from the opening price — seller is motivated, your offer sets the floor, not the list.
Questions for the listing agent
- It's been on market 262 days. Have you received any prior offers? Is the seller open to a 12% concession, seller financing, or rate buy-down credit?
- Why hasn't it sold? Are there any deal-killer items the seller is aware of (foundation, flood, title, zoning, code violations)?
- Is there a deadline driving the sale (1031 exchange, divorce, estate, relocation)? That informs how much negotiation room exists.
- What's the average days-on-market for RENTAL listings here right now (not sales)? A rising rental-DOM trend means longer vacancies and softer asking-rent achievability than the comps imply.
- What's the recent tenant-quality profile in this submarket — average credit score on applications, eviction rate, late-payment / NSF rate, and stable-employment percentage? A property-management company in the area should have these aggregated.
- How much new for-sale + rental construction is in the pipeline within 1–3 miles? Heavy new supply typically softens prices + rents 12–24 months out; constrained supply supports both.
Investment metrics
- 1% rule
- 2.45% ✓
- Cap rate
- 21.21%
- Cash-on-cash
- 53.28%
- DSCR
- 3.37
- GRM
- 3.4
CMA / ARV
- ARV (median comp)
- $45,083
- List price
- $59,900
- Delta
- 32.87%
- Verdict
- OVERPRICED
- Comps
- 9 within 2.0 mi
Projected returns pro-forma
-3.0% appreciation · 2.4% rent growth · sell at horizon
- IRR
- 50.7%
- Equity multiple
- 3.20×
- Total profit
- $36,867
- Equity at exit
- $8,931
- IRR
- 55.9%
- Equity multiple
- 6.35×
- Total profit
- $89,700
- Equity at exit
- $5,179
Cash invested: $16,772 (down + closing). Projections, not guarantees.
Landlord ↔ Tenant lean methodology
- Overall (STATE)
- 28 Tenant-Leaning
- State Washington
- 28 Tenant-Leaning · D+8
- County
- — inherits STATE
- City
- — inherits STATE
ZIP-level market 99362
- Rents YoY
- 2.4%
- Active inventory
- 422
- Price-to-rent
- 3.4×
Monthly cashflow live
- Estimated rent
- $1,467 high interval (Pro) →
- Mortgage (P&I)
- −$314
- Tax est. 1.5%
- −$75 /mo · $898/yr
- Insurance
- −$25
- HOA
- −$0
- Vacancy / Maint / Mgmt
- −$308
- Net cashflow
- $745
Break-even live
UW: 25.0% down · 7.5% · 30yr · 1.5% tax · 5.0% vac · 8.0% maint · 8.0% mgmt
Financing live
Cash to close
- Down payment
- $14,975
- Closing costs
- $1,797
- Reserves months
- —
- Total cash needed
- —
Loan-product check · same deal, 3 products live
Conventional
25% down · 7.5% · 30yr
- Down + closing
- —
- Monthly P&I
- —
- Monthly cashflow
- —
- DSCR
- —
- Eligible?
- —
Personal DTI + credit; lowest rate.
DSCR
20% down · 8.5% · 30yr
- Down + closing
- —
- Monthly P&I
- —
- Monthly cashflow
- —
- DSCR
- —
- Eligible?
- —
No personal income docs; deal must DSCR.
Hard money
10% down · 12.0% · 12mo
- Down + closing
- —
- Monthly P&I
- —
- Monthly cashflow
- —
- DSCR
- —
- Eligible?
- —
Short-term bridge; refi at stabilization.
Rent comps 11 comps
| Address | Beds | Baths | Sqft | Rent | $/sqft | DOM | Units | Dist |
|---|---|---|---|---|---|---|---|---|
| 101 Kenwood St #205 Walla Walla, WA | 2.0 | 1.0 | 845 | $1,325 | $1.57 | 44d | 1 | 0.80mi |
| 942 NE Spitzenburg St Apt B104 College Place, WA | 2.0 | 1.5 | 975 | $1,530 | $1.57 | 44d | 1 | 1.15mi |
| 330 S 4th Ave Unit 1 Walla Walla, WA | 1.0 | 1.0 | 550 | $900 | $1.64 | 44d | 1 | 1.20mi |
| 105 N Spokane St Unit 201 Walla Walla, WA | 2.0 | 1.0 | 750 | $1,250 | $1.67 | 44d | 1 | 1.20mi |
| 427 E Pine St Unit 427 Walla Walla, WA | 2.0 | 1.0 | 752 | $1,225 | $1.63 | 14d | 1 | 1.21mi |
| 332 S 3rd Ave Walla Walla, WA | 2.0 | 1.0 | 1084 | $1,630 | $1.50 | 44d | 1 | 1.25mi |
| 524 E Pine St Unit A Walla Walla, WA | 2.0 | 1.0 | 864 | $1,495 | $1.73 | 21d | 1 | 1.27mi |
| 427 E Cherry St Walla Walla, WA | 2.0 | 1.0 | 1002 | $1,795 | $1.79 | 44d | 1 | 1.28mi |
| 327 E Rose St Walla Walla, WA | 1.0–2.0 | 1.0–2.0 | 863 | $2,421 | $2.80 | 44d | 8 | 1.29mi |
| 104 S Palouse St Walla Walla, WA | 1.0 | 1.0 | 800 | $1,100 | $1.38 | 44d | 1 | 1.42mi |
| 255 Elder Pl #3 College Place, WA | 2.0 | 1.0 | 889 | $1,415 | $1.59 | 44d | 1 | 1.44mi |
Listing history 19 events
-
2026-06-19days on market $59,900 Active 262 DOM
-
2026-06-18days on market $59,900 Active 261 DOM
-
2026-06-17days on market $59,900 Active 260 DOM
-
2026-06-16days on market $59,900 Active 259 DOM
-
2026-06-15days on market $59,900 Active 258 DOM
-
2026-06-14days on market $59,900 Active 256 DOM
-
2026-06-12days on market $59,900 Active 255 DOM
-
2026-06-09days on market $59,900 Active 252 DOM
-
2026-06-08days on market $59,900 Active 251 DOM
-
2026-06-07days on market $59,900 Active 250 DOM
-
2026-06-02days on market $59,900 Active 245 DOM
-
2026-06-01days on market $59,900 Active 244 DOM
-
2026-05-31days on market $59,900 Active 243 DOM
-
2026-05-30days on market $59,900 Active 242 DOM
-
2026-05-05status Active
-
2026-05-01historical
-
2026-03-05price $59,900
-
2025-10-11price $69,900
-
2025-09-26$72,000 Active
ⓘ Source: listings_history table (triggers on properties + properties_extension) + one-shot
backfill from property_details.listing_events for pre-trigger history.
Climate risk First Street
- Flood 1/10 Low FEMA zone X · 0% chance over 30 yrs
- Wildfire 3/10 Moderate
- Heat 4/10 Moderate 7 d/yr ≥98°F today · 15 d/yr by 30 yrs out
- Wind 1/10 Low
- Air quality 8/10 Severe 11 unhealthy d/yr today · 14 by 30 yrs out
Nearby sold comps map
Loading sold comps map…
Walkable amenities ~0.75 mi
Loading nearby amenities…
Taxation est. · year 1
- Rental income
- $17,600
- − Mortgage interest
- −$3,355
- − Property taxes
- −$898
- − Insurance
- −$300
- − Repairs & maintenance
- −$1,408
- − Management
- −$1,408
- − Depreciation
- −$1,743
- Taxable income
- $8,488
- Est. tax owed @ 24.0%
- −$2,037
- After-tax cash flow
- $6,899/yr
For passive investors: Depreciation is non-cash, so a rental often shows a tax loss while cash-flowing — sheltering income. Rental losses are passive: they offset passive income freely, and up to $25,000/yr can offset ordinary (W-2) income if you actively participate and your MAGI is under $100k (phasing out to $0 by $150k); unused losses carry forward. On sale, claimed depreciation is recaptured at up to 25%, and gains may owe capital-gains tax (a 1031 exchange can defer both). Figures are a year-1 estimate at your 24.0% rate — not tax advice; consult a CPA.
Schools (NCES district)
- District
- Walla Walla Public Schools
- NCES district ID
- 5309450
- Math proficiency
- 41% ▲ 3.00%
- Reading proficiency
- 50% ▼ -1.00%
- Median HH income
- $46,207
- Composite
- 40.88/100
- National rank
- #7531
- State rank
- #179 of 291 in WA
Livability — Walla Walla
- Score
- 79/100
- State rank
- #105
- US rank
- #2015
Category grades
Schools grade is shown separately in the Schools card above.
Census & demographics
- Census place
- Walla Walla, WA
- County
- Walla Walla County · 52,990 people
- City population
- 42,853
- Metro
- Walla Walla, WA
- Population (ZIP)
- 42,853
- Household income
- $72,474
- Rent vs Own
- Severe rent burden
- 1238.0
Population outlook (Walla Walla County) Hauer SSP2
- Today (2025)
- 63,088 people
- By 2030
- 64,417 · +2.1%
- By 2040
- 66,563 · +5.5%
- By 2050
- 68,337 · +8.3%
- By 2075
- 73,235 · +16.1%
- By 2100
- 74,878 · +18.7%
Race, ethnicity, and origin ACS 2023
- Neighborhood character
- Predominantly White (69%)
- Race & ethnicity
- White 69% Hispanic / Latino 22% Two or more races 9% Black 2% Asian 2% Native American 2%
- Hispanic origin (detail)
- Mexican 17%
- Common ancestry
- Slovak 3% Portuguese 3% Lithuanian 3%
- Foreign-born
- 9% · Canada, China
- Languages at home
- 83% English-only · Spanish 15% Chinese 1%
Political lean MEDSL · Walla Walla
- 2024 margin
- Lean R (+8.1) · D 44.6% · R 52.7% · Other 2.7%
- 2008→2024 swing
- +8.5pp toward D · 2008: -16.6pp · 2024: -8.1pp
- All cycles
- 2024: R+8.1 2020: R+8.7 2016: R+16.4 2012: R+22.3 2008: R+16.6
Not yet ingested
- Civics
- —
Market trends
- HPI YoY
- ▼ -488.03%
- Current HPI
- 321.6891
- Rent YoY
- ▲ 2.40%
- Metro
- Walla Walla, WA
- State GDP YoY
- ▲ 4.65%
- F500 in state
- 22
Industry mix (Fortune 500 HQ in WA)
| Industry | F500 HQs | Revenue |
|---|---|---|
| Retail | 2 | $269B |
|
||
| Technology / Retail | 1 | $638B |
|
||
| Technology | 1 | $245B |
|
||
| Telecommunications | 1 | $38B |
|
||
| Food / Beverage | 1 | $36B |
|
||
| Automotive / Trucks | 1 | $34B |
|
||
Price history
-16.8% since first listed5 events — show timeline
- 2026-05-05 Relisted — NWMLS as Distributed by MLS Grid
- 2026-05-01 Delisted — NWMLS as Distributed by MLS Grid
- 2026-03-05 Price Changed $59,900 NWMLS as Distributed by MLS Grid
- 2025-10-11 Price Changed $69,900 NWMLS as Distributed by MLS Grid
- 2025-09-26 Listed $72,000 NWMLS as Distributed by MLS Grid
Cash-flow waterfall
monthlySold comps — $/sqft
last 12 mo · ≤1 miLoading sold comps…