 🏗️ New Construction
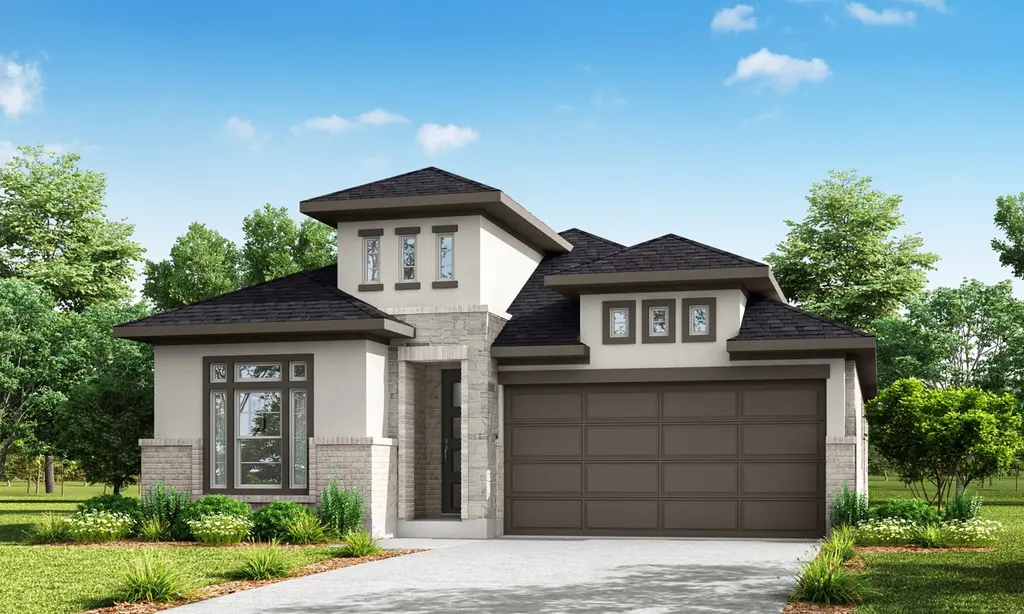
Rockwall Plan · Sienna, TX
Flood risk 1/10 · Minimal
- FEMA flood zone
- X
- Chance of flooding over 30 yrs
- 0.0%
- Est. flood insurance / yr
- $507 – $1,088
Fire risk 4/10 · Minor
- Est. fire insurance / yr
- $1,222 – $2,270
Heat risk 9/10 · Severe
- Hot days now (above 111°F)
- 7 days/yr
- Hot days in 30 yrs
- 24 days/yr
Wind risk 9/10 · Severe
- Chance of severe wind over 30 yrs
- 99.0%
Air-quality risk 2/10 · Minimal
- Unhealthy air days now
- 2 days/yr
- Unhealthy air days in 30 yrs
- 2 days/yr
Risk factors via First Street. Map © Google.
Why this score? — see what drove the C+ grade
The composite is a weighted blend of 9 inputs, each scored 0–100. Each bar is that input's sub-score; the figure is the points it added to the 100-point composite (weight × sub-score).
- Cash flow +24.8/30.0
- DSCR +8.0/10.0
- ARV discount +7.5/15.0
- 1% rule +6.4/10.0
- Schools +4.5/10.0
- Appreciation +4.2/10.0
- Condition / age +4.0/5.0
- Rent growth +2.5/5.0
- Livability +2.5/5.0
$425,990
🖨 Deal sheet 📄 Offer letter ✓ Due diligence
Listing remarks MLS
The Rockwall floor plan in the Portrait Series features 2,300 sqft, 4 bedrooms, 3 bathrooms, and a 2-car garage. This one-story floor plan offers study options, covered patio option, enlarged main shower option, 4 and 5 bedroom options, and 3rd bay options.
Key facts
- Garage
- Listed 160 days
Neighborhood map
What this means for you Summary
Snapshot
- This is a 4-bed/3.0-bath single-family listed at $426k. Condition is rated good.
Deal economics
- At list price, monthly cash flow is $923 ($11k/yr) — positive.
- The deal already cash-flows at list — no discount required.
- Meets the 1% rule at list price ($5k rent vs $426k).
- Recommended offer: $375k (12.0% below list) — sets the bar for market timing.
- Cap rate 8.8% vs local median 3.3% in Sienna — top-decile yield for the area; either an underpriced asset or a hidden risk that comps aren't pricing in. Stress-test before assuming the spread holds.
Location & tenants
- Location reads: area grade C — affects rentability + tenant quality, not the cash-flow math above.
- Fort Bend ISD (suburban): math 44% / reading 53% proficiency, ranked #140 of 826 in TX (top 17%) — families likely to look elsewhere, expect single-tenant / working-renter base with shorter leases.
- Market conditions: Rents soft (-0.1%/yr); 1215 active listings in the ZIP; 4 comparable units currently listed for rent nearby; rentals at typical pace (median 22d on market — plan ~3-4 weeks tenant-placement turnaround); high-income renter base; 12,093 units permitted in Fort Bend County in 2024 (815 in 5+ unit buildings).
- At $5,009/mo this rent would consume 47% of the median local household income ($129k/yr) (locally 1004% of renters already pay >50% of income on rent) — very limited rent-growth headroom before tenants either downsize or default.
Forward outlook
- Local home prices are declining (-1.7%/yr); year-one equity from $3k of loan paydown is wiped out by about $7k of value loss. Plan a longer hold.
- Fort Bend County population projected at +75% by 2050 — long-run rental-demand tailwind backs the buy-and-hold thesis.
Negotiation context
- It's been on market 161 days — a 12% lower offer ($375k) is reasonable based on typical stale-listing flexibility.
Risks & watch-outs
- Climate carrying-cost: severe wind risk, 99% chance of damaging wind over 30y; extreme-heat days projected 7→24/yr by 2055 (HVAC capex compounding) — expect insurance premiums to compound above CPI over the hold.
Questions for the listing agent
- It's been on market 161 days. Have you received any prior offers? Is the seller open to a 12% concession, seller financing, or rate buy-down credit?
- Why hasn't it sold? Are there any deal-killer items the seller is aware of (foundation, flood, title, zoning, code violations)?
- Is there a deadline driving the sale (1031 exchange, divorce, estate, relocation)? That informs how much negotiation room exists.
- What's the average days-on-market for RENTAL listings here right now (not sales)? A rising rental-DOM trend means longer vacancies and softer asking-rent achievability than the comps imply.
- What's the recent tenant-quality profile in this submarket — average credit score on applications, eviction rate, late-payment / NSF rate, and stable-employment percentage? A property-management company in the area should have these aggregated.
- How much new for-sale + rental construction is in the pipeline within 1–3 miles? Heavy new supply typically softens prices + rents 12–24 months out; constrained supply supports both.
Investment metrics
- 1% rule
- 1.14% ✓
- Cap rate
- 8.81%
- Cash-on-cash
- 9.01%
- DSCR
- 1.40
- GRM
- 7.3
CMA / ARV
- ARV (median comp)
- $439,070
- List price
- $425,990
- Delta
- -2.98%
- Verdict
- FAIR
- Comps
- 20 within 1.0 mi
Show comp detail 12 sales within ~0.75 mi
| Address | Dist | Beds/Ba | Sqft | Sold | Price | $/sf | Match |
|---|---|---|---|---|---|---|---|
| 8723 Arbor Trail Dr | 0.28mi | 4/3.0 | 2,381 (+4%) | 3mo | $365,000 | $153 | 79 |
| 1610 Country Air Ln | 0.45mi | 4/3.0 | 2,388 (+4%) | 0mo | $369,900 | $155 | 72 |
| 8715 Fox Trail Dr | 0.17mi | 4/2.5 | 2,152 (-6%) | 9mo | $349,999 | $163 | 72 |
| 2119 Long Spring Dr | 0.12mi | 4/3.0 | 2,522 (+10%) | 8mo | $410,989 | $163 | 72 |
| 1743 Country Air Ln | 0.34mi | 3/2.5 (-1) | 2,290 (-0%) | 6mo | $385,000 | $168 | 72 |
| 8715 Crossing Oak Ln | 0.11mi | 3/3.0 (-1) | 2,136 (-7%) | 9mo | $405,000 | $190 | 71 |
| 8726 Windsong Trail Dr | 0.23mi | 4/3.0 | 2,517 (+9%) | 5mo | $359,900 | $143 | 70 |
| 8711 Fairbrook Dr | 0.40mi | 4/3.5 | 2,413 (+5%) | 6mo | $409,900 | $170 | 66 |
| 1919 Waters Branch Dr | 0.21mi | 4/3.0 | 2,591 (+13%) | 7mo | $439,990 | $170 | 63 |
| 1518 Country Air Ln | 0.49mi | 4/3.0 | 2,388 (+4%) | 10mo | $405,000 | $170 | 63 |
| 8703 Red Heron Ln | 0.19mi | 3/3.5 (-1) | 2,615 (+14%) | 8mo | $459,000 | $176 | 55 |
| 2023 Green Haven Ct | 0.58mi | 4/3.0 | 2,623 (+14%) | 8mo | $450,000 | $172 | 43 |
Match score weights: distance 35% · size 25% · config 20% · recency 20%. Top-matched comps best support the ARV.
Projected returns pro-forma
-1.67% appreciation · 0.0% rent growth · sell at horizon
- IRR
- -0.4%
- Equity multiple
- 0.98×
- Total profit
- $-1,959
- Equity at exit
- $92,086
- IRR
- 4.2%
- Equity multiple
- 1.33×
- Total profit
- $40,251
- Equity at exit
- $85,294
Cash invested: $122,940 (down + closing). Projections, not guarantees.
Landlord ↔ Tenant lean methodology
- Overall (STATE)
- 87 Strongly Landlord-Friendly
- State Texas
- 87 Strongly Landlord-Friendly · R+5
- County
- — inherits STATE
- City
- — inherits STATE
ZIP-level market 77459
- Home prices YoY
- -0.8%
- Rents YoY
- -0.1%
- Active inventory
- 1215
- Price-to-rent
- 7.1×
Monthly cashflow live
- Estimated rent
- $5,009 medium interval (Pro) →
- Mortgage (P&I)
- −$2,303
- Tax est. 1.5%
- −$549 /mo · $6,586/yr
- Insurance
- −$183
- HOA
- −$0
- Vacancy / Maint / Mgmt
- −$1,052
- Net cashflow
- $923
Break-even live
UW: 25.0% down · 7.5% · 30yr · 1.5% tax · 5.0% vac · 8.0% maint · 8.0% mgmt
Financing live
Cash to close
- Down payment
- $109,767
- Closing costs
- $13,172
- Reserves months
- —
- Total cash needed
- —
Loan-product check · same deal, 3 products live
Conventional
25% down · 7.5% · 30yr
- Down + closing
- —
- Monthly P&I
- —
- Monthly cashflow
- —
- DSCR
- —
- Eligible?
- —
Personal DTI + credit; lowest rate.
DSCR
20% down · 8.5% · 30yr
- Down + closing
- —
- Monthly P&I
- —
- Monthly cashflow
- —
- DSCR
- —
- Eligible?
- —
No personal income docs; deal must DSCR.
Hard money
10% down · 12.0% · 12mo
- Down + closing
- —
- Monthly P&I
- —
- Monthly cashflow
- —
- DSCR
- —
- Eligible?
- —
Short-term bridge; refi at stabilization.
Rent comps 4 comps
| Address | Beds | Baths | Sqft | Rent | $/sqft | DOM | Units | Dist |
|---|---|---|---|---|---|---|---|---|
| 8719 Fox Trail Dr Missouri City, TX | 4.0 | 3.5 | 2143 | $6,000 | $2.80 | 22d | 1 | 0.13mi |
| 2142 Ironwood Pass Dr Missouri City, TX | 4.0 | 3.0 | 2140 | $6,000 | $2.80 | 1d | 1 | 0.13mi |
| 2718 Van Gogh Ln Missouri City, TX | 4.0 | 2.5 | 3036 | $3,595 | $1.18 | 10d | 1 | 0.87mi |
| 1714 Forest Mist Dr Missouri City, TX | 3.0 | 3.0 | 1979 | $3,000 | $1.52 | 43d | 1 | 0.97mi |
Listing history 14 events
-
2026-06-18days on market $425,990 Active 161 DOM
-
2026-06-17days on market $425,990 Active 160 DOM
-
2026-06-16days on market $425,990 Active 159 DOM
-
2026-06-15days on market $425,990 Active 158 DOM
-
2026-06-13days on market $425,990 Active 156 DOM
-
2026-06-09days on market $425,990 Active 152 DOM
-
2026-06-07days on market $425,990 Active 150 DOM
-
2026-06-04days on market $425,990 Active 147 DOM
-
2026-06-03days on market $425,990 Active 146 DOM
-
2026-06-02days on market $425,990 Active 145 DOM
-
2026-06-01days on market $425,990 Active 144 DOM
-
2026-05-31days on market $425,990 Active 143 DOM
-
2026-04-01price $425,990 257-char remark
Show marketing remark (257 chars)
The Rockwall floor plan in the Portrait Series features 2,300 sqft, 4 bedrooms, 3 bathrooms, and a 2-car garage. This one-story floor plan offers study options, covered patio option, enlarged main shower option, 4 and 5 bedroom options, and 3rd bay options.
-
2026-01-09$415,990 Active 257-char remark
Show marketing remark (257 chars)
The Rockwall floor plan in the Portrait Series features 2,300 sqft, 4 bedrooms, 3 bathrooms, and a 2-car garage. This one-story floor plan offers study options, covered patio option, enlarged main shower option, 4 and 5 bedroom options, and 3rd bay options.
ⓘ Source: listings_history table (triggers on properties + properties_extension) + one-shot
backfill from property_details.listing_events for pre-trigger history.
Climate risk First Street
- Flood 1/10 Low FEMA zone X · 0% chance over 30 yrs
- Wildfire 4/10 Moderate
- Heat 9/10 Extreme 7 d/yr ≥111°F today · 24 d/yr by 30 yrs out
- Wind 9/10 Extreme 99% chance of damaging wind over 30 yrs
- Air quality 2/10 Low 2 unhealthy d/yr today · 2 by 30 yrs out
Nearby sold comps map
Loading sold comps map…
Walkable amenities ~0.75 mi
Loading nearby amenities…
Taxation est. · year 1
- Rental income
- $60,107
- − Mortgage interest
- −$24,595
- − Property taxes
- −$6,586
- − Insurance
- −$2,195
- − Repairs & maintenance
- −$4,809
- − Management
- −$4,809
- − Depreciation
- −$12,773
- Taxable income
- $4,341
- Est. tax owed @ 24.0%
- −$1,042
- After-tax cash flow
- $10,031/yr
For passive investors: Depreciation is non-cash, so a rental often shows a tax loss while cash-flowing — sheltering income. Rental losses are passive: they offset passive income freely, and up to $25,000/yr can offset ordinary (W-2) income if you actively participate and your MAGI is under $100k (phasing out to $0 by $150k); unused losses carry forward. On sale, claimed depreciation is recaptured at up to 25%, and gains may owe capital-gains tax (a 1031 exchange can defer both). Figures are a year-1 estimate at your 24.0% rate — not tax advice; consult a CPA.
Condition & rehab AI · 1 photo
This Rockwall Plan in Sienna, TX is in excellent condition with no visible repairs needed. It offers a good return on investment with updates focusing on curb appeal and HVAC maintenance.
Value-add opportunities
- Both Painting exterior and interior — Fresh paint enhances curb appeal and interior aesthetics
- Both Landscaping improvements — Enhances curb appeal and adds value
- Rental HVAC maintenance — Ensures comfort and energy efficiency for tenants
Renovation cost estimate screening
Value-add ROI direction
- Both Painting exterior and interior — Fresh paint enhances curb appeal and interior aesthetics ↑
- Both Landscaping improvements — Enhances curb appeal and adds value ↑
- Rental HVAC maintenance — Ensures comfort and energy efficiency for tenants ↑
ⓘ Cost ranges are severity-bucket heuristics (US national rule-of-thumb). Get contractor quotes + a written scope before underwriting a rehab budget.
Schools (NCES district)
- District
- Fort Bend ISD
- NCES district ID
- 4819650
- Math proficiency
- 44% ▼ -15.00%
- Reading proficiency
- 53% ▼ -4.00%
- Median HH income
- $82,360
- Composite
- 44.61/100
- National rank
- #2779
- State rank
- #140 of 826 in TX
Livability — Sienna
No livability data for this city. (Only ~50 U.S. cities are tracked.)
Census & demographics
- Census place
- Sienna, TX
- County
- Fort Bend County · 836,777 people
- City population
- 123,513
- Metro
- Houston-The Woodlands-Sugar Land, TX
- Population (ZIP)
- 84,221
- Household income
- $129,151
- Rent vs Own
- Severe rent burden
- 1004.0
Population outlook (Fort Bend County) Hauer SSP2
- Today (2025)
- 1,004,526 people
- By 2030
- 1,153,104 · +14.8%
- By 2040
- 1,453,718 · +44.7%
- By 2050
- 1,753,781 · +74.6%
- By 2075
- 2,455,772 · +144.5%
- By 2100
- 2,930,528 · +191.7%
Race, ethnicity, and origin ACS 2023
- Neighborhood character
- Highly diverse neighborhood (Simpson 0.75)
- Race & ethnicity
- White 34% Black 26% Asian 22% Hispanic / Latino 13% Two or more races 10%
- Hispanic origin (detail)
- Mexican 7%
- Common ancestry
- Lithuanian 2% Slovak 1% Italian 1%
- Foreign-born
- 21% · Canada, China, Vietnam
- Languages at home
- 73% English-only · Other Asian/Pacific 8% Spanish 7% Other Indo-European 5%
Political lean MEDSL · Fort Bend
- 2024 margin
- Toss-up / Even · D 49.5% · R 47.9% · Other 2.6%
- 2008→2024 swing
- +4.0pp toward D · 2008: -2.4pp · 2024: 1.6pp
- All cycles
- 2024: D+1.6 2020: D+10.6 2016: D+6.6 2012: R+6.8 2008: R+2.4
Not yet ingested
- Civics
- —
Market trends
- HPI YoY
- ▼ -1.67%
- Current HPI
- 212.3573
- Rent YoY
- ▼ -0.15%
- Metro
- Houston-The Woodlands-Sugar Land, TX
- State GDP YoY
- ▲ 3.95%
- F500 in state
- 110
Industry mix (Fortune 500 HQ in TX)
| Industry | F500 HQs | Revenue |
|---|---|---|
| Energy | 16 | $1,198B |
|
||
| Technology | 5 | $198B |
|
||
| Engineering / Construction | 4 | $72B |
|
||
| Energy Services | 3 | $60B |
|
||
| Utilities | 3 | $41B |
|
||
| Healthcare | 2 | $330B |
|
||
Price history
+2.4% since first listed2 events — show timeline
- 2026-04-01 Price Changed $425,990 Zillow
- 2026-01-09 Listed $415,990 Zillow
Cash-flow waterfall
monthlySold comps — $/sqft
last 12 mo · ≤1 miLoading sold comps…