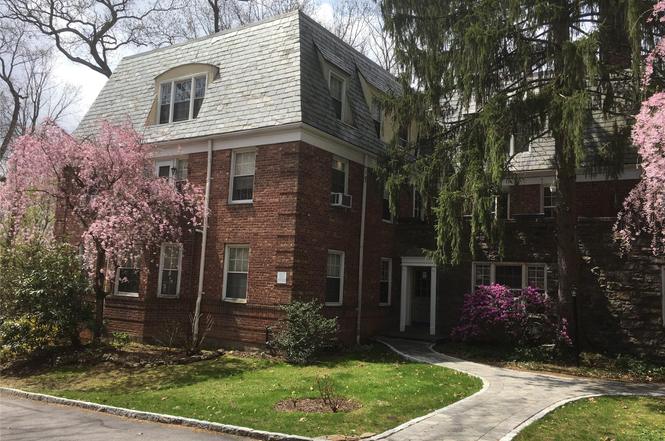
60 Pinewood Ave Unit 1B · Hartsdale, NY
Flood risk 1/10 · Minimal
- FEMA flood zone
- X (unshaded)
- Chance of flooding over 30 yrs
- 0.0%
- Est. flood insurance / yr
- $507 – $1,088
Fire risk 2/10 · Minimal
- Est. fire insurance / yr
- $691 – $1,283
Heat risk 5/10 · Moderate
- Hot days now (above 98°F)
- 7 days/yr
- Hot days in 30 yrs
- 15 days/yr
Wind risk 6/10 · Moderate
- Chance of severe wind over 30 yrs
- 27.0%
Air-quality risk 4/10 · Minor
- Unhealthy air days now
- 3 days/yr
- Unhealthy air days in 30 yrs
- 5 days/yr
Risk factors via First Street. Map © Google.
Why this score? — see what drove the B- grade
The composite is a weighted blend of 9 inputs, each scored 0–100. Each bar is that input's sub-score; the figure is the points it added to the 100-point composite (weight × sub-score).
- Cash flow +30.0/30.0
- DSCR +10.0/10.0
- 1% rule +8.5/10.0
- ARV discount +7.5/15.0
- Schools +4.9/10.0
- Livability +4.0/5.0
- Rent growth +2.5/5.0
- Condition / age +2.5/5.0
- Appreciation +0.0/10.0
$230,000
🖨 Deal sheet 📄 Offer letter ✓ Due diligence
Listing remarks
Tucked away into the wooded foothills of Pinewood Gardens, 60 Pinewood Rd. , #1B offers a comfortable one-bedroom, one-bath layout with a relaxed Westchester feel and everyday convenience close by. Inside, the home features hardwood floors, a spacious living room with recessed lighting and a wall of windows that frames leafy, treetop views, plus a defined dining area with stylish archways—ideal for meals, entertaining, or a work-from-home setup. The bright bedroom offers two windows, ample closet storage, and a calming, neutral palette. Beyond the front door, Pinewood Gardens’ grounds add to the lifestyle: enjoy community outdoor spaces including a picnic/BBQ area and playground
Key facts
- Leafy treetop views
- Recessed lighting
- Wall of windows
Tags
Neighborhood map
What this means for you Summary
Snapshot
- This is a 1-bed/1.0-bath condo listed at $230k.
Deal economics
- At list price, monthly cash flow is $860 ($10k/yr) — positive.
- The deal already cash-flows at list — no discount required.
- Meets the 1% rule at list price ($3k rent vs $230k).
- Recommended offer: $227k (1.5% below list) — sets the bar for market timing.
- Cap rate 10.8% vs local median 5.8% in Hartsdale — top-decile yield for the area; either an underpriced asset or a hidden risk that comps aren't pricing in. Stress-test before assuming the spread holds.
Location & tenants
- Location reads 81/100 on livability (#94 in NY, #1,430 nationally) — a professional / high-income tenant draw. Strengths: crime A+, employment A+, housing A+; Watch: amenities F, cost of living F.
- Greenburgh Central School District (suburban): math 51% / reading 55% proficiency, ranked #267 of 590 in NY (top 45%) — acceptable for families but not a draw, mixed tenant base, ~2y average lease.
- Zoned schools: Early Childhood Program (128 students, 0% FRL); Woodlands Middle/High School (math 62% / reading 52%, grade C, #887 of 1,100 statewide, top 82%, 681 students, 66% FRL).
- Market conditions: 156 active listings in the ZIP; 17 comparable units currently listed for rent nearby; rentals leasing fast (median 13d on market — plan ~1-2 weeks tenant-placement turnaround); 954 units permitted in Westchester County in 2024 (649 in 5+ unit buildings).
Forward outlook
- Local home prices are declining (-3.0%/yr); year-one equity from $2k of loan paydown is wiped out by about $7k of value loss. Plan a longer hold.
- Westchester County population projected at +10% by 2050 — modest demand growth; plan on rents tracking national, not racing it.
- At projected returns (-3.0% appreciation + 3.0% rent growth), your $64k cash investment doubles in ~8 years — after that, you're playing with house money.
Negotiation context
- It's been on market 28 days — a 2% lower offer ($227k) is reasonable based on typical stale-listing flexibility.
Risks & watch-outs
- Watch-outs: built in 1940 — expect roof / HVAC / electrical / plumbing capex.
- Climate carrying-cost: major wind risk, 27% chance of damaging wind over 30y; extreme-heat days projected 7→15/yr by 2055 (HVAC capex compounding) — expect insurance premiums to compound above CPI over the hold.
Questions for the listing agent
- Built in 1940 — when were the roof, HVAC, electrical panel, plumbing, and water heater last replaced?
- Any open or pending special assessments — roof, HVAC, plumbing, elevator, façade? What's the per-unit balance and payoff schedule, and is the seller paying it off at close or rolling it to the buyer?
- Is there a deadline driving the sale (1031 exchange, divorce, estate, relocation)? That informs how much negotiation room exists.
- Schools are B-rated — typically a magnet for longer-tenancy family renters. What's the average tenant stay here, and is there a school-zone premium baked into asking?
- What's the average days-on-market for RENTAL listings here right now (not sales)? A rising rental-DOM trend means longer vacancies and softer asking-rent achievability than the comps imply.
- What's the recent tenant-quality profile in this submarket — average credit score on applications, eviction rate, late-payment / NSF rate, and stable-employment percentage? A property-management company in the area should have these aggregated.
- How much new apartment / multifamily construction is in the pipeline within 1–3 miles? Heavy new supply (>2% of stock underway) typically softens rents 12–24 months out; light construction supports rent growth.
Investment metrics
- 1% rule
- 1.35% ✓
- Cap rate
- 10.78%
- Cash-on-cash
- 16.02%
- DSCR
- 1.71
- GRM
- 6.2
CMA / ARV
No comps found within radius.
Projected returns pro-forma
-3.0% appreciation · 3.0% rent growth · sell at horizon
- IRR
- 7.0%
- Equity multiple
- 1.27×
- Total profit
- $17,537
- Equity at exit
- $34,294
- IRR
- 16.3%
- Equity multiple
- 2.34×
- Total profit
- $85,974
- Equity at exit
- $19,886
Cash invested: $64,400 (down + closing). Projections, not guarantees.
Landlord ↔ Tenant lean methodology
- Overall (STATE)
- 15 Strongly Tenant-Friendly
- State New York
- 15 Strongly Tenant-Friendly · D+10
- County
- — inherits STATE
- City
- — inherits STATE
ZIP-level market 10530
- Active inventory
- 156
- Price-to-rent
- 6.2×
Monthly cashflow live
- Estimated rent
- $3,100 high interval (Pro) →
- Mortgage (P&I)
- −$1,206
- Tax est. 1.5%
- −$288 /mo · $3,450/yr
- Insurance
- −$96
- HOA
- −$0
- Vacancy / Maint / Mgmt
- −$651
- Net cashflow
- $860
Break-even live
UW: 25.0% down · 7.5% · 30yr · 1.5% tax · 5.0% vac · 8.0% maint · 8.0% mgmt
Financing live
Cash to close
- Down payment
- $57,500
- Closing costs
- $6,900
- Reserves months
- —
- Total cash needed
- —
Loan-product check · same deal, 3 products live
Conventional
25% down · 7.5% · 30yr
- Down + closing
- —
- Monthly P&I
- —
- Monthly cashflow
- —
- DSCR
- —
- Eligible?
- —
Personal DTI + credit; lowest rate.
DSCR
20% down · 8.5% · 30yr
- Down + closing
- —
- Monthly P&I
- —
- Monthly cashflow
- —
- DSCR
- —
- Eligible?
- —
No personal income docs; deal must DSCR.
Hard money
10% down · 12.0% · 12mo
- Down + closing
- —
- Monthly P&I
- —
- Monthly cashflow
- —
- DSCR
- —
- Eligible?
- —
Short-term bridge; refi at stabilization.
Rent comps 17 comps
| Address | Beds | Baths | Sqft | Rent | $/sqft | DOM | Units | Dist |
|---|---|---|---|---|---|---|---|---|
| 140 E Hartsdale Ave Hartsdale, NY | 2.0 | 1.0 | 875 | $2,895 | $3.31 | 22d | 1 | 0.61mi |
| 55 Fieldstone Dr Unit 69 Hartsdale, NY | 1.0 | 1.0 | 800 | $2,100 | $2.62 | 11d | 1 | 0.61mi |
| 250 S Central Ave Apt 3I Hartsdale, NY | 2.0 | 1.0 | 1000 | $4,350 | $4.35 | 43d | 1 | 0.79mi |
| 250 Central Park Ave Unit 5I Hartsdale, NY | 2.0 | 1.0 | 1000 | $4,550 | $4.55 | 17d | 1 | 0.81mi |
| 250 S Central Ave Hartsdale, NY | 1.0–2.0 | 1.0–2.0 | 1084 | $3,000 | $2.77 | 1d | 1 | 0.81mi |
| 400 High Point Dr Unit 206 Hartsdale, NY | 1.0 | 1.0 | 987 | $3,300 | $3.34 | 43d | 1 | 0.89mi |
| 55 McKinley Ave Unit D2-3 White Plains, NY | 1.0 | 1.0 | 809 | $2,400 | $2.97 | 43d | 1 | 1.04mi |
| 55 Bank St White Plains, NY | 2.0 | 1.0–2.0 | 861 | $3,922 | $4.56 | 1d | 23 | 1.34mi |
| 57 Bank St Unit 1040035P White Plains, NY | 2.0 | 1.0–2.0 | 726 | $7,940 | $10.94 | 2d | 3 | 1.34mi |
| 57 Bank St Unit 1040036P White Plains, NY | 1.0 | 1.0 | 592 | $7,170 | $12.11 | 18d | 1 | 1.34mi |
| 15 Bank St White Plains, NY | 1.0–2.0 | 1.0–2.0 | 934 | $2,715 | $2.91 | 1d | 20 | 1.40mi |
| 1 Martine Ave White Plains, NY | 1.0–2.0 | 1.0–2.0 | 827 | $2,850 | $3.44 | 2d | 12 | 1.44mi |
| 4 Martine Ave White Plains, NY | 1.0 | 1.0–1.5 | 773 | $2,900 | $3.75 | 43d | 2 | 1.47mi |
| 4 Martine Ave White Plains, NY | 1.0 | 1.0–1.5 | 773 | $2,850 | $3.69 | 13d | 2 | 1.47mi |
| 4 Martine Ave White Plains, NY | 1.0 | 1.0 | 707 | $2,750 | $3.89 | 2d | 1 | 1.47mi |
| 4 Martine Ave White Plains, NY | 1.0 | 1.0–1.5 | 773 | $3,025 | $3.91 | 19d | 2 | 1.47mi |
| 34 S Lexington Ave White Plains, NY | 1.0–2.0 | 1.0–2.0 | 871 | $2,695 | $3.09 | 5d | 6 | 1.48mi |
HOA detail condo
- Monthly dues
- $0 · $0/yr
- Likely covers
- landscaping
- Assessments
- None detected in remarks — confirm with the listing agent.
Listing history 2 events
-
2026-02-16status Pending
-
2026-01-18$230,000 Active
ⓘ Source: listings_history table (triggers on properties + properties_extension) + one-shot
backfill from property_details.listing_events for pre-trigger history.
Climate risk First Street
- Flood 1/10 Low FEMA zone X (unshaded) · 0% chance over 30 yrs
- Wildfire 2/10 Low
- Heat 5/10 Major 7 d/yr ≥98°F today · 15 d/yr by 30 yrs out
- Wind 6/10 Major 27% chance of damaging wind over 30 yrs
- Air quality 4/10 Moderate 3 unhealthy d/yr today · 5 by 30 yrs out
Nearby sold comps map
Loading sold comps map…
Walkable amenities ~0.75 mi
Loading nearby amenities…
Taxation est. · year 1
- Rental income
- $37,204
- − Mortgage interest
- −$12,884
- − Property taxes
- −$3,450
- − Insurance
- −$1,150
- − Repairs & maintenance
- −$2,976
- − Management
- −$2,976
- − Depreciation
- −$6,691
- Taxable income
- $7,077
- Est. tax owed @ 24.0%
- −$1,698
- After-tax cash flow
- $8,619/yr
For passive investors: Depreciation is non-cash, so a rental often shows a tax loss while cash-flowing — sheltering income. Rental losses are passive: they offset passive income freely, and up to $25,000/yr can offset ordinary (W-2) income if you actively participate and your MAGI is under $100k (phasing out to $0 by $150k); unused losses carry forward. On sale, claimed depreciation is recaptured at up to 25%, and gains may owe capital-gains tax (a 1031 exchange can defer both). Figures are a year-1 estimate at your 24.0% rate — not tax advice; consult a CPA.
Schools (NCES district)
- District
- Greenburgh Central School District
- NCES district ID
- 3612720
- Math proficiency
- 51% ▲ 4.00%
- Reading proficiency
- 55% ▲ 5.00%
- Median HH income
- $93,626
- Composite
- 49.43/100
- National rank
- #2005
- State rank
- #267 of 590 in NY
Livability — Hartsdale
- Score
- 81/100
- State rank
- #94
- US rank
- #1430
Category grades
Schools grade is shown separately in the Schools card above.
Census & demographics
- Population (ZIP)
- 13,955
Population outlook (Westchester County) Hauer SSP2
- Today (2025)
- 1,028,035 people
- By 2030
- 1,051,636 · +2.3%
- By 2040
- 1,098,520 · +6.9%
- By 2050
- 1,136,044 · +10.5%
- By 2075
- 1,196,925 · +16.4%
- By 2100
- 1,175,147 · +14.3%
Race, ethnicity, and origin ACS 2023
- Neighborhood character
- Predominantly White (68%)
- Race & ethnicity
- White 68% Hispanic / Latino 12% Asian 10% Two or more races 9% Black 7%
- Hispanic origin (detail)
- Mexican 2% Puerto Rican 4% Dominican 2%
- Common ancestry
- Romanian 9% Scotch-Irish 5% Italian 2%
- Foreign-born
- 23% · Canada, China, South Korea
- Languages at home
- 71% English-only · Spanish 9% Other Indo-European 6% Russian/Polish/Slavic 5%
Political lean MEDSL · Westchester
- 2024 margin
- Strong D (+26.3) · D 63.1% · R 36.9%
- 2008→2024 swing
- -1.3pp toward R · 2008: 27.6pp · 2024: 26.3pp
- All cycles
- 2024: D+26.3 2020: D+36.3 2016: D+32.8 2012: D+22.2 2008: D+27.6
Not yet ingested
- Civics
- —
Market trends
- HPI YoY
- ▼ -616.16%
- Current HPI
- 320.7324
- Rent YoY
- —
- Metro
- —
- State GDP YoY
- ▲ 2.60%
- F500 in state
- 92
Industry mix (Fortune 500 HQ in NY)
| Industry | F500 HQs | Revenue |
|---|---|---|
| Financial Services | 10 | $950B |
|
||
| Consumer Goods | 9 | $162B |
|
||
| Insurance | 4 | $225B |
|
||
| Telecommunications | 2 | $144B |
|
||
| Pharmaceuticals | 2 | $112B |
|
||
| Media / Entertainment | 2 | $69B |
|
||
Price history
2 events — show timeline
- 2026-02-16 Pending — OneKey® MLS as Distributed by MLS Grid
- 2026-01-18 Listed $230,000 OneKey® MLS as Distributed by MLS Grid
Cash-flow waterfall
monthlySold comps — $/sqft
last 12 mo · ≤1 miLoading sold comps…