109 Glenwood Dr · Mesquite, TX
Flood risk No data
- FEMA flood zone
- —
- Chance of flooding over 30 yrs
- —
- Est. flood insurance / yr
- —
Fire risk No data
- Est. fire insurance / yr
- —
Heat risk No data
- Hot days now (above threshold)
- —
- Hot days in 30 yrs
- —
Wind risk No data
- Chance of severe wind over 30 yrs
- —
Air-quality risk No data
- Unhealthy air days now
- —
- Unhealthy air days in 30 yrs
- —
Risk factors via First Street. Map © Google.
Why this score? — see what drove the D+ grade
The composite is a weighted blend of 9 inputs, each scored 0–100. Each bar is that input's sub-score; the figure is the points it added to the 100-point composite (weight × sub-score).
- Cash flow +20.1/30.0
- ARV discount +7.5/15.0
- DSCR +6.4/10.0
- 1% rule +4.4/10.0
- Livability +3.5/5.0
- Schools +2.9/10.0
- Rent growth +2.5/5.0
- Condition / age +2.5/5.0
- Appreciation +0.0/10.0
$262,999
🖨 Deal sheet (PDF) 📄 Offer letter ✓ Due diligence
Listing remarks
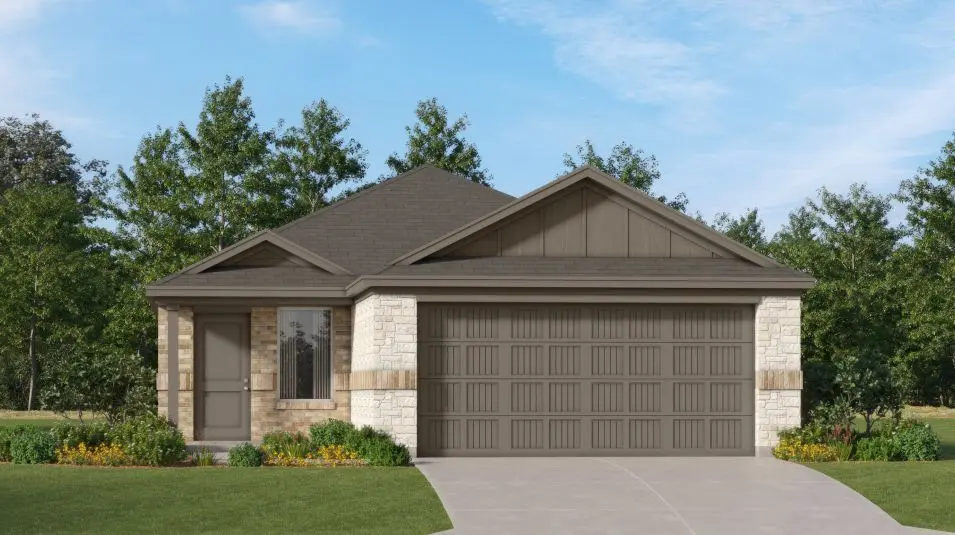
This single-level home showcases a spacious open floorplan shared between the kitchen, dining area and family room for easy entertaining. An owner's suite enjoys a private location in a rear corner of the home, complemented by an en-suite bathroom and walk-in closet. There are three secondary bedrooms along the side of the home, which are comfortable spaces for household members and overnight guests.
Key facts
- Walk-in closet
- Open floorplan
- Secondary bedrooms
Tags
Neighborhood map
What this means for you Summary
Snapshot
- This is a 4-bed/2.0-bath land listed at $263k.
Deal economics
- At list price, monthly cash flow is $325 ($4k/yr) — positive.
- The deal already cash-flows at list — no discount required.
- To meet the 1% rule (rent ≥ 1% of price), the offer needs to be $246k (6.4% below list).
- Recommended offer: $246k (6.4% below list) — sets the bar for 1% rule.
- Cap rate 7.8% vs local median 4.4% in Mesquite — top-decile yield for the area; either an underpriced asset or a hidden risk that comps aren't pricing in. Stress-test before assuming the spread holds.
Location & tenants
- Location reads 70/100 on livability (#358 in TX) — a middle-class / working-renter tenant base. Strengths: cost of living A+, housing A+, health & safety A-; Watch: crime F, commute F.
- Mesquite ISD (suburban): math 35% / reading 32% proficiency, ranked #536 of 826 in TX (top 65%) — families likely to look elsewhere, expect single-tenant / working-renter base with shorter leases; 63% free/reduced lunch — lower-income household profile, screen leases tightly.
- Zoned schools: Achziger El (math 31% / reading 35%, grade F, #2,208 of 4,322 statewide, top 52%, 846 students, 75% FRL); Berry Middle (math 45% / reading 41%, grade D-, #540 of 1,662 statewide, top 33%, 579 students, 76% FRL); Horn H S (math 41% / reading 36%, grade F, #866 of 1,632 statewide, top 54%, 3,029 students, 74% FRL).
- Market conditions: Rents flat; 598 active listings in the ZIP; 17 comparable units currently listed for rent nearby; rentals at typical pace (median 24d on market — plan ~3-4 weeks tenant-placement turnaround); high-income renter base; 12,577 units permitted in Dallas County in 2024 (6,829 in 5+ unit buildings).
Forward outlook
- Local home prices are declining (-3.0%/yr); year-one equity from $2k of loan paydown is wiped out by about $8k of value loss. Plan a longer hold.
- Dallas County population projected at +35% by 2050 — long-run rental-demand tailwind backs the buy-and-hold thesis.
Negotiation context
- It's been on market 37 days — a 3% lower offer ($255k) is reasonable based on typical stale-listing flexibility.
Questions for the listing agent
- It's been on market 37 days. Have you received any prior offers? Is the seller open to a 6% concession, seller financing, or rate buy-down credit?
- Is there a deadline driving the sale (1031 exchange, divorce, estate, relocation)? That informs how much negotiation room exists.
- Crime grade is F in this area — have there been break-ins, vandalism, or insurance claims at this property in the last 3 years? What carrier currently insures it and at what premium?
- The area grade is low — what's the realistic commute time and amenity access for the typical tenant pool here? Any planned neighborhood developments (good or bad) we should know about?
- What's the average days-on-market for RENTAL listings here right now (not sales)? A rising rental-DOM trend means longer vacancies and softer asking-rent achievability than the comps imply.
- What's the recent tenant-quality profile in this submarket — average credit score on applications, eviction rate, late-payment / NSF rate, and stable-employment percentage? A property-management company in the area should have these aggregated.
- How much new for-sale + rental construction is in the pipeline within 1–3 miles? Heavy new supply typically softens prices + rents 12–24 months out; constrained supply supports both.
Investment metrics
- 1% rule
- 0.94% ✗
- Cap rate
- 7.78%
- Cash-on-cash
- 5.30%
- DSCR
- 1.24
- GRM
- 8.9
CMA / ARV
- ARV (median comp)
- $616,287
- List price
- $262,999
- Delta
- -57.33%
- Verdict
- UNDERPRICED
- Comps
- 7 within 2.0 mi
Projected returns pro-forma
-3.0% appreciation · 0.07% rent growth · sell at horizon
- IRR
- -11.1%
- Equity multiple
- 0.61×
- Total profit
- $-29,020
- Equity at exit
- $39,214
- IRR
- -6.3%
- Equity multiple
- 0.64×
- Total profit
- $-26,200
- Equity at exit
- $22,739
Cash invested: $73,640 (down + closing). Projections, not guarantees.
Landlord ↔ Tenant lean methodology
- Overall (STATE)
- 87 Strongly Landlord-Friendly
- State Texas
- 87 Strongly Landlord-Friendly · R+5
- County
- — inherits STATE
- City
- — inherits STATE
ZIP-level market 75181
- Home prices YoY
- -9.4%
- Rents YoY
- 0.1%
- Active inventory
- 598
- Price-to-rent
- 8.9×
Monthly cashflow live
- Estimated rent
- $2,461 high interval (Pro) →
- Mortgage (P&I)
- −$1,379
- Tax from tax record
- −$130 /mo · $1,559/yr
- Insurance
- −$110
- HOA
- −$0
- Vacancy / Maint / Mgmt
- −$517
- Net cashflow
- $325
Break-even live
Sensitivity live
| Price | -10% $474 | -5% $400 | +0% $325 | +5% $251 | +10% $177 |
|---|---|---|---|---|---|
| Rent | -10% $131 | -5% $228 | +0% $325 | +5% $423 | +10% $520 |
| Rate | -1.0pp $458 | -0.5pp $392 | base $325 | +0.5pp $257 | +1.0pp $188 |
UW: 25.0% down · 7.5% · 30yr · 1.5% tax · 5.0% vac · 8.0% maint · 8.0% mgmt
Financing live
Cash to close
- Down payment
- $65,750
- Closing costs
- $7,890
- Reserves months
- —
- Total cash needed
- —
Loan-product check · same deal, 3 products live
Conventional
25% down · 7.5% · 30yr
- Down + closing
- —
- Monthly P&I
- —
- Monthly cashflow
- —
- DSCR
- —
- Eligible?
- —
Personal DTI + credit; lowest rate.
DSCR
20% down · 8.5% · 30yr
- Down + closing
- —
- Monthly P&I
- —
- Monthly cashflow
- —
- DSCR
- —
- Eligible?
- —
No personal income docs; deal must DSCR.
Hard money
10% down · 12.0% · 12mo
- Down + closing
- —
- Monthly P&I
- —
- Monthly cashflow
- —
- DSCR
- —
- Eligible?
- —
Short-term bridge; refi at stabilization.
Rent comps 17 comps
| Address | Beds | Baths | Sqft | Rent | $/sqft | DOM | Units | Dist |
|---|---|---|---|---|---|---|---|---|
| 127 Woodhill St Mesquite, TX | 3.0 | 2.0 | 1545 | $1,950 | $1.26 | 12d | 1 | 0.77mi |
| 222 Redwood St Mesquite, TX | 3.0 | 2.0 | 1132 | $1,775 | $1.57 | 45d | 1 | 0.81mi |
| 1332 Nimitz Way Mesquite, TX | 4.0 | 2.0 | 2109 | $2,280 | $1.08 | 22d | 1 | 0.84mi |
| 4642 Elm Point Dr Balch Springs, TX | 3.0 | 2.0 | 2100 | $2,199 | $1.05 | 7d | 1 | 0.90mi |
| 1309 Dawson Way Mesquite, TX | 4.0 | 2.0 | 1952 | $2,222 | $1.14 | 9d | 1 | 0.94mi |
| 2749 Ingram Cir Mesquite, TX | 3.0 | 2.0 | 1791 | $2,119 | $1.18 | 4d | 1 | 1.00mi |
| 2805 Cameron Way Mesquite, TX | 3.0 | 2.0 | 1660 | $2,150 | $1.30 | 14d | 1 | 1.18mi |
| 14419 Briarcrest Dr Balch Springs, TX | 3.0 | 2.0 | 1350 | $1,695 | $1.26 | 45d | 1 | 1.20mi |
| 15115 Oakwood Ln Unit 1 Mesquite, TX | 3.0 | 1.5 | 1102 | $1,850 | $1.68 | 45d | 1 | 1.22mi |
| 12416 Fish Rd Dallas, TX | 4.0 | 2.0 | 1427 | $2,011 | $1.41 | 7d | 1 | 1.28mi |
| 2801 Sonora Ln Mesquite, TX | 4.0 | 2.0 | 1938 | $2,245 | $1.16 | 26d | 1 | 1.29mi |
| 2800 Crockett Pl Mesquite, TX | 3.0 | 2.0 | 1660 | $1,895 | $1.14 | 23d | 1 | 1.32mi |
| 2004 Poppy Way Mesquite, TX | 3.0 | 2.0 | 1572 | $2,700 | $1.72 | 45d | 1 | 1.37mi |
| 13131 Rocky Ledge Dr Balch Springs, TX | 3.0 | 2.0 | 1565 | $1,883 | $1.20 | 4d | 1 | 1.41mi |
| 2724 Windswept Ln Mesquite, TX | 3.0 | 2.0 | 1402 | $2,300 | $1.64 | 26d | 1 | 1.42mi |
| 4320 Mohawk Dr Balch Springs, TX | 4.0 | 2.0 | 1110 | $1,900 | $1.71 | 26d | 1 | 1.44mi |
| 4605 Navajo Trl Balch Springs, TX | 3.0 | 2.0 | 1152 | $1,795 | $1.56 | 45d | 1 | 1.45mi |
Listing history 7 events
-
2026-06-07days on market $262,999 Active 37 DOM
-
2026-06-04days on market $262,999 Active 34 DOM
-
2026-06-03days on market $262,999 Active 33 DOM
-
2026-06-02days on market $262,999 Active 32 DOM
-
2026-06-01days on market $262,999 Active 31 DOM
-
2026-05-31days on market $262,999 Active 30 DOM
-
2026-05-01$262,999 Active 403-char remark
ⓘ Source: listings_history table (triggers on properties + properties_extension) + one-shot
backfill from property_details.listing_events for pre-trigger history.
Tax reassessment forecast TX · Resets to sale price
- Current annual tax
- $1,559 · $130/mo
- Projected year-2 tax
- $4,813 · $401/mo
- Expected delta
- +$3,254/yr (+$271/mo · 208.8%)
ⓘ Screening estimate from a state-policy table — verify with the county assessor before closing.
Nearby sold comps map
Loading sold comps map…
Walkable amenities ~0.75 mi
Loading nearby amenities…
Taxation est. · year 1
- Rental income
- $29,532
- − Mortgage interest
- −$14,732
- − Property taxes
- −$1,559
- − Insurance
- −$1,315
- − Repairs & maintenance
- −$2,363
- − Management
- −$2,363
- − Depreciation
- −$7,651
- Taxable loss
- −$450
- Est. tax savings @ 24.0%
- +$108
- After-tax cash flow
- $4,014/yr
For passive investors: Depreciation is non-cash, so a rental often shows a tax loss while cash-flowing — sheltering income. Rental losses are passive: they offset passive income freely, and up to $25,000/yr can offset ordinary (W-2) income if you actively participate and your MAGI is under $100k (phasing out to $0 by $150k); unused losses carry forward. On sale, claimed depreciation is recaptured at up to 25%, and gains may owe capital-gains tax (a 1031 exchange can defer both). Figures are a year-1 estimate at your 24.0% rate — not tax advice; consult a CPA.
Schools (NCES district)
- District
- Mesquite ISD
- NCES district ID
- 4830390
- Math proficiency
- 35% ▼ -11.00%
- Reading proficiency
- 32% ▼ -7.00%
- Median HH income
- $49,372
- Composite
- 29.06/100
- National rank
- #6606
- State rank
- #536 of 826 in TX
Livability — Mesquite
- Score
- 70/100
- State rank
- #358
- US rank
- #7743
Category grades
Schools grade is shown separately in the Schools card above.
Census & demographics
- County
- Dallas County · 2,612,404 people
- City population
- 150,788
- Metro
- Dallas-Fort Worth-Arlington, TX
- Population (ZIP)
- 29,788
- Household income
- $111,052
- Rent vs Own
- Severe rent burden
- 857.0
Population outlook (Dallas County) Hauer SSP2
- Today (2025)
- 2,979,839 people
- By 2030
- 3,191,823 · +7.1%
- By 2040
- 3,619,611 · +21.5%
- By 2050
- 4,026,915 · +35.1%
- By 2075
- 4,957,073 · +66.4%
- By 2100
- 5,508,725 · +84.9%
Race, ethnicity, and origin ACS 2023
- Neighborhood character
- Highly diverse neighborhood (Simpson 0.71)
- Race & ethnicity
- Black 39% Hispanic / Latino 32% Two or more races 21% White 16% Asian 5% Native American 1%
- Hispanic origin (detail)
- Mexican 27% Puerto Rican 1%
- Common ancestry
- Slovak 2% Italian 1%
- Foreign-born
- 22% · Canada, Vietnam
- Languages at home
- 64% English-only · Spanish 27% Tagalog/Filipino 3% Other Asian/Pacific 1%
Political lean MEDSL · Dallas
- 2024 margin
- Strong D (+22.2) · D 60.2% · R 38.0% · Other 1.8%
- 2008→2024 swing
- +6.9pp toward D · 2008: 15.3pp · 2024: 22.2pp
- All cycles
- 2024: D+22.2 2020: D+31.6 2016: D+26.2 2012: D+15.4 2008: D+15.3
Not yet ingested
- Civics
- —
Market trends
- HPI YoY
- ▼ -26.63%
- Current HPI
- 257.0959
- Rent YoY
- ▲ 0.07%
- Metro
- Dallas-Fort Worth-Arlington, TX
- State GDP YoY
- ▲ 3.95%
- F500 in state
- 110
Industry mix (Fortune 500 HQ in TX)
| Industry | F500 HQs | Revenue |
|---|---|---|
| Energy | 16 | $1,198B |
|
||
| Technology | 5 | $198B |
|
||
| Engineering / Construction | 4 | $72B |
|
||
| Energy Services | 3 | $60B |
|
||
| Utilities | 3 | $41B |
|
||
| Healthcare | 2 | $330B |
|
||
Property tax history
+60.7%/yrLatest (2025): $1,559 · +60.7% YoY. Source: county tax records.
Cash-flow waterfall
monthlySold comps — $/sqft
last 12 mo · ≤1 miLoading sold comps…