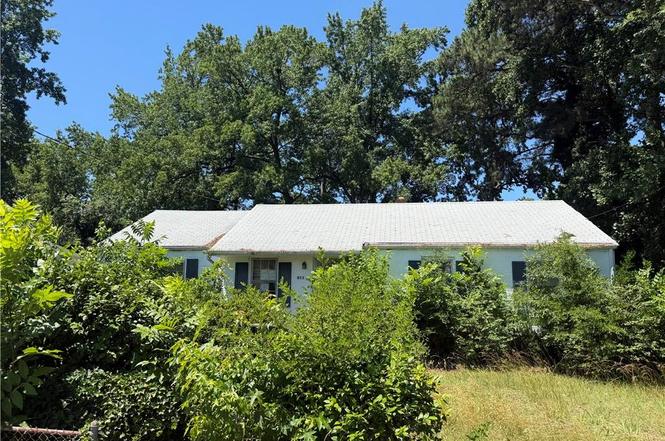
511 Brightwood Ave · Hampton, VA
Flood risk 5/10 · Moderate
- FEMA flood zone
- X (unshaded)
- Chance of flooding over 30 yrs
- 0.51%
- Est. flood insurance / yr
- $473 – $860
Fire risk 1/10 · Minimal
- Est. fire insurance / yr
- $666 – $1,236
Heat risk 9/10 · Severe
- Hot days now (above 105°F)
- 7 days/yr
- Hot days in 30 yrs
- 16 days/yr
Wind risk 8/10 · Major
- Chance of severe wind over 30 yrs
- 80.0%
Air-quality risk 2/10 · Minimal
- Unhealthy air days now
- 1 days/yr
- Unhealthy air days in 30 yrs
- 1 days/yr
Risk factors via First Street. Map © Google.
Why this score? — see what drove the B+ grade
The composite is a weighted blend of 9 inputs, each scored 0–100. Each bar is that input's sub-score; the figure is the points it added to the 100-point composite (weight × sub-score).
- Cash flow +27.8/30.0
- ARV discount +15.0/15.0
- DSCR +9.8/10.0
- 1% rule +7.5/10.0
- Schools +5.5/10.0
- Rent growth +5.0/5.0
- Livability +3.8/5.0
- Condition / age +2.5/5.0
- Appreciation +0.0/10.0
$150,000
🖨 Deal sheet 📄 Offer letter ✓ Due diligence
Listing remarks
Investor special! Centrally located great ARV!
Key facts
- 0.23 acre lot
- Garage
- Built 1953
Property features AI
Finance
- HOA & community: No HOA fees
Exterior
- Parking: Garage approximately 396 sq. ft.
- Utilities: City/County water; City/County sewer; Electric water heater
- Home design: Detached single-story home; Entry level: 1; Ownership: Simple
- Construction: Crawl foundation; Asphalt shingle roof
- Exterior features: Brick siding; Lot approximately 0.23 acres; Lot front approximately 80 ft; Lot depth approximately 124 ft
Interior
- Kitchen: Kitchen
- Bedrooms: Master bedroom; Additional bedroom; Bedroom and full bathroom on first floor
- Bathrooms: 1 full bathroom
- Interior features: Living room; Great room; Dining room; Family room; Utility room
- Laundry & utility: Utility room
Neighborhood map
What this means for you Summary
Snapshot
- This is a 3-bed/1.0-bath single-family listed at $150k.
Deal economics
- At list price, monthly cash flow is $459 ($6k/yr) — positive.
- The deal already cash-flows at list — no discount required.
- Meets the 1% rule at list price ($2k rent vs $150k).
- Cap rate 10.0% vs local median 4.5% in Hampton — top-decile yield for the area; either an underpriced asset or a hidden risk that comps aren't pricing in. Stress-test before assuming the spread holds.
Location & tenants
- Location reads 75/100 on livability (#133 in VA, #4,302 nationally) — a middle-class / working-renter tenant base. Strengths: housing A+, health & safety A+, cost of living A; Watch: crime C-, amenities D+, commute F.
- Hampton City Public School District (urban): math 60% / reading 70% proficiency, ranked #40 of 131 in VA (top 30%) — acceptable for families but not a draw, mixed tenant base, ~2y average lease.
- Zoned schools: Hunter B. Andrews (math 65% / reading 72%, grade B+, #357 of 1,108 statewide, top 33%, 1,131 students, 81% FRL); Hampton High (math 60% / reading 75%, grade B, #183 of 319 statewide, top 58%, 1,359 students, 86% FRL) — zoned schools average 84% FRL vs 49% district-wide (35 pts higher); higher-poverty schools than district average — tighter screening recommended.
- Market conditions: Rents rising fast (+21.4%/yr); 123 active listings in the ZIP; 25 comparable units currently listed for rent nearby; rentals at typical pace (median 24d on market — plan ~3-4 weeks tenant-placement turnaround); 44% of comp listings sitting > 30 days — soft ceiling on asking rent; 68 units permitted in Hampton city in 2024 (0 in 5+ unit buildings).
- This rent runs 34% of the median local income ($65k/yr) — at the standard rent-burdened threshold; future hikes will face affordability resistance.
Forward outlook
- Local home prices are declining (-3.0%/yr); year-one equity from $1k of loan paydown is wiped out by about $4k of value loss. Plan a longer hold.
- Hampton County population projected at -13% by 2050 — secular population decline; favor cash flow + early exit over multi-decade hold.
- At projected returns (-3.0% appreciation + 8.0% rent growth), your $42k cash investment doubles in ~7 years — after that, you're playing with house money.
Negotiation context
- Only 3 days on market — expect competitive offers; lowballing is unlikely to land.
- Current owner paid $16k; list at $150k implies a 809% gain — meaningful room to come down on a strong offer.
Risks & watch-outs
- Watch-outs: built in 1953 — expect roof / HVAC / electrical / plumbing capex.
- Climate carrying-cost: moderate flood risk; severe wind risk, 80% chance of damaging wind over 30y; extreme-heat days projected 7→16/yr by 2055 (HVAC capex compounding) — expect insurance premiums to compound above CPI over the hold.
Questions for the listing agent
- Built in 1953 — when were the roof, HVAC, electrical panel, plumbing, and water heater last replaced?
- Is there a deadline driving the sale (1031 exchange, divorce, estate, relocation)? That informs how much negotiation room exists.
- Schools are B-rated — typically a magnet for longer-tenancy family renters. What's the average tenant stay here, and is there a school-zone premium baked into asking?
- What's the average days-on-market for RENTAL listings here right now (not sales)? A rising rental-DOM trend means longer vacancies and softer asking-rent achievability than the comps imply.
- What's the recent tenant-quality profile in this submarket — average credit score on applications, eviction rate, late-payment / NSF rate, and stable-employment percentage? A property-management company in the area should have these aggregated.
- How much new for-sale + rental construction is in the pipeline within 1–3 miles? Heavy new supply typically softens prices + rents 12–24 months out; constrained supply supports both.
Investment metrics
- 1% rule
- 1.25% ✓
- Cap rate
- 9.97%
- Cash-on-cash
- 13.13%
- DSCR
- 1.58
- GRM
- 6.7
CMA / ARV
- ARV (on-the-fly)
- $256,742
- Comps found
- 12
Show comp detail 12 sales within ~0.75 mi
| Address | Dist | Beds/Ba | Sqft | Sold | Price | $/sf | Match |
|---|---|---|---|---|---|---|---|
| 812 Ridgeway Ave | 0.36mi | 3/1.5 | 1,240 (-2%) | 3mo | $250,000 | $202 | 75 |
| 44 Henry St | 0.43mi | 3/2.0 | 1,284 (+1%) | 0mo | $299,900 | $234 | 74 |
| 625 Bell St | 0.51mi | 3/1.0 | 1,212 (-5%) | 1mo | $146,000 | $120 | 67 |
| 622 Chapel St | 0.52mi | 3/1.5 | 1,221 (-4%) | 1mo | $193,000 | $158 | 67 |
| 428 Colonial Ave | 0.37mi | 3/1.0 | 1,151 (-9%) | 3mo | $232,000 | $202 | 65 |
| 633 Bell St | 0.53mi | 3/2.0 | 1,200 (-6%) | 3mo | $245,000 | $204 | 60 |
| 355 Ivy Home Rd | 0.27mi | 4/2.5 (+1) | 1,400 (+10%) | 0mo | $299,800 | $214 | 59 |
| 402 Melville Rd | 0.63mi | 3/1.0 | 1,180 (-7%) | 2mo | $215,000 | $182 | 58 |
| 460 England Ave | 0.32mi | 3/2.5 | 1,107 (-13%) | 1mo | $230,000 | $208 | 57 |
| 814 Downing St | 0.42mi | 3/1.5 | 1,116 (-12%) | 3mo | $210,000 | $188 | 56 |
| 647 Bell St | 0.56mi | 3/1.5 | 1,148 (-10%) | 1mo | $148,000 | $129 | 54 |
| 19 Maplewood St | 0.74mi | 3/2.0 | 1,132 (-11%) | 2mo | $240,000 | $212 | 42 |
Match score weights: distance 35% · size 25% · config 20% · recency 20%. Top-matched comps best support the ARV.
Projected returns pro-forma
-3.0% appreciation · 8.0% rent growth · sell at horizon
- IRR
- 8.5%
- Equity multiple
- 1.35×
- Total profit
- $14,881
- Equity at exit
- $22,365
- IRR
- 21.6%
- Equity multiple
- 3.28×
- Total profit
- $95,798
- Equity at exit
- $12,969
Cash invested: $42,000 (down + closing). Projections, not guarantees.
Landlord ↔ Tenant lean methodology
- Overall (STATE)
- 55 Moderately Landlord-Leaning
- State Virginia
- 55 Moderately Landlord-Leaning · D+2
- County
- — inherits STATE
- City
- — inherits STATE
ZIP-level market 23661
- Home prices YoY
- -16.7%
- Rents YoY
- 21.4%
- Active inventory
- 123
- Price-to-rent
- 6.7×
Monthly cashflow live
- Estimated rent
- $1,874 high interval (Pro) →
- Mortgage (P&I)
- −$787
- Tax from tax record
- −$172 /mo · $2,065/yr
- Insurance
- −$62
- HOA
- −$0
- Vacancy / Maint / Mgmt
- −$394
- Net cashflow
- $459
Break-even live
UW: 25.0% down · 7.5% · 30yr · 1.5% tax · 5.0% vac · 8.0% maint · 8.0% mgmt
Financing live
Cash to close
- Down payment
- $37,500
- Closing costs
- $4,500
- Reserves months
- —
- Total cash needed
- —
Loan-product check · same deal, 3 products live
Conventional
25% down · 7.5% · 30yr
- Down + closing
- —
- Monthly P&I
- —
- Monthly cashflow
- —
- DSCR
- —
- Eligible?
- —
Personal DTI + credit; lowest rate.
DSCR
20% down · 8.5% · 30yr
- Down + closing
- —
- Monthly P&I
- —
- Monthly cashflow
- —
- DSCR
- —
- Eligible?
- —
No personal income docs; deal must DSCR.
Hard money
10% down · 12.0% · 12mo
- Down + closing
- —
- Monthly P&I
- —
- Monthly cashflow
- —
- DSCR
- —
- Eligible?
- —
Short-term bridge; refi at stabilization.
Rent comps 25 comps
| Address | Beds | Baths | Sqft | Rent | $/sqft | DOM | Units | Dist |
|---|---|---|---|---|---|---|---|---|
| 507 Highland Ave Hampton, VA | 2.0 | 1.0 | 925 | $1,500 | $1.62 | 14d | 1 | 0.10mi |
| 534 Brightwood Ave Hampton, VA | 3.0 | 3.0 | 1528 | $2,095 | $1.37 | 43d | 1 | 0.12mi |
| 708 Westwood Ave Hampton, VA | 3.0 | 2.5 | 1300 | $2,300 | $1.77 | 14d | 1 | 0.25mi |
| 310 Lasalle Ave Hampton, VA | 3.0 | 2.0 | 1858 | $2,200 | $1.18 | 43d | 1 | 0.39mi |
| 702 Rutherford St Hampton, VA | 3.0 | 2.0 | 1445 | $1,795 | $1.24 | 23d | 1 | 0.41mi |
| 607 Lee St Hampton, VA | 3.0 | 1.5 | 1404 | $2,150 | $1.53 | 43d | 1 | 0.47mi |
| 626 Chapel St Hampton, VA | 4.0 | 2.0 | 1470 | $1,900 | $1.29 | 12d | 1 | 0.53mi |
| 901 W Queen St Hampton, VA | 2.0–3.0 | 1.5–2.5 | 1096 | $1,600 | $1.46 | 43d | 1 | 0.63mi |
| 448 Chapel St Hampton, VA | 3.0 | 2.0 | 1425 | $1,850 | $1.30 | 2d | 1 | 0.66mi |
| 3750 Kecoughtan Rd Hampton, VA | 2.0 | 1.5 | 1300 | $1,600 | $1.23 | 43d | 1 | 0.70mi |
| 1625 W Pembroke Ave Hampton, VA | 2.0 | 1.5 | 950 | $1,250 | $1.32 | 23d | 1 | 0.84mi |
| 1625 W Pembroke Ave Unit 7 Hampton, VA | 2.0 | 1.5 | 950 | $1,250 | $1.32 | 43d | 1 | 0.84mi |
| 63 Algonquin Rd Hampton, VA | 2.0 | 1.0 | 1100 | $1,495 | $1.36 | 43d | 1 | 0.94mi |
| 236 Pocahontas Pl Hampton, VA | 2.0 | 1.0 | 1262 | $1,795 | $1.42 | 2d | 1 | 1.17mi |
| 27 Capps Qtrs #1 Hampton, VA | 3.0 | 2.5 | 1734 | $2,200 | $1.27 | 43d | 1 | 1.17mi |
| 640 Rolfe St Hampton, VA | 3.0 | 2.0 | 1100 | $2,000 | $1.82 | 43d | 1 | 1.18mi |
| 130 Pocahontas Pl Hampton, VA | 3.0 | 1.0 | 1415 | $1,695 | $1.20 | 43d | 1 | 1.23mi |
| 101 Prince James Dr Hampton, VA | 3.0 | 1.0 | 1766 | $1,645 | $0.93 | 14d | 1 | 1.26mi |
| 2113 Victoria Blvd Hampton, VA | 3.0 | 1.0 | 1005 | $1,595 | $1.59 | 43d | 1 | 1.36mi |
| 100 Chesterfield Rd Hampton, VA | 3.0 | 1.5 | 1742 | $2,200 | $1.26 | 4d | 1 | 1.37mi |
| 316 Fountain Way Hampton, VA | 3.0 | 2.5 | 1850 | $2,600 | $1.41 | 17d | 1 | 1.37mi |
| 600 Freeman Dr Hampton, VA | 1.0–2.0 | 1.0–2.0 | 892 | $2,008 | $2.25 | 2d | 8 | 1.45mi |
| 1943 Kecoughtan Rd Hampton, VA | 2.0 | 1.0 | 900 | $1,150 | $1.28 | 4d | 1 | 1.47mi |
| 1943 Kecoughtan Rd Unit G Hampton, VA | 2.0 | 1.0 | 900 | $1,150 | $1.28 | 12d | 1 | 1.47mi |
| 613 Delaware Ave Hampton, VA | 3.0 | 2.0 | 1082 | $1,900 | $1.76 | 2d | 1 | 1.50mi |
Listing history 5 events
-
2026-06-18days on market $150,000 Active 3 DOM
-
2026-06-17days on market $150,000 Active 2 DOM
-
2026-06-16price $150,000 Active 1 DOM
-
2026-06-16remarks 46-char remark
-
2026-06-16$350,000 Active 1 DOM
ⓘ Source: listings_history table (triggers on properties + properties_extension) + one-shot
backfill from property_details.listing_events for pre-trigger history.
Tax reassessment forecast VA · Resets to sale price
- Current annual tax
- $2,065 · $172/mo
- Projected year-2 tax
- $2,065 · $172/mo
- Expected delta
- $0/yr ($0/mo · 0.0%)
ⓘ Screening estimate from a state-policy table — verify with the county assessor before closing.
Climate risk First Street
- Flood 5/10 Major FEMA zone X (unshaded) · 51% chance over 30 yrs
- Wildfire 1/10 Low
- Heat 9/10 Extreme 7 d/yr ≥105°F today · 16 d/yr by 30 yrs out
- Wind 8/10 Severe 80% chance of damaging wind over 30 yrs
- Air quality 2/10 Low 1 unhealthy d/yr today · 1 by 30 yrs out
Nearby sold comps map
Loading sold comps map…
Walkable amenities ~0.75 mi
Loading nearby amenities…
Taxation est. · year 1
- Rental income
- $22,491
- − Mortgage interest
- −$8,402
- − Property taxes
- −$2,065
- − Insurance
- −$750
- − Repairs & maintenance
- −$1,799
- − Management
- −$1,799
- − Depreciation
- −$4,364
- Taxable income
- $3,312
- Est. tax owed @ 24.0%
- −$795
- After-tax cash flow
- $4,719/yr
For passive investors: Depreciation is non-cash, so a rental often shows a tax loss while cash-flowing — sheltering income. Rental losses are passive: they offset passive income freely, and up to $25,000/yr can offset ordinary (W-2) income if you actively participate and your MAGI is under $100k (phasing out to $0 by $150k); unused losses carry forward. On sale, claimed depreciation is recaptured at up to 25%, and gains may owe capital-gains tax (a 1031 exchange can defer both). Figures are a year-1 estimate at your 24.0% rate — not tax advice; consult a CPA.
Schools (NCES district)
- District
- Hampton City Public School District
- NCES district ID
- 5101800
- Math proficiency
- 60% ▼ -21.00%
- Reading proficiency
- 70% ▼ -4.00%
- Median HH income
- $50,089
- Composite
- 55.19/100
- National rank
- #1272
- State rank
- #40 of 131 in VA
Livability — Hampton
- Score
- 75/100
- State rank
- #133
- US rank
- #4302
Category grades
Schools grade is shown separately in the Schools card above.
Census & demographics
- Census place
- Hampton, VA
- County
- Hampton City · 132,421 people
- City population
- 132,421
- Metro
- Virginia Beach-Norfolk-Newport News, VA-NC
- Population (ZIP)
- 14,005
- Household income
- $65,446
- Rent vs Own
- Severe rent burden
- 704.0
Population outlook (Hampton County) Hauer SSP2
- Today (2025)
- 134,055 people
- By 2030
- 131,753 · -1.7%
- By 2040
- 125,017 · -6.7%
- By 2050
- 116,825 · -12.9%
- By 2075
- 97,033 · -27.6%
- By 2100
- 76,188 · -43.2%
Race, ethnicity, and origin ACS 2023
- Neighborhood character
- Diverse neighborhood (Simpson 0.56)
- Race & ethnicity
- Black 59% White 31% Two or more races 6% Hispanic / Latino 4%
- Common ancestry
- Serbian 2% Italian 2% Romanian 1%
- Foreign-born
- 3% · Canada
- Languages at home
- 95% English-only · Spanish 2% French/Haitian/Cajun 1% Arabic 1%
Political lean MEDSL · Hampton
- 2024 margin
- Solid D (+39.9) · D 69.2% · R 29.4% · Other 1.4%
- 2008→2024 swing
- +1.0pp no change · 2008: 38.9pp · 2024: 39.9pp
- All cycles
- 2024: D+39.9 2020: D+42.2 2016: D+37.8 2012: D+45.4 2008: D+38.9
Not yet ingested
- Civics
- —
Market trends
- HPI YoY
- ▼ -54.95%
- Current HPI
- 274.2769
- Rent YoY
- ▲ 21.35%
- Metro
- Virginia Beach-Norfolk-Newport News, VA-NC
- State GDP YoY
- ▲ 2.40%
- F500 in state
- 50
Industry mix (Fortune 500 HQ in VA)
| Industry | F500 HQs | Revenue |
|---|---|---|
| Aerospace / Defense | 4 | $236B |
|
||
| Technology / Defense | 3 | $32B |
|
||
| Financial Services | 2 | $176B |
|
||
| Utilities | 2 | $27B |
|
||
| Insurance | 2 | $25B |
|
||
| Technology | 2 | $15B |
|
||
Price history
+2021.2% since first listed2 events — show timeline
- 2026-06-15 Listed $350,000 REINMLS
- 1969-09-01 Sold (Public Records) $16,500 Public Records
Property tax history
+38.4%/yrLatest (2025): $2,065 · +8.5% YoY. Source: county tax records.
Cash-flow waterfall
monthlySold comps — $/sqft
last 12 mo · ≤1 miLoading sold comps…