 🌊 Lakefront
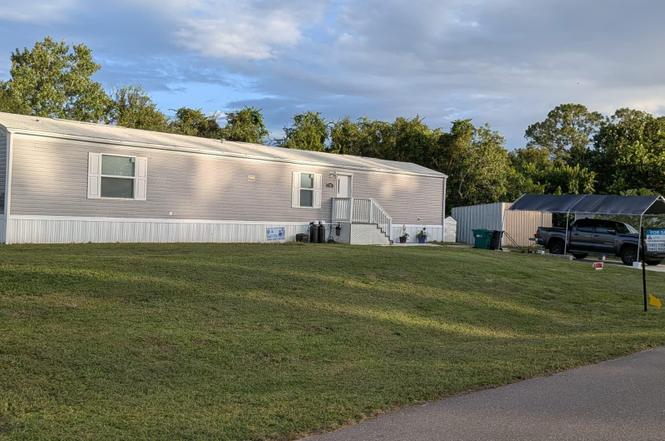
5945 SE 95th Trail Trl · Taylor Creek, FL
Flood risk 1/10 · Minimal
- FEMA flood zone
- X (unshaded)
- Chance of flooding over 30 yrs
- 0.0%
- Est. flood insurance / yr
- $507 – $1,088
Fire risk 3/10 · Minor
- Est. fire insurance / yr
- $947 – $1,759
Heat risk 9/10 · Severe
- Hot days now (above 107°F)
- 7 days/yr
- Hot days in 30 yrs
- 24 days/yr
Wind risk 10/10 · Severe
- Chance of severe wind over 30 yrs
- 99.0%
Air-quality risk 2/10 · Minimal
- Unhealthy air days now
- 0 days/yr
- Unhealthy air days in 30 yrs
- 1 days/yr
Risk factors via First Street. Map © Google.
Why this score? — see what drove the F grade
The composite is a weighted blend of 9 inputs, each scored 0–100. Each bar is that input's sub-score; the figure is the points it added to the 100-point composite (weight × sub-score).
- Cash flow +13.0/30.0
- DSCR +3.9/10.0
- Schools +3.6/10.0
- 1% rule +3.3/10.0
- Livability +2.8/5.0
- Rent growth +2.5/5.0
- Condition / age +2.5/5.0
- ARV discount +0.0/15.0
- Appreciation +0.0/10.0
$199,900
🖨 Deal sheet 📄 Offer letter ✓ Due diligence
Listing remarks MLS
This lot is ready for your manufactured home Features pad well septic and electric although suitability for your needs may be different. close to town and hwy 710
Key facts
- 7,500 sq ft lot
- Built 2023
- Listed 241 days
Property features AI
Finance
- Other: Lot approximately 7,405 sq ft
- Financial info: Pets allowed with no restrictions
- HOA & community: No association amenities
Exterior
- Parking: No parking details provided
- Security: No security features listed
- Utilities: No utilities listed
- Home design: Manufactured home (modular construction); Single-story; Faces north; Resale condition; Entry via public road
- Construction: Modular construction
- Exterior features: Paved road frontage; Not waterfront
Interior
- Kitchen: Refrigerator included
- Bedrooms: Three main-level bedrooms
- Flooring: Vinyl flooring
- Bathrooms: Two full bathrooms, both on the main level
- Heating & cooling: Central electric heating; Central electric cooling (central air)
- Interior features: No interior feature upgrades listed
- Laundry & utility: No laundry or utility appliances listed
Neighborhood map
What this means for you Summary
Snapshot
- This is a 3-bed/2.0-bath manufactured listed at $200k.
Deal economics
- At list price, monthly cash flow is $-10 ($-115/yr) — negative.
- To cash-flow at today's rent, offer at most $198k (0.8% below list).
- To meet the 1% rule (rent ≥ 1% of price), the offer needs to be $165k (17.3% below list).
- Recommended offer: $165k (17.3% below list) — sets the bar for 1% rule.
- Cap rate 6.2% vs local median 4.1% in Taylor Creek — top-decile yield for the area; either an underpriced asset or a hidden risk that comps aren't pricing in. Stress-test before assuming the spread holds.
Location & tenants
- Location reads 56/100 on livability (#874 in FL) — a working-class tenant base; expect higher turnover. Strengths: cost of living A+, housing A+, crime B+; Watch: amenities F, commute F, employment F.
- Okeechobee (town): math 44% / reading 42% proficiency, ranked #58 of 73 in FL (top 80%) — families likely to look elsewhere, expect single-tenant / working-renter base with shorter leases; 72% free/reduced lunch — lower-income household profile, screen leases tightly.
- Zoned schools: Everglades Elementary School (math 53% / reading 52%, grade C-, #976 of 2,144 statewide, top 46%, 760 students, 76% FRL); Osceola Middle School (math 53% / reading 36%, grade D, #320 of 571 statewide, top 57%, 753 students, 67% FRL); Okeechobee High School (math 30% / reading 42%, grade F, #359 of 667 statewide, top 55%, 1,692 students, 62% FRL) — zoned schools at 68% FRL track the district average.
- Market conditions: 402 active listings in the ZIP; 1 comparable units currently listed for rent nearby; 18 units permitted in Okeechobee County in 2024 (0 in 5+ unit buildings).
- This rent runs 37% of the median local income ($53k/yr) — at the standard rent-burdened threshold; future hikes will face affordability resistance.
Forward outlook
- Local home prices are declining (-3.0%/yr); year-one equity from $1k of loan paydown is wiped out by about $6k of value loss. Plan a longer hold.
- Okeechobee County population projected at -21% by 2050 — secular population decline; favor cash flow + early exit over multi-decade hold.
Negotiation context
- It's been on market 242 days — a 12% lower offer ($176k) is reasonable based on typical stale-listing flexibility.
- 6 sale attempts since 4y ago; this cycle's ask has dropped $35k (15%) from the opening price — seller is motivated, your offer sets the floor, not the list.
- Current owner paid $44k; list at $200k implies a 354% gain — meaningful room to come down on a strong offer.
Risks & watch-outs
- Climate carrying-cost: severe wind risk, 99% chance of damaging wind over 30y; extreme-heat days projected 7→24/yr by 2055 (HVAC capex compounding) — expect insurance premiums to compound above CPI over the hold.
Questions for the listing agent
- What do current leases actually rent for vs. the listed asking? Can we see a recent rent roll and the last 12 months of T-12 income?
- It's been on market 242 days. Have you received any prior offers? Is the seller open to a 17% concession, seller financing, or rate buy-down credit?
- Why hasn't it sold? Are there any deal-killer items the seller is aware of (foundation, flood, title, zoning, code violations)?
- Is there a deadline driving the sale (1031 exchange, divorce, estate, relocation)? That informs how much negotiation room exists.
- Schools are F-rated, which usually means shorter tenancies and higher turnover. Who's the typical renter profile here, and what's been the actual vacancy rate?
- The area grade is low — what's the realistic commute time and amenity access for the typical tenant pool here? Any planned neighborhood developments (good or bad) we should know about?
- This sits on a lake — are riparian / water-frontage rights deeded with the parcel? Any dock permits, shoreline easements, or HOA water-use restrictions?
- What's the documented flood / surge / shoreline-erosion history here (FEMA AND non-FEMA — e.g., storm surge, creek backup, septic-field saturation)?
- Any water-quality or seasonal algae-bloom issues that affect tenant satisfaction or short-term-rental demand?
- What's the average days-on-market for RENTAL listings here right now (not sales)? A rising rental-DOM trend means longer vacancies and softer asking-rent achievability than the comps imply.
- What's the recent tenant-quality profile in this submarket — average credit score on applications, eviction rate, late-payment / NSF rate, and stable-employment percentage? A property-management company in the area should have these aggregated.
- How much new for-sale + rental construction is in the pipeline within 1–3 miles? Heavy new supply typically softens prices + rents 12–24 months out; constrained supply supports both.
Investment metrics
- 1% rule
- 0.83% ✗
- Cap rate
- 6.24%
- Cash-on-cash
- -0.21%
- DSCR
- 0.99
- GRM
- 10.1
CMA / ARV
- ARV (on-the-fly)
- $134,904
- Comps found
- 3
Show comp detail 3 sales within ~0.75 mi
| Address | Dist | Beds/Ba | Sqft | Sold | Price | $/sf | Match |
|---|---|---|---|---|---|---|---|
| 9237 SE 60th Dr | 0.16mi | 2/2.0 (-1) | 902 (-2%) | 17mo | $80,000 | $89 | 69 |
| 8672 SE 59th Dr | 0.60mi | 2/2.0 (-1) | 926 (+0%) | 5mo | $176,000 | $190 | 62 |
| 8815 SE 57th Dr | 0.54mi | 3/2.0 | 938 (+2%) | 13mo | $137,000 | $146 | 62 |
Match score weights: distance 35% · size 25% · config 20% · recency 20%. Top-matched comps best support the ARV.
Projected returns pro-forma
-3.0% appreciation · 3.0% rent growth · sell at horizon
- IRR
- -16.7%
- Equity multiple
- 0.41×
- Total profit
- $-33,020
- Equity at exit
- $29,806
- IRR
- -8.5%
- Equity multiple
- 0.47×
- Total profit
- $-29,604
- Equity at exit
- $17,284
Cash invested: $55,972 (down + closing). Projections, not guarantees.
Landlord ↔ Tenant lean methodology
- Overall (STATE)
- 87 Strongly Landlord-Friendly
- State Florida
- 87 Strongly Landlord-Friendly · R+3
- County
- — inherits STATE
- City
- — inherits STATE
ZIP-level market 34974
- Home prices YoY
- -15.6%
- Active inventory
- 402
- Price-to-rent
- 10.1×
Monthly cashflow live
- Estimated rent
- $1,654 medium interval (Pro) →
- Mortgage (P&I)
- −$1,048
- Tax from tax record
- −$185 /mo · $2,214/yr
- Insurance
- −$83
- HOA
- −$0
- Vacancy / Maint / Mgmt
- −$347
- Net cashflow
- $-10
Break-even live
UW: 25.0% down · 7.5% · 30yr · 1.5% tax · 5.0% vac · 8.0% maint · 8.0% mgmt
Financing live
Cash to close
- Down payment
- $49,975
- Closing costs
- $5,997
- Reserves months
- —
- Total cash needed
- —
Loan-product check · same deal, 3 products live
Conventional
25% down · 7.5% · 30yr
- Down + closing
- —
- Monthly P&I
- —
- Monthly cashflow
- —
- DSCR
- —
- Eligible?
- —
Personal DTI + credit; lowest rate.
DSCR
20% down · 8.5% · 30yr
- Down + closing
- —
- Monthly P&I
- —
- Monthly cashflow
- —
- DSCR
- —
- Eligible?
- —
No personal income docs; deal must DSCR.
Hard money
10% down · 12.0% · 12mo
- Down + closing
- —
- Monthly P&I
- —
- Monthly cashflow
- —
- DSCR
- —
- Eligible?
- —
Short-term bridge; refi at stabilization.
Rent comps 1 comps
| Address | Beds | Baths | Sqft | Rent | $/sqft | DOM | Units | Dist |
|---|---|---|---|---|---|---|---|---|
| 9301 SE 61st Dr Okeechobee, FL | 2.0 | 2.0 | 896 | $1,550 | $1.73 | 23d | 1 | 0.16mi |
Listing history 38 events
-
2026-06-19days on market $199,900 Active 242 DOM
-
2026-06-18days on market $199,900 Active 241 DOM
-
2026-06-17days on market $199,900 Active 240 DOM
-
2026-06-16days on market $199,900 Active 239 DOM
-
2026-06-15days on market $199,900 Active 238 DOM
-
2026-06-14days on market $199,900 Active 236 DOM
-
2026-06-10days on market $199,900 Active 233 DOM
-
2026-06-09days on market $199,900 Active 232 DOM
-
2026-06-08days on market $199,900 Active 231 DOM
-
2026-06-07days on market $199,900 Active 230 DOM
-
2026-06-05days on market $199,900 Active 227 DOM
-
2026-06-03days on market $199,900 Active 226 DOM
-
2026-06-02days on market $199,900 Active 225 DOM
-
2026-06-01days on market $199,900 Active 224 DOM
-
2026-05-31days on market $199,900 Active 223 DOM
-
2026-05-30days on market $199,900 Active 222 DOM
-
2026-03-06status Active
-
2026-03-03historical
-
2026-01-31price $199,900
-
2026-01-30status Active
-
2025-12-29historical
-
2025-10-27price $204,900
-
2025-10-21price $209,900
-
2025-10-13price $224,900
-
2025-09-15$235,000 Active
-
2025-09-02historical $235,000
-
2024-04-08historical
-
2024-03-23$212,000 Active
-
2023-01-26status Pending 164-char remark
Show marketing remark (164 chars)
This lot is ready for your manufactured home Features pad well septic and electric although suitability for your needs may be different. close to town and hwy 710
-
2023-01-18soldstatus $44,000 Closed 164-char remark
Show marketing remark (164 chars)
This lot is ready for your manufactured home Features pad well septic and electric although suitability for your needs may be different. close to town and hwy 710
-
2022-11-28price $44,900 164-char remark
Show marketing remark (164 chars)
This lot is ready for your manufactured home Features pad well septic and electric although suitability for your needs may be different. close to town and hwy 710
-
2022-10-29$55,000 Active 164-char remark
Show marketing remark (164 chars)
This lot is ready for your manufactured home Features pad well septic and electric although suitability for your needs may be different. close to town and hwy 710
-
2022-06-02soldstatus $23,000 Closed
-
2022-05-03status Pending
-
2022-03-31$35,000 Active
-
2017-07-10soldstatus $8,000
-
1994-12-01soldstatus $28,000
-
1990-02-01soldstatus $21,000
ⓘ Source: listings_history table (triggers on properties + properties_extension) + one-shot
backfill from property_details.listing_events for pre-trigger history.
Tax reassessment forecast FL · Resets to sale price
- Current annual tax
- $2,214 · $185/mo
- Projected year-2 tax
- $2,214 · $185/mo
- Expected delta
- $0/yr ($0/mo · 0.0%)
ⓘ Screening estimate from a state-policy table — verify with the county assessor before closing.
Climate risk First Street
- Flood 1/10 Low FEMA zone X (unshaded) · 0% chance over 30 yrs
- Wildfire 3/10 Moderate
- Heat 9/10 Extreme 7 d/yr ≥107°F today · 24 d/yr by 30 yrs out
- Wind 10/10 Extreme 99% chance of damaging wind over 30 yrs
- Air quality 2/10 Low 0 unhealthy d/yr today · 1 by 30 yrs out
Nearby sold comps map
Loading sold comps map…
Walkable amenities ~0.75 mi
Loading nearby amenities…
Taxation est. · year 1
- Rental income
- $19,845
- − Mortgage interest
- −$11,198
- − Property taxes
- −$2,214
- − Insurance
- −$1,000
- − Repairs & maintenance
- −$1,588
- − Management
- −$1,588
- − Depreciation
- −$5,815
- Taxable loss
- −$3,556
- Est. tax savings @ 24.0%
- +$854
- After-tax cash flow
- $738/yr
For passive investors: Depreciation is non-cash, so a rental often shows a tax loss while cash-flowing — sheltering income. Rental losses are passive: they offset passive income freely, and up to $25,000/yr can offset ordinary (W-2) income if you actively participate and your MAGI is under $100k (phasing out to $0 by $150k); unused losses carry forward. On sale, claimed depreciation is recaptured at up to 25%, and gains may owe capital-gains tax (a 1031 exchange can defer both). Figures are a year-1 estimate at your 24.0% rate — not tax advice; consult a CPA.
Schools (NCES district)
- District
- Okeechobee
- NCES district ID
- 1201410
- Math proficiency
- 44% ▼ -12.00%
- Reading proficiency
- 42% ▼ -4.00%
- Median HH income
- $36,710
- Composite
- 35.73/100
- National rank
- #4855
- State rank
- #58 of 73 in FL
Livability — Taylor Creek
- Score
- 56/100
- State rank
- #874
- US rank
- #23017
Category grades
Schools grade is shown separately in the Schools card above.
Census & demographics
- County
- Okeechobee County · 23,975 people
- Metro
- Okeechobee, FL
- Population (ZIP)
- 23,975
- Household income
- $53,013
- Rent vs Own
- Severe rent burden
- 399.0
Population outlook (Okeechobee County) Hauer SSP2
- Today (2025)
- 37,273 people
- By 2030
- 35,885 · -3.7%
- By 2040
- 32,931 · -11.6%
- By 2050
- 29,433 · -21.0%
- By 2075
- 19,607 · -47.4%
- By 2100
- 11,814 · -68.3%
Race, ethnicity, and origin ACS 2023
- Neighborhood character
- Predominantly White (74%)
- Race & ethnicity
- White 74% Hispanic / Latino 19% Two or more races 8% Asian 2% Black 2% Native American 1%
- Hispanic origin (detail)
- Mexican 12% Puerto Rican 1% Cuban 2%
- Common ancestry
- Lithuanian 2% Iranian 2% Italian 2%
- Foreign-born
- 11% · Canada, Jamaica
- Languages at home
- 81% English-only · Spanish 16% French/Haitian/Cajun 1% Other Indo-European 1%
Political lean MEDSL · Okeechobee
- 2024 margin
- Solid R (+53.8) · D 22.9% · R 76.7%
- 2008→2024 swing
- -34.6pp toward R · 2008: -19.2pp · 2024: -53.8pp
- All cycles
- 2024: R+53.8 2020: R+44.4 2016: R+39.5 2012: R+20.0 2008: R+19.2
Not yet ingested
- Civics
- —
Market trends
- HPI YoY
- ▼ -64.47%
- Current HPI
- 348.6692
- Rent YoY
- —
- Metro
- Okeechobee, FL
- State GDP YoY
- ▲ 3.28%
- F500 in state
- 36
Industry mix (Fortune 500 HQ in FL)
| Industry | F500 HQs | Revenue |
|---|---|---|
| Industrial Technology | 2 | $29B |
|
||
| Insurance | 2 | $17B |
|
||
| Retail | 1 | $60B |
|
||
| Technology Distribution | 1 | $58B |
|
||
| Homebuilding | 1 | $35B |
|
||
| Technology Manufacturing | 1 | $35B |
|
||
Price history
+851.9% since first listed22 events — show timeline
- 2026-03-06 Relisted — Beaches MLS
- 2026-03-03 Listing Removed — Beaches MLS
- 2026-01-31 Price Changed $199,900 Beaches MLS
- 2026-01-30 Relisted — Beaches MLS
- 2025-12-29 Listing Removed — Beaches MLS
- 2025-10-27 Price Changed $204,900 Beaches MLS
- 2025-10-21 Price Changed $209,900 Beaches MLS
- 2025-10-13 Price Changed $224,900 Beaches MLS
- 2025-09-15 Listed $235,000 Beaches MLS
- 2025-09-02 Coming Soon $235,000 Beaches MLS
- 2024-04-08 Listing Removed — Beaches MLS
- 2024-03-23 Listed $212,000 Beaches MLS
- 2023-01-26 Pending — Beaches MLS
- 2023-01-18 Sold (MLS) $44,000 Beaches MLS
- 2022-11-28 Price Changed $44,900 Beaches MLS
- 2022-10-29 Listed $55,000 Beaches MLS
- 2022-06-02 Sold (MLS) $23,000 Beaches MLS
- 2022-05-03 Pending — Beaches MLS
- 2022-03-31 Listed $35,000 Beaches MLS
- 2017-07-10 Sold (Public Records) $8,000 Public Records
- 1994-12-01 Sold (Public Records) $28,000 Public Records
- 1990-02-01 Sold (Public Records) $21,000 Public Records
Property tax history
+25.8%/yrLatest (2025): $2,214 · +544.0% YoY. Source: county tax records.
Cash-flow waterfall
monthlySold comps — $/sqft
last 12 mo · ≤1 miLoading sold comps…