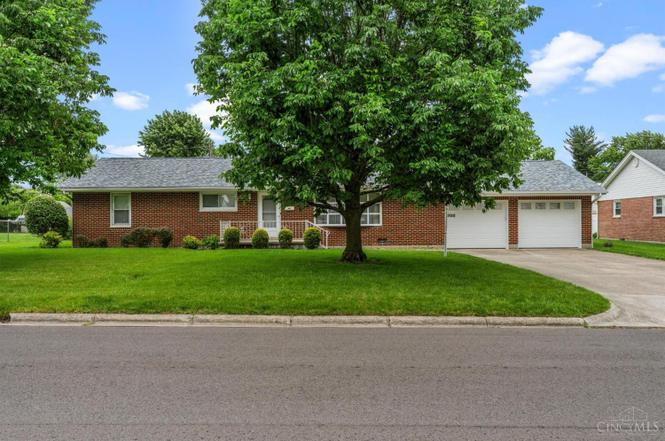
720 Kathryn Dr · Wilmington, OH
Flood risk 1/10 · Minimal
- FEMA flood zone
- X (unshaded)
- Chance of flooding over 30 yrs
- 0.0%
- Est. flood insurance / yr
- $507 – $1,088
Fire risk 1/10 · Minimal
- Est. fire insurance / yr
- $713 – $1,323
Heat risk 3/10 · Minor
- Hot days now (above 99°F)
- 7 days/yr
- Hot days in 30 yrs
- 19 days/yr
Wind risk 2/10 · Minimal
- Chance of severe wind over 30 yrs
- 1.0%
Air-quality risk 2/10 · Minimal
- Unhealthy air days now
- 1 days/yr
- Unhealthy air days in 30 yrs
- 2 days/yr
Risk factors via First Street. Map © Google.
Why this score? — see what drove the C- grade
The composite is a weighted blend of 9 inputs, each scored 0–100. Each bar is that input's sub-score; the figure is the points it added to the 100-point composite (weight × sub-score).
- Cash flow +20.1/30.0
- ARV discount +7.4/15.0
- DSCR +6.4/10.0
- 1% rule +4.4/10.0
- Schools +3.9/10.0
- Livability +3.9/5.0
- Rent growth +2.5/5.0
- Condition / age +2.5/5.0
- Appreciation +0.0/10.0
$239,000
🖨 Deal sheet 📄 Offer letter ✓ Due diligence
Listing remarks MLS
Swoop in and grab this gem! Step into a spacious living room with a stone gas fireplace and a picture window. The oversized kitchen offers plenty of space for a farm table or an island, and the dining area opens to a beautiful fenced backyard. Three generously sized bedrooms and two full baths complete this mid-century charmer. The roof is brand new, and the furnace was replaced in 2023. Enjoy a two-car extra-large garage plus a shed for all your storage needs. Interior has been freshly painted!
Key facts
- Shed for storage
- Oversized kitchen
- Stone gas fireplace
Tags
Property features AI
Finance
- Other: Lot is less than 0.5 acre (about 0.283 acres, roughly 94 x 131)
- Financial info: Lease not considered
- HOA & community: No HOA
Exterior
- Parking: Oversized attached garage with 2 garage spaces; Concrete driveway
- Security: No security details provided
- Utilities: Public water; Public sewer; Natural gas
- Home design: Ranch-style single family home; One level; Block foundation
- Construction: Brick construction; Shingle roof
- Exterior features: Patio; Porch; Metal fencing; Shed on property
Interior
- Kitchen: Kitchen approximately 11 x 15; Oven/Range; Refrigerator; Dining room with walkout
- Bedrooms: Three bedrooms total; Primary bedroom on level 1, about 12 x 14; Second bedroom on level 1, about 10 x 10; Third bedroom on level 1, about 12 x 13
- Flooring: No flooring details provided
- Bathrooms: Two full bathrooms on level 1; Primary bathroom with shower
- Heating & cooling: Forced air heating (gas); Central air conditioning; Gas water heating
- Interior features: Fireplace in living room (gas); Crawl basement; Six total rooms
- Laundry & utility: No specific laundry details provided
Neighborhood map
What this means for you Summary
Snapshot
- This is a 3-bed/1.5-bath single-family listed at $239k.
Deal economics
- At list price, monthly cash flow is $296 ($4k/yr) — positive.
- The deal already cash-flows at list — no discount required.
- To meet the 1% rule (rent ≥ 1% of price), the offer needs to be $225k (5.9% below list).
- Recommended offer: $225k (5.9% below list) — sets the bar for 1% rule.
- Cap rate 7.8% vs local median 6.2% in Wilmington — meaningfully above typical; check what's discounted (condition, days-on-market, listing class) to confirm the premium yield is real.
Location & tenants
- Location reads 77/100 on livability (#202 in OH, #3,127 nationally) — a middle-class / working-renter tenant base. Strengths: cost of living A+, housing A+, health & safety A+; Watch: schools C-, amenities D, commute F.
- Wilmington City (town): math 42% / reading 51% proficiency, ranked #492 of 656 in OH (top 75%) — families likely to look elsewhere, expect single-tenant / working-renter base with shorter leases.
- Market conditions: 107 active listings in the ZIP; 2 comparable units currently listed for rent nearby; 119 units permitted in Clinton County in 2024 (0 in 5+ unit buildings).
- This rent runs 38% of the median local income ($70k/yr) — at the standard rent-burdened threshold; future hikes will face affordability resistance.
Forward outlook
- Local home prices are declining (-3.0%/yr); year-one equity from $2k of loan paydown is wiped out by about $7k of value loss. Plan a longer hold.
- Clinton County population projected at -12% by 2050 — secular population decline; favor cash flow + early exit over multi-decade hold.
Negotiation context
- Only 8 days on market — expect competitive offers; lowballing is unlikely to land.
- 3 sale attempts since 23y ago with the ask held roughly flat each time — persistent listings suggest the price (not the market) is what's stuck; bring a comps-based counter.
- Current owner paid $112k; list at $239k implies a 112% gain — meaningful room to come down on a strong offer.
Questions for the listing agent
- Built in 1962 — when were the roof, HVAC, electrical panel, plumbing, and water heater last replaced?
- Is there a deadline driving the sale (1031 exchange, divorce, estate, relocation)? That informs how much negotiation room exists.
- What's the average days-on-market for RENTAL listings here right now (not sales)? A rising rental-DOM trend means longer vacancies and softer asking-rent achievability than the comps imply.
- What's the recent tenant-quality profile in this submarket — average credit score on applications, eviction rate, late-payment / NSF rate, and stable-employment percentage? A property-management company in the area should have these aggregated.
- How much new for-sale + rental construction is in the pipeline within 1–3 miles? Heavy new supply typically softens prices + rents 12–24 months out; constrained supply supports both.
Investment metrics
- 1% rule
- 0.94% ✗
- Cap rate
- 7.78%
- Cash-on-cash
- 5.30%
- DSCR
- 1.24
- GRM
- 8.9
CMA / ARV
- ARV (on-the-fly)
- $238,221
- Comps found
- 12
Show comp detail 12 sales within ~0.75 mi
| Address | Dist | Beds/Ba | Sqft | Sold | Price | $/sf | Match |
|---|---|---|---|---|---|---|---|
| 269 Virginia Cir | 0.17mi | 3/1.5 | 1,408 (+2%) | 2mo | $260,000 | $185 | 87 |
| 284 Virginia Cir | 0.21mi | 3/1.0 | 1,400 (+2%) | 7mo | $195,000 | $139 | 80 |
| 302 Lorish Ave | 0.13mi | 3/2.0 | 1,476 (+7%) | 2mo | $265,000 | $180 | 78 |
| 458 Virginia Cir | 0.21mi | 3/2.0 | 1,352 (-2%) | 9mo | $195,000 | $144 | 78 |
| 793 Hiatt Ave | 0.26mi | 3/2.0 | 1,302 (-5%) | 7mo | $260,000 | $200 | 71 |
| 1216 N St Rt 134 | 0.53mi | 3/1.0 | 1,424 (+3%) | 2mo | $197,500 | $139 | 66 |
| 77 E Kentucky Ave | 0.45mi | 3/2.5 | 1,442 (+5%) | 9mo | $279,900 | $194 | 60 |
| 261 A St | 0.63mi | 3/2.0 | 1,317 (-4%) | 4mo | $210,000 | $159 | 58 |
| 328 A St | 0.70mi | 3/2.0 | 1,400 (+2%) | 6mo | $254,500 | $182 | 58 |
| 84 E Ruby Ave | 0.35mi | 3/2.0 | 1,232 (-10%) | 8mo | $140,000 | $114 | 57 |
| 50 E Kentucky Ave | 0.56mi | 3/2.5 | 1,442 (+5%) | 9mo | $250,000 | $173 | 55 |
| 299 Florence Ave | 0.38mi | 2/2.0 (-1) | 1,500 (+9%) | 10mo | $220,000 | $147 | 52 |
Match score weights: distance 35% · size 25% · config 20% · recency 20%. Top-matched comps best support the ARV.
Projected returns pro-forma
-3.0% appreciation · 3.0% rent growth · sell at horizon
- IRR
- -8.1%
- Equity multiple
- 0.70×
- Total profit
- $-19,971
- Equity at exit
- $35,636
- IRR
- 1.4%
- Equity multiple
- 1.10×
- Total profit
- $6,568
- Equity at exit
- $20,664
Cash invested: $66,920 (down + closing). Projections, not guarantees.
Landlord ↔ Tenant lean methodology
- Overall (STATE)
- 73 Landlord-Friendly
- State Ohio
- 73 Landlord-Friendly · R+6
- County
- — inherits STATE
- City
- — inherits STATE
ZIP-level market 45177
- Active inventory
- 107
- Price-to-rent
- 8.9×
Monthly cashflow live
- Estimated rent
- $2,250 medium interval (Pro) →
- Mortgage (P&I)
- −$1,253
- Tax from tax record
- −$129 /mo · $1,547/yr
- Insurance
- −$100
- HOA
- −$0
- Vacancy / Maint / Mgmt
- −$472
- Net cashflow
- $296
Break-even live
UW: 25.0% down · 7.5% · 30yr · 1.5% tax · 5.0% vac · 8.0% maint · 8.0% mgmt
Financing live
Cash to close
- Down payment
- $59,750
- Closing costs
- $7,170
- Reserves months
- —
- Total cash needed
- —
Loan-product check · same deal, 3 products live
Conventional
25% down · 7.5% · 30yr
- Down + closing
- —
- Monthly P&I
- —
- Monthly cashflow
- —
- DSCR
- —
- Eligible?
- —
Personal DTI + credit; lowest rate.
DSCR
20% down · 8.5% · 30yr
- Down + closing
- —
- Monthly P&I
- —
- Monthly cashflow
- —
- DSCR
- —
- Eligible?
- —
No personal income docs; deal must DSCR.
Hard money
10% down · 12.0% · 12mo
- Down + closing
- —
- Monthly P&I
- —
- Monthly cashflow
- —
- DSCR
- —
- Eligible?
- —
Short-term bridge; refi at stabilization.
Rent comps 2 comps
| Address | Beds | Baths | Sqft | Rent | $/sqft | DOM | Units | Dist |
|---|---|---|---|---|---|---|---|---|
| 978 N South St Wilmington, OH | 3.0 | 2.5 | 1657 | $2,200 | $1.33 | 3d | 1 | 0.51mi |
| 996 N South St Wilmington, OH | 3.0 | 2.5 | 1657 | $2,300 | $1.39 | 44d | 1 | 0.51mi |
Listing history 6 events
-
2026-06-18days on market $239,000 Active 8 DOM
-
2026-06-17days on market $239,000 Active 7 DOM
-
2026-06-16days on market $239,000 Active 6 DOM
-
2026-06-15days on market $239,000 Active 5 DOM
-
2026-06-14remarks 465-char remark
-
2026-06-14$239,000 Active 3 DOM
ⓘ Source: listings_history table (triggers on properties + properties_extension) + one-shot
backfill from property_details.listing_events for pre-trigger history.
Tax reassessment forecast OH · Partial reset (capped growth)
- Current annual tax
- $1,547 · $129/mo
- Projected year-2 tax
- $2,638 · $220/mo
- Expected delta
- +$1,090/yr (+$91/mo · 70.5%)
ⓘ Screening estimate from a state-policy table — verify with the county assessor before closing.
Climate risk First Street
- Flood 1/10 Low FEMA zone X (unshaded) · 0% chance over 30 yrs
- Wildfire 1/10 Low
- Heat 3/10 Moderate 7 d/yr ≥99°F today · 19 d/yr by 30 yrs out
- Wind 2/10 Low 100% chance of damaging wind over 30 yrs
- Air quality 2/10 Low 1 unhealthy d/yr today · 2 by 30 yrs out
Nearby sold comps map
Loading sold comps map…
Walkable amenities ~0.75 mi
Loading nearby amenities…
Taxation est. · year 1
- Rental income
- $27,000
- − Mortgage interest
- −$13,388
- − Property taxes
- −$1,547
- − Insurance
- −$1,195
- − Repairs & maintenance
- −$2,160
- − Management
- −$2,160
- − Depreciation
- −$6,953
- Taxable loss
- −$403
- Est. tax savings @ 24.0%
- +$97
- After-tax cash flow
- $3,644/yr
For passive investors: Depreciation is non-cash, so a rental often shows a tax loss while cash-flowing — sheltering income. Rental losses are passive: they offset passive income freely, and up to $25,000/yr can offset ordinary (W-2) income if you actively participate and your MAGI is under $100k (phasing out to $0 by $150k); unused losses carry forward. On sale, claimed depreciation is recaptured at up to 25%, and gains may owe capital-gains tax (a 1031 exchange can defer both). Figures are a year-1 estimate at your 24.0% rate — not tax advice; consult a CPA.
Schools (NCES district)
- District
- Wilmington City
- NCES district ID
- 3904511
- Math proficiency
- 42% ▼ -16.00%
- Reading proficiency
- 51% ▼ -6.00%
- Median HH income
- $43,201
- Composite
- 39.2/100
- National rank
- #4020
- State rank
- #492 of 656 in OH
Livability — Wilmington
- Score
- 77/100
- State rank
- #202
- US rank
- #3127
Category grades
Schools grade is shown separately in the Schools card above.
Census & demographics
- Census place
- Wilmington, OH
- County
- Clinton · 46,911 people
- Population (ZIP)
- 22,442
- Household income
- $70,483
- Rent vs Own
- Severe rent burden
- 9.5
Population outlook (Clinton County) Hauer SSP2
- Today (2025)
- 41,352 people
- By 2030
- 40,831 · -1.3%
- By 2040
- 39,049 · -5.6%
- By 2050
- 36,408 · -12.0%
- By 2075
- 29,652 · -28.3%
- By 2100
- 20,736 · -49.9%
Race, ethnicity, and origin ACS 2023
- Neighborhood character
- Predominantly White (91%)
- Race & ethnicity
- White 91% Two or more races 3% Black 3% Hispanic / Latino 2% Asian 1%
- Common ancestry
- Lithuanian 2% Slovak 2% Romanian 2%
- Foreign-born
- 3% · Canada, Jamaica
- Languages at home
- 97% English-only · Spanish 1% Other Asian/Pacific 1%
Political lean MEDSL · Clinton
- 2024 margin
- Solid R (+54.6) · D 22.3% · R 76.9%
- 2008→2024 swing
- -24.3pp toward R · 2008: -30.3pp · 2024: -54.6pp
- All cycles
- 2024: R+54.6 2020: R+52.6 2016: R+52.6 2012: R+35.2 2008: R+30.3
Not yet ingested
- Civics
- —
Market trends
- HPI YoY
- ▼ -150.35%
- Current HPI
- 238.9182
- Rent YoY
- —
- Metro
- —
- State GDP YoY
- ▲ 1.98%
- F500 in state
- 48
Industry mix (Fortune 500 HQ in OH)
| Industry | F500 HQs | Revenue |
|---|---|---|
| Insurance | 3 | $145B |
|
||
| Industrial Machinery | 3 | $49B |
|
||
| Financial Services | 3 | $24B |
|
||
| Consumer Goods | 2 | $93B |
|
||
| Aerospace / Defense | 2 | $47B |
|
||
| Utilities | 2 | $33B |
|
||
Price history
+189.7% since first listed6 events — show timeline
- 2026-06-09 Listed $239,000 Dayton MLS
- 2026-06-09 Listed $239,000 Cincy MLS
- 2003-06-05 Sold (Public Records) $112,500 Public Records
- 2003-05-30 Sold (MLS) $112,500 Cincy MLS
- 2003-04-23 Listed $119,500 Cincy MLS
- 1991-09-20 Sold (Public Records) $82,500 Public Records
Property tax history
+4.7%/yrLatest (2025): $1,547 · -4.1% YoY. Source: county tax records.
Cash-flow waterfall
monthlySold comps — $/sqft
last 12 mo · ≤1 miLoading sold comps…