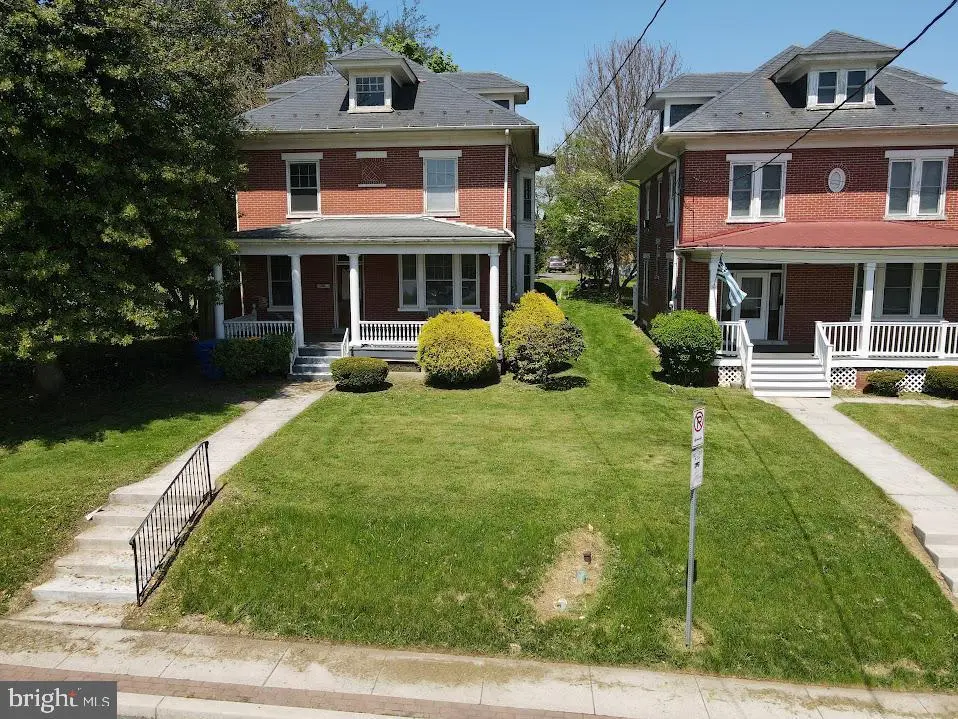
71 W Frederick St · Millersville, PA
Flood risk 1/10 · Minimal
- FEMA flood zone
- X (unshaded)
- Chance of flooding over 30 yrs
- 0.0%
- Est. flood insurance / yr
- $473 – $860
Fire risk 1/10 · Minimal
- Est. fire insurance / yr
- $511 – $949
Heat risk 6/10 · Moderate
- Hot days now (above 102°F)
- 7 days/yr
- Hot days in 30 yrs
- 15 days/yr
Wind risk 4/10 · Minor
- Chance of severe wind over 30 yrs
- 15.0%
Air-quality risk 3/10 · Minor
- Unhealthy air days now
- 2 days/yr
- Unhealthy air days in 30 yrs
- 6 days/yr
Risk factors via First Street. Map © Google.
Why this score? — see what drove the C- grade
The composite is a weighted blend of 9 inputs, each scored 0–100. Each bar is that input's sub-score; the figure is the points it added to the 100-point composite (weight × sub-score).
- Cash flow +15.7/30.0
- ARV discount +15.0/15.0
- 1% rule +5.1/10.0
- Schools +5.1/10.0
- DSCR +4.8/10.0
- Livability +4.2/5.0
- Rent growth +2.5/5.0
- Condition / age +2.5/5.0
- Appreciation +0.0/10.0
$250,000
🖨 Deal sheet 📄 Offer letter ✓ Due diligence
Listing remarks MLS
Circa 1900 4 square design - slate roof, brick exterior. Beautiful, rarely found, Chestnut woodwork & trim throughtout. 2 story barn for pakring & storage plus an inground pool. Solid constrution, plaster walls & central A/C. Gas hookup is available. Wood floors under carpet.
Key facts
- In-ground pool
- Screened-in porch
- Spacious kitchen
Tags
Property features AI
Exterior
- Parking: Detached garage with additional storage (1 garage space); One off-street parking space (2 total parking spaces)
- Utilities: Public water; Public sewer
- Home design: Detached property; Slate roof
- Construction: Brick and masonry construction; Permanent foundation; Garage(s) on property
- Exterior features: In-ground personal pool; Municipal trash service; Not in a federal flood zone
Interior
- Kitchen: Double oven; Cooktop; Range hood
- Bedrooms: Four bedrooms on the upper level
- Flooring: Hardwood; Vinyl
- Bathrooms: One full bathroom (upper level); One half bathroom (main level)
- Heating & cooling: Forced air heating; Oil-fired heat; Electric hot water
- Interior features: Attic; Tub with shower; Formal separate dining room; Wood floors
- Laundry & utility: Main-floor laundry
Neighborhood map
What this means for you Summary
Snapshot
- This is a 4-bed/1.0-bath single-family listed at $250k.
Deal economics
- At list price, monthly cash flow is $111 ($1k/yr) — positive.
- The deal already cash-flows at list — no discount required.
- Meets the 1% rule at list price ($3k rent vs $250k).
- Recommended offer: $242k (3.0% below list) — sets the bar for market timing.
- Cap rate 6.8% vs local median 3.0% in Millersville — top-decile yield for the area; either an underpriced asset or a hidden risk that comps aren't pricing in. Stress-test before assuming the spread holds.
Location & tenants
- Location reads 84/100 on livability (#101 in PA, #728 nationally) — a professional / high-income tenant draw. Strengths: crime A+, cost of living A+, housing A+; Watch: amenities D-, commute F.
- Penn Manor SD (suburban): math 52% / reading 65% proficiency, ranked #80 of 539 in PA (top 15%) — acceptable for families but not a draw, mixed tenant base, ~2y average lease.
- Zoned schools: Penn Manor Hs (math 82% / reading 30%, grade C, #90 of 437 statewide, top 21%, 1,783 students, 43% FRL) — zoned schools average 43% FRL vs 27% district-wide (16 pts higher); higher-poverty schools than district average — tighter screening recommended.
- Market conditions: 50 active listings in the ZIP; 3 comparable units currently listed for rent nearby; rentals at typical pace (median 14d on market — plan ~3-4 weeks tenant-placement turnaround); 1,093 units permitted in Lancaster County in 2024 (201 in 5+ unit buildings).
- This rent runs 44% of the median local income ($69k/yr) — at the standard rent-burdened threshold; future hikes will face affordability resistance.
Forward outlook
- Local home prices are declining (-3.0%/yr); year-one equity from $2k of loan paydown is wiped out by about $8k of value loss. Plan a longer hold.
- Lancaster County population projected at +5% by 2050 — modest demand growth; plan on rents tracking national, not racing it.
Negotiation context
- It's been on market 41 days — a 3% lower offer ($242k) is reasonable based on typical stale-listing flexibility.
- 2 sale attempts since 13y ago with the ask held roughly flat each time — persistent listings suggest the price (not the market) is what's stuck; bring a comps-based counter.
- Current owner paid $198k; 26% above their basis — modest negotiation headroom, anchor on the comps not their cost.
Risks & watch-outs
- Watch-outs: built in 1900 — expect roof / HVAC / electrical / plumbing capex.
- Climate carrying-cost: extreme-heat days projected 7→15/yr by 2055 (HVAC capex compounding) — expect insurance premiums to compound above CPI over the hold.
Questions for the listing agent
- It's been on market 41 days. Have you received any prior offers? Is the seller open to a 3% concession, seller financing, or rate buy-down credit?
- Built in 1900 — when were the roof, HVAC, electrical panel, plumbing, and water heater last replaced?
- Is there a deadline driving the sale (1031 exchange, divorce, estate, relocation)? That informs how much negotiation room exists.
- Schools are A-rated — typically a magnet for longer-tenancy family renters. What's the average tenant stay here, and is there a school-zone premium baked into asking?
- What's the average days-on-market for RENTAL listings here right now (not sales)? A rising rental-DOM trend means longer vacancies and softer asking-rent achievability than the comps imply.
- What's the recent tenant-quality profile in this submarket — average credit score on applications, eviction rate, late-payment / NSF rate, and stable-employment percentage? A property-management company in the area should have these aggregated.
- How much new for-sale + rental construction is in the pipeline within 1–3 miles? Heavy new supply typically softens prices + rents 12–24 months out; constrained supply supports both.
Investment metrics
- 1% rule
- 1.01% ✓
- Cap rate
- 6.83%
- Cash-on-cash
- 1.91%
- DSCR
- 1.08
- GRM
- 8.2
CMA / ARV
- ARV (median comp)
- $341,088
- List price
- $250,000
- Delta
- -26.71%
- Verdict
- UNDERPRICED
- Comps
- 20 within 1.0 mi
Show comp detail 12 sales within ~0.75 mi
| Address | Dist | Beds/Ba | Sqft | Sold | Price | $/sf | Match |
|---|---|---|---|---|---|---|---|
| 183 W Frederick St | 0.26mi | 4/2.0 | 1,718 (-7%) | 10mo | $100,000 | $58 | 64 |
| 118 W Frederick St | 0.09mi | 5/2.0 (+1) | 1,578 (-15%) | 1mo | $374,500 | $237 | 62 |
| 134 Elizabeth St | 0.21mi | 3/1.5 (-1) | 2,030 (+10%) | 8mo | $280,000 | $138 | 60 |
| 173 W Frederick St | 0.24mi | 3/1.5 (-1) | 1,648 (-11%) | 5mo | $335,000 | $203 | 60 |
| 50 Manor Oaks Dr | 0.74mi | 4/2.0 | 1,860 (+1%) | 9mo | $385,000 | $207 | 53 |
| 143 N Duke St | 0.44mi | 4/2.0 | 1,650 (-11%) | 11mo | $380,000 | $230 | 48 |
| 34 Manor Oaks Dr | 0.65mi | 3/2.0 (-1) | 1,776 (-4%) | 12mo | $350,000 | $197 | 44 |
| 56 Brenner St | 0.65mi | 3/2.0 (-1) | 2,031 (+10%) | 1mo | $368,000 | $181 | 43 |
| 19 Manor Oaks Dr | 0.58mi | 3/2.5 (-1) | 1,708 (-8%) | 10mo | $400,000 | $234 | 41 |
| 455 N Duke St | 0.72mi | 3/2.0 (-1) | 1,958 (+6%) | 14mo | $360,000 | $184 | 36 |
| 180 W Charlotte St | 0.52mi | 3/1.5 (-1) | 1,571 (-15%) | 11mo | $360,000 | $229 | 34 |
| 11 Landis Ave | 0.72mi | 3/2.5 (-1) | 2,040 (+10%) | 11mo | $320,000 | $157 | 29 |
Match score weights: distance 35% · size 25% · config 20% · recency 20%. Top-matched comps best support the ARV.
Projected returns pro-forma
-3.0% appreciation · 3.0% rent growth · sell at horizon
- IRR
- -13.2%
- Equity multiple
- 0.52×
- Total profit
- $-33,275
- Equity at exit
- $37,276
- IRR
- -4.2%
- Equity multiple
- 0.72×
- Total profit
- $-19,273
- Equity at exit
- $21,615
Cash invested: $70,000 (down + closing). Projections, not guarantees.
Landlord ↔ Tenant lean methodology
- Overall (STATE)
- 62 Landlord-Friendly
- State Pennsylvania
- 62 Landlord-Friendly · EVEN
- County
- — inherits STATE
- City
- — inherits STATE
ZIP-level market 17551
- Home prices YoY
- -24.9%
- Active inventory
- 50
- Price-to-rent
- 8.2×
Monthly cashflow live
- Estimated rent
- $2,535 medium interval (Pro) →
- Mortgage (P&I)
- −$1,311
- Tax from tax record
- −$476 /mo · $5,711/yr
- Insurance
- −$104
- HOA
- −$0
- Vacancy / Maint / Mgmt
- −$532
- Net cashflow
- $111
Break-even live
UW: 25.0% down · 7.5% · 30yr · 1.5% tax · 5.0% vac · 8.0% maint · 8.0% mgmt
Financing live
Cash to close
- Down payment
- $62,500
- Closing costs
- $7,500
- Reserves months
- —
- Total cash needed
- —
Loan-product check · same deal, 3 products live
Conventional
25% down · 7.5% · 30yr
- Down + closing
- —
- Monthly P&I
- —
- Monthly cashflow
- —
- DSCR
- —
- Eligible?
- —
Personal DTI + credit; lowest rate.
DSCR
20% down · 8.5% · 30yr
- Down + closing
- —
- Monthly P&I
- —
- Monthly cashflow
- —
- DSCR
- —
- Eligible?
- —
No personal income docs; deal must DSCR.
Hard money
10% down · 12.0% · 12mo
- Down + closing
- —
- Monthly P&I
- —
- Monthly cashflow
- —
- DSCR
- —
- Eligible?
- —
Short-term bridge; refi at stabilization.
Rent comps 3 comps
| Address | Beds | Baths | Sqft | Rent | $/sqft | DOM | Units | Dist |
|---|---|---|---|---|---|---|---|---|
| 345 Barbara St Millersville, PA | 4.0 | 2.0 | 2000 | $3,200 | $1.60 | 14d | 1 | 0.97mi |
| 43 Baron Dr Lancaster, PA | 3.0 | 2.0 | 1351 | $2,125 | $1.57 | 13d | 7 | 1.29mi |
| 1116 Williamsburg Rd Lancaster, PA | 3.0 | 1.5 | 1400 | $1,950 | $1.39 | 14d | 1 | 1.44mi |
Listing history 19 events
-
2026-06-18days on market $250,000 Active 41 DOM
-
2026-06-17days on market $250,000 Active 40 DOM
-
2026-06-16days on market $250,000 Active 39 DOM
-
2026-06-15days on market $250,000 Active 38 DOM
-
2026-06-14days on market $250,000 Active 36 DOM
-
2026-06-10days on market $250,000 Active 33 DOM
-
2026-06-09days on market $250,000 Active 32 DOM
-
2026-06-08days on market $250,000 Active 31 DOM
-
2026-06-07days on market $250,000 Active 30 DOM
-
2026-06-03days on market $250,000 Active 26 DOM
-
2026-06-02days on market $250,000 Active 25 DOM
-
2026-06-01days on market $250,000 Active 24 DOM
-
2026-05-31days on market $250,000 Active 23 DOM
-
2026-05-30days on market $250,000 Active 22 DOM
-
2026-05-08$250,000 Active 1020-char remark
-
2013-05-07soldstatus $198,000
-
2013-05-06soldstatus $198,000 294-char remark
Show marketing remark (294 chars)
Circa 1900 4 square design - slate roof, brick exterior. Beautiful, rarely found, Chestnut woodwork & trim throughtout. 2 story barn for pakring & storage plus an inground pool. Solid constrution, plaster walls & central A/C. Gas hookup is available. Wood floors under carpet.
-
2013-03-24historical 294-char remark
Show marketing remark (294 chars)
Circa 1900 4 square design - slate roof, brick exterior. Beautiful, rarely found, Chestnut woodwork & trim throughtout. 2 story barn for pakring & storage plus an inground pool. Solid constrution, plaster walls & central A/C. Gas hookup is available. Wood floors under carpet.
-
2013-03-19$200,000 294-char remark
Show marketing remark (294 chars)
Circa 1900 4 square design - slate roof, brick exterior. Beautiful, rarely found, Chestnut woodwork & trim throughtout. 2 story barn for pakring & storage plus an inground pool. Solid constrution, plaster walls & central A/C. Gas hookup is available. Wood floors under carpet.
ⓘ Source: listings_history table (triggers on properties + properties_extension) + one-shot
backfill from property_details.listing_events for pre-trigger history.
Tax reassessment forecast PA · Partial reset (capped growth)
- Current annual tax
- $5,711 · $476/mo
- Projected year-2 tax
- $5,711 · $476/mo
- Expected delta
- $0/yr ($0/mo · 0.0%)
ⓘ Screening estimate from a state-policy table — verify with the county assessor before closing.
Climate risk First Street
- Flood 1/10 Low FEMA zone X (unshaded) · 0% chance over 30 yrs
- Wildfire 1/10 Low
- Heat 6/10 Major 7 d/yr ≥102°F today · 15 d/yr by 30 yrs out
- Wind 4/10 Moderate 15% chance of damaging wind over 30 yrs
- Air quality 3/10 Moderate 2 unhealthy d/yr today · 6 by 30 yrs out
Nearby sold comps map
Loading sold comps map…
Walkable amenities ~0.75 mi
Loading nearby amenities…
Taxation est. · year 1
- Rental income
- $30,419
- − Mortgage interest
- −$14,004
- − Property taxes
- −$5,711
- − Insurance
- −$1,250
- − Repairs & maintenance
- −$2,433
- − Management
- −$2,433
- − Depreciation
- −$7,273
- Taxable loss
- −$2,686
- Est. tax savings @ 24.0%
- +$645
- After-tax cash flow
- $1,982/yr
For passive investors: Depreciation is non-cash, so a rental often shows a tax loss while cash-flowing — sheltering income. Rental losses are passive: they offset passive income freely, and up to $25,000/yr can offset ordinary (W-2) income if you actively participate and your MAGI is under $100k (phasing out to $0 by $150k); unused losses carry forward. On sale, claimed depreciation is recaptured at up to 25%, and gains may owe capital-gains tax (a 1031 exchange can defer both). Figures are a year-1 estimate at your 24.0% rate — not tax advice; consult a CPA.
Schools (NCES district)
- District
- Penn Manor SD
- NCES district ID
- 4218630
- Math proficiency
- 52% ▼ -7.00%
- Reading proficiency
- 65% ▼ -7.00%
- Median HH income
- $59,275
- Composite
- 50.67/100
- National rank
- #1826
- State rank
- #80 of 539 in PA
Livability — Millersville
- Score
- 84/100
- State rank
- #101
- US rank
- #728
Category grades
Schools grade is shown separately in the Schools card above.
Census & demographics
- Census place
- Millersville, PA
- County
- Lancaster County · 390,309 people
- City population
- 11,753
- Metro
- Lancaster, PA
- Population (ZIP)
- 11,753
- Household income
- $68,661
- Rent vs Own
- Severe rent burden
- 454.0
Population outlook (Lancaster County) Hauer SSP2
- Today (2025)
- 561,011 people
- By 2030
- 570,969 · +1.8%
- By 2040
- 585,929 · +4.4%
- By 2050
- 591,056 · +5.4%
- By 2075
- 594,747 · +6.0%
- By 2100
- 558,850 · -0.4%
Race, ethnicity, and origin ACS 2023
- Neighborhood character
- Predominantly White (76%)
- Race & ethnicity
- White 76% Hispanic / Latino 9% Asian 7% Two or more races 7% Black 3%
- Hispanic origin (detail)
- Mexican 1% Puerto Rican 6%
- Common ancestry
- Romanian 4% Italian 3% Portuguese 2%
- Foreign-born
- 8% · South Korea, Canada, India
- Languages at home
- 87% English-only · Spanish 6% Other Indo-European 5% Chinese 1%
Political lean MEDSL · Lancaster
- 2024 margin
- R (+15.9) · D 41.5% · R 57.5%
- 2008→2024 swing
- -4.1pp toward R · 2008: -11.8pp · 2024: -15.9pp
- All cycles
- 2024: R+15.9 2020: R+15.8 2016: R+19.7 2012: R+19.2 2008: R+11.8
Not yet ingested
- Civics
- —
Market trends
- HPI YoY
- ▼ -85.18%
- Current HPI
- 257.5554
- Rent YoY
- —
- Metro
- Lancaster, PA
- State GDP YoY
- ▲ 1.68%
- F500 in state
- 34
Industry mix (Fortune 500 HQ in PA)
| Industry | F500 HQs | Revenue |
|---|---|---|
| Healthcare | 2 | $309B |
|
||
| Insurance | 2 | $27B |
|
||
| Telecommunications / Media | 1 | $124B |
|
||
| Industrial Distribution | 1 | $22B |
|
||
| Financial Services | 1 | $20B |
|
||
| Chemicals / Materials | 1 | $18B |
|
||
Price history
+25.0% since first listed5 events — show timeline
- 2026-05-08 Listed $250,000 BRIGHT MLS
- 2013-05-07 Sold (Public Records) $198,000 Public Records
- 2013-05-06 Sold (MLS) $198,000 BRIGHT MLS
- 2013-03-24 Listing Removed — BRIGHT MLS
- 2013-03-19 Listed $200,000 BRIGHT MLS
Property tax history
+3.0%/yrLatest (2026): $5,711 · +6.0% YoY. Source: county tax records.
Cash-flow waterfall
monthlySold comps — $/sqft
last 12 mo · ≤1 miLoading sold comps…