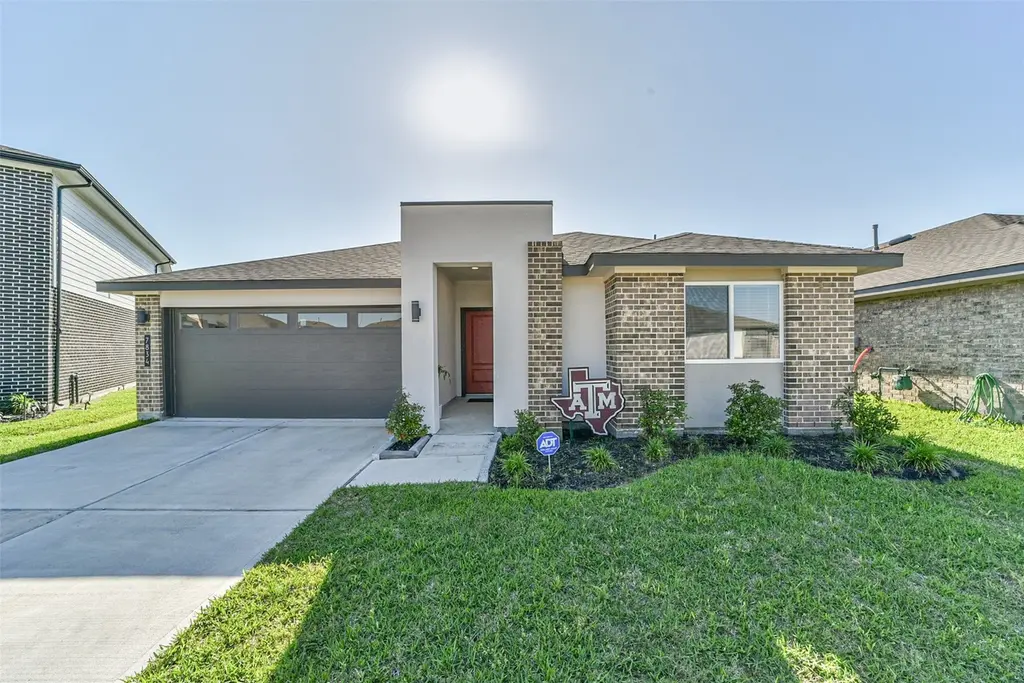
7834 Golden Rubia Ln · Sienna, TX
Flood risk No data
- FEMA flood zone
- —
- Chance of flooding over 30 yrs
- —
- Est. flood insurance / yr
- —
Fire risk No data
- Est. fire insurance / yr
- —
Heat risk No data
- Hot days now (above threshold)
- —
- Hot days in 30 yrs
- —
Wind risk No data
- Chance of severe wind over 30 yrs
- —
Air-quality risk No data
- Unhealthy air days now
- —
- Unhealthy air days in 30 yrs
- —
Risk factors via First Street. Map © Google.
Why this score? — see what drove the D- grade
The composite is a weighted blend of 9 inputs, each scored 0–100. Each bar is that input's sub-score; the figure is the points it added to the 100-point composite (weight × sub-score).
- ARV discount +9.5/15.0
- Cash flow +9.1/30.0
- Schools +4.5/10.0
- 1% rule +4.4/10.0
- Condition / age +4.0/5.0
- Rent growth +2.6/5.0
- DSCR +2.5/10.0
- Livability +2.5/5.0
- Appreciation +0.0/10.0
$250,000
🖨 Deal sheet 📄 Offer letter ✓ Due diligence
Listing remarks
Welcome to 7834 Golden Rubia Lane, located in the sought-after Caldwell Ranch community in Rosharon. Built in 2022, this thoughtfully designed 3-bedroom, 2-bath home offers just under 1,300 square feet of modern living with quality finishes throughout. The open-concept layout is complemented by quartz countertops, a tankless water heater, and a bright, inviting interior that feels both functional and refined. The kitchen comes fully equipped with refrigerator. washer, and dryer included making this home truly move-in ready. Additional features include a full water softener system and a sprinkler system for the front and backyard, adding everyday convenience. Residents enjoy access to well-m
Key facts
- Quartz countertops
- Community pool
- Sprinkler system
Tags
Property features AI
Finance
- HOA & community: Association: Inframark; Annual association fee of $850; Community pool
Exterior
- Parking: Attached garage with 2 spaces
- Security: Smoke detectors
- Utilities: Public water; Public sewer
- Home design: Residential property; Single-story (first-floor living for main rooms)
- Construction: Built in 2022; Brick and stucco construction; Composition roof; Slab foundation
- Exterior features: Covered patio; Deck; Patio; Porch; Private yard; Back yard fencing
Interior
- Kitchen: Dishwasher; Gas cooktop; Gas oven; Microwave; Garbage disposal
- Bedrooms: Primary bedroom on first floor (approx. 14 x 13); Two additional bedrooms on first floor (each approx. 11 x 10)
- Flooring: Carpet; Tile; Vinyl
- Bathrooms: 2 full bathrooms
- Heating & cooling: Central heating (gas); Central electric air conditioning
- Interior features: Quartz counters; Energy Star qualified appliances; Tankless water heater; 6 total rooms
- Laundry & utility: Washer hookup; Electric dryer hookup
Neighborhood map
What this means for you Summary
Snapshot
- This is a 3-bed/2.0-bath single-family listed at $250k. Condition is rated good.
Deal economics
- At list price, monthly cash flow is $-191 ($-2k/yr) — negative.
- To cash-flow at today's rent, offer at most $216k (13.5% below list).
- To meet the 1% rule (rent ≥ 1% of price), the offer needs to be $236k (5.8% below list).
- Recommended offer: $216k (13.5% below list) — sets the bar for cash-flow.
- Cap rate 5.4% vs local median 3.3% in Sienna — top-decile yield for the area; either an underpriced asset or a hidden risk that comps aren't pricing in. Stress-test before assuming the spread holds.
Location & tenants
- Location reads: area grade D — affects rentability + tenant quality, not the cash-flow math above.
- Fort Bend ISD (suburban): math 44% / reading 53% proficiency, ranked #140 of 826 in TX (top 17%) — families likely to look elsewhere, expect single-tenant / working-renter base with shorter leases.
- Zoned schools: Ronald Thornton Middle (math 40% / reading 52%, grade D+, #462 of 1,662 statewide, top 28%, 1,529 students, 41% FRL).
- Market conditions: Rents flat; 1139 active listings in the ZIP; 4 comparable units currently listed for rent nearby; rentals lingering (median 44d on market — plan ~5-8 weeks vacancy on turnover, expect pricing pressure); 50% of comp listings sitting > 30 days — soft ceiling on asking rent; high-income renter base; 12,093 units permitted in Fort Bend County in 2024 (815 in 5+ unit buildings).
Forward outlook
- Local home prices are declining (-3.0%/yr); year-one equity from $2k of loan paydown is wiped out by about $8k of value loss. Plan a longer hold.
- Fort Bend County population projected at +75% by 2050 — long-run rental-demand tailwind backs the buy-and-hold thesis.
Negotiation context
- It's been on market 46 days — a 3% lower offer ($242k) is reasonable based on typical stale-listing flexibility.
- 5 sale attempts since 2y ago with the ask held roughly flat each time — persistent listings suggest the price (not the market) is what's stuck; bring a comps-based counter.
Risks & watch-outs
- Watch-outs: property tax is 2.7% of price.
Questions for the listing agent
- What do current leases actually rent for vs. the listed asking? Can we see a recent rent roll and the last 12 months of T-12 income?
- It's been on market 46 days. Have you received any prior offers? Is the seller open to a 13% concession, seller financing, or rate buy-down credit?
- Property tax is high relative to price — has the assessment been appealed recently, and will the sale trigger a re-assessment?
- What does the HOA fee cover, when was the last increase, and are there any pending special assessments or reserve-fund shortfalls?
- Is there a deadline driving the sale (1031 exchange, divorce, estate, relocation)? That informs how much negotiation room exists.
- The area grade is low — what's the realistic commute time and amenity access for the typical tenant pool here? Any planned neighborhood developments (good or bad) we should know about?
- What's the average days-on-market for RENTAL listings here right now (not sales)? A rising rental-DOM trend means longer vacancies and softer asking-rent achievability than the comps imply.
- What's the recent tenant-quality profile in this submarket — average credit score on applications, eviction rate, late-payment / NSF rate, and stable-employment percentage? A property-management company in the area should have these aggregated.
- How much new for-sale + rental construction is in the pipeline within 1–3 miles? Heavy new supply typically softens prices + rents 12–24 months out; constrained supply supports both.
Investment metrics
- 1% rule
- 0.94% ✗
- Cap rate
- 5.38%
- Cash-on-cash
- -3.27%
- DSCR
- 0.85
- GRM
- 8.8
CMA / ARV
- ARV (median comp)
- $261,581
- List price
- $250,000
- Delta
- -4.43%
- Verdict
- FAIR
- Comps
- 20 within 1.0 mi
Show comp detail 12 sales within ~0.75 mi
| Address | Dist | Beds/Ba | Sqft | Sold | Price | $/sf | Match |
|---|---|---|---|---|---|---|---|
| 7726 Golden Rubia Ln | 0.10mi | 3/2.0 | 1,297 (0%) | 2mo | $245,000 | $189 | 93 |
| 711 Boer Plains Dr | 0.11mi | 3/2.0 | 1,297 (0%) | 10mo | $254,900 | $197 | 86 |
| 726 Hearth Manor Dr | 0.12mi | 3/2.0 | 1,297 (0%) | 12mo | $254,500 | $196 | 84 |
| 718 Silver Kettle Dr | 0.13mi | 3/2.0 | 1,297 (0%) | 13mo | $255,000 | $197 | 83 |
| 706 Zinnia Ct | 0.23mi | 3/2.0 | 1,338 (+3%) | 3mo | $234,999 | $176 | 82 |
| 8038 Molasses Way | 0.27mi | 3/2.0 | 1,303 (+0%) | 7mo | $245,000 | $188 | 81 |
| 8303 Amaryllis Ct | 0.43mi | 3/2.0 | 1,272 (-2%) | 7mo | $204,900 | $161 | 70 |
| 8218 Radial Ct | 0.44mi | 3/2.0 | 1,200 (-8%) | 1mo | $235,000 | $196 | 66 |
| 8223 Radial Ct | 0.44mi | 3/2.0 | 1,200 (-8%) | 13mo | $229,900 | $192 | 57 |
| 8015 Milam Ln | 0.54mi | 3/2.0 | 1,409 (+9%) | 6mo | $260,000 | $185 | 55 |
| 8018 Buck Ln | 0.62mi | 3/2.0 | 1,409 (+9%) | 6mo | $269,990 | $192 | 52 |
| 8302 Tartan Ct | 0.49mi | 3/2.5 | 1,486 (+15%) | 13mo | $239,900 | $161 | 40 |
Match score weights: distance 35% · size 25% · config 20% · recency 20%. Top-matched comps best support the ARV.
Projected returns pro-forma
-3.0% appreciation · 0.44% rent growth · sell at horizon
- IRR
- -25.2%
- Equity multiple
- 0.17×
- Total profit
- $-58,333
- Equity at exit
- $37,276
- IRR
- -34.3%
- Equity multiple
- -0.26×
- Total profit
- $-88,537
- Equity at exit
- $21,615
Cash invested: $70,000 (down + closing). Projections, not guarantees.
Landlord ↔ Tenant lean methodology
- Overall (STATE)
- 87 Strongly Landlord-Friendly
- State Texas
- 87 Strongly Landlord-Friendly · R+5
- County
- — inherits STATE
- City
- — inherits STATE
ZIP-level market 77583
- Rents YoY
- 0.4%
- Active inventory
- 1139
- Price-to-rent
- 8.8×
Monthly cashflow live
- Estimated rent
- $2,355 medium interval (Pro) →
- Mortgage (P&I)
- −$1,311
- Tax from tax record
- −$565 /mo · $6,779/yr
- Insurance
- −$104
- HOA
- −$71
- Vacancy / Maint / Mgmt
- −$495
- Net cashflow
- $-191
Break-even live
UW: 25.0% down · 7.5% · 30yr · 1.5% tax · 5.0% vac · 8.0% maint · 8.0% mgmt
Financing live
Cash to close
- Down payment
- $62,500
- Closing costs
- $7,500
- Reserves months
- —
- Total cash needed
- —
Loan-product check · same deal, 3 products live
Conventional
25% down · 7.5% · 30yr
- Down + closing
- —
- Monthly P&I
- —
- Monthly cashflow
- —
- DSCR
- —
- Eligible?
- —
Personal DTI + credit; lowest rate.
DSCR
20% down · 8.5% · 30yr
- Down + closing
- —
- Monthly P&I
- —
- Monthly cashflow
- —
- DSCR
- —
- Eligible?
- —
No personal income docs; deal must DSCR.
Hard money
10% down · 12.0% · 12mo
- Down + closing
- —
- Monthly P&I
- —
- Monthly cashflow
- —
- DSCR
- —
- Eligible?
- —
Short-term bridge; refi at stabilization.
Rent comps 4 comps
| Address | Beds | Baths | Sqft | Rent | $/sqft | DOM | Units | Dist |
|---|---|---|---|---|---|---|---|---|
| 8310 Rose Petals Ln Rosharon, TX | 4.0 | 2.0 | 1833 | $2,300 | $1.25 | 44d | 1 | 0.43mi |
| 8102 Buck Ln Rosharon, TX | 3.0 | 2.0 | 1409 | $2,100 | $1.49 | 44d | 1 | 0.65mi |
| 8219 House Dr Rosharon, TX | 3.0 | 2.0 | 1263 | $1,970 | $1.56 | 22d | 1 | 0.67mi |
| 6911 Rosemont Ct Rosharon, TX | 4.0 | 2.0 | 1719 | $1,750 | $1.02 | 13d | 1 | 0.89mi |
HOA detail
- Monthly dues
- $71 · $852/yr
- Likely covers
- water
Listing history 18 events
-
2026-06-15days on market $250,000 Pending 46 DOM
-
2026-06-13days on market $250,000 Pending 44 DOM
-
2026-06-09statusdays on market $250,000 Pending 40 DOM
-
2026-06-07days on market $250,000 Active 38 DOM
-
2026-06-04days on market $250,000 Active 35 DOM
-
2026-06-03days on market $250,000 Active 34 DOM
-
2026-06-02days on market $250,000 Active 33 DOM
-
2026-06-01days on market $250,000 Active 32 DOM
-
2026-05-31days on market $250,000 Active 31 DOM
-
2026-04-30historical
-
2026-04-30$250,000 Active 1002-char remark
-
2026-03-25$260,000 Active
-
2025-07-11historical $2,100
-
2025-07-08$2,100
-
2025-06-30historical $2,100
-
2025-06-11$2,100
-
2024-06-09historical $2,100
-
2024-04-14$2,100
ⓘ Source: listings_history table (triggers on properties + properties_extension) + one-shot
backfill from property_details.listing_events for pre-trigger history.
Tax reassessment forecast TX · Resets to sale price
- Current annual tax
- $6,779 · $565/mo
- Projected year-2 tax
- $6,779 · $565/mo
- Expected delta
- $0/yr ($0/mo · 0.0%)
ⓘ Screening estimate from a state-policy table — verify with the county assessor before closing.
Nearby sold comps map
Loading sold comps map…
Walkable amenities ~0.75 mi
Loading nearby amenities…
Taxation est. · year 1
- Rental income
- $28,260
- − Mortgage interest
- −$14,004
- − Property taxes
- −$6,779
- − Insurance
- −$1,250
- − Repairs & maintenance
- −$2,261
- − Management
- −$2,261
- − HOA
- −$852
- − Depreciation
- −$7,273
- Taxable loss
- −$6,419
- Est. tax savings @ 24.0%
- +$1,541
- After-tax cash flow
- $-747/yr
For passive investors: Depreciation is non-cash, so a rental often shows a tax loss while cash-flowing — sheltering income. Rental losses are passive: they offset passive income freely, and up to $25,000/yr can offset ordinary (W-2) income if you actively participate and your MAGI is under $100k (phasing out to $0 by $150k); unused losses carry forward. On sale, claimed depreciation is recaptured at up to 25%, and gains may owe capital-gains tax (a 1031 exchange can defer both). Figures are a year-1 estimate at your 24.0% rate — not tax advice; consult a CPA.
Condition & rehab AI · 1 photo
This move-in ready home in the Caldwell Ranch community is in good condition with modern finishes and a well-maintained exterior. It offers a good return on investment with minor updates that can further enhance its value.
Value-add opportunities
- Both Landscaping — Enhances curb appeal and property value
- Both Paint exterior — Fresh paint can improve curb appeal and property value
- Both Upgrade windows — Modern windows can improve energy efficiency and property value
Renovation cost estimate screening
Value-add ROI direction
- Both Landscaping — Enhances curb appeal and property value ↑
- Both Paint exterior — Fresh paint can improve curb appeal and property value ↑
- Both Upgrade windows — Modern windows can improve energy efficiency and property value ↑
ⓘ Cost ranges are severity-bucket heuristics (US national rule-of-thumb). Get contractor quotes + a written scope before underwriting a rehab budget.
Schools (NCES district)
- District
- Fort Bend ISD
- NCES district ID
- 4819650
- Math proficiency
- 44% ▼ -15.00%
- Reading proficiency
- 53% ▼ -4.00%
- Median HH income
- $82,360
- Composite
- 44.61/100
- National rank
- #2779
- State rank
- #140 of 826 in TX
Livability — Sienna
No livability data for this city. (Only ~50 U.S. cities are tracked.)
Census & demographics
- County
- Brazoria County · 374,982 people
- Metro
- Houston-The Woodlands-Sugar Land, TX
- Population (ZIP)
- 52,747
- Household income
- $119,287
- Rent vs Own
- Severe rent burden
- 251.0
Population outlook (Fort Bend County) Hauer SSP2
- Today (2025)
- 1,004,526 people
- By 2030
- 1,153,104 · +14.8%
- By 2040
- 1,453,718 · +44.7%
- By 2050
- 1,753,781 · +74.6%
- By 2075
- 2,455,772 · +144.5%
- By 2100
- 2,930,528 · +191.7%
Race, ethnicity, and origin ACS 2023
- Neighborhood character
- Highly diverse neighborhood (Simpson 0.70)
- Race & ethnicity
- Hispanic / Latino 38% Black 34% White 20% Two or more races 18% Asian 5%
- Hispanic origin (detail)
- Mexican 31% Puerto Rican 2%
- Common ancestry
- Lithuanian 1% Slovak 1% Romanian 1%
- Foreign-born
- 16% · Canada, Vietnam, China
- Languages at home
- 64% English-only · Spanish 28% Other Asian/Pacific 2% Vietnamese 1%
Political lean MEDSL · Fort Bend
- 2024 margin
- Toss-up / Even · D 49.5% · R 47.9% · Other 2.6%
- 2008→2024 swing
- +4.0pp toward D · 2008: -2.4pp · 2024: 1.6pp
- All cycles
- 2024: D+1.6 2020: D+10.6 2016: D+6.6 2012: R+6.8 2008: R+2.4
Not yet ingested
- Civics
- —
Market trends
- HPI YoY
- ▼ -120.19%
- Current HPI
- 198.6559
- Rent YoY
- ▲ 0.44%
- Metro
- Houston-The Woodlands-Sugar Land, TX
- State GDP YoY
- ▲ 3.95%
- F500 in state
- 110
Industry mix (Fortune 500 HQ in TX)
| Industry | F500 HQs | Revenue |
|---|---|---|
| Energy | 16 | $1,198B |
|
||
| Technology | 5 | $198B |
|
||
| Engineering / Construction | 4 | $72B |
|
||
| Energy Services | 3 | $60B |
|
||
| Utilities | 3 | $41B |
|
||
| Healthcare | 2 | $330B |
|
||
Price history
+11804.8% since first listed11 events — show timeline
- 2026-06-16 Pending — HARMLS
- 2026-06-08 Pending — HARMLS
- 2026-04-30 Listing Removed — HARMLS
- 2026-04-30 Listed $250,000 HARMLS
- 2026-03-25 Listed $260,000 HARMLS
- 2025-07-11 Rental Removed $2,100 HARMLS
- 2025-07-08 Listed for Rent $2,100 HARMLS
- 2025-06-30 Rental Removed $2,100 HARMLS
- 2025-06-11 Listed for Rent $2,100 HARMLS
- 2024-06-09 Rental Removed $2,100 HARMLS
- 2024-04-14 Listed for Rent $2,100 HARMLS
Property tax history
+7.8%/yrLatest (2025): $6,779 · +96.5% YoY. Source: county tax records.
Cash-flow waterfall
monthlySold comps — $/sqft
last 12 mo · ≤1 miLoading sold comps…