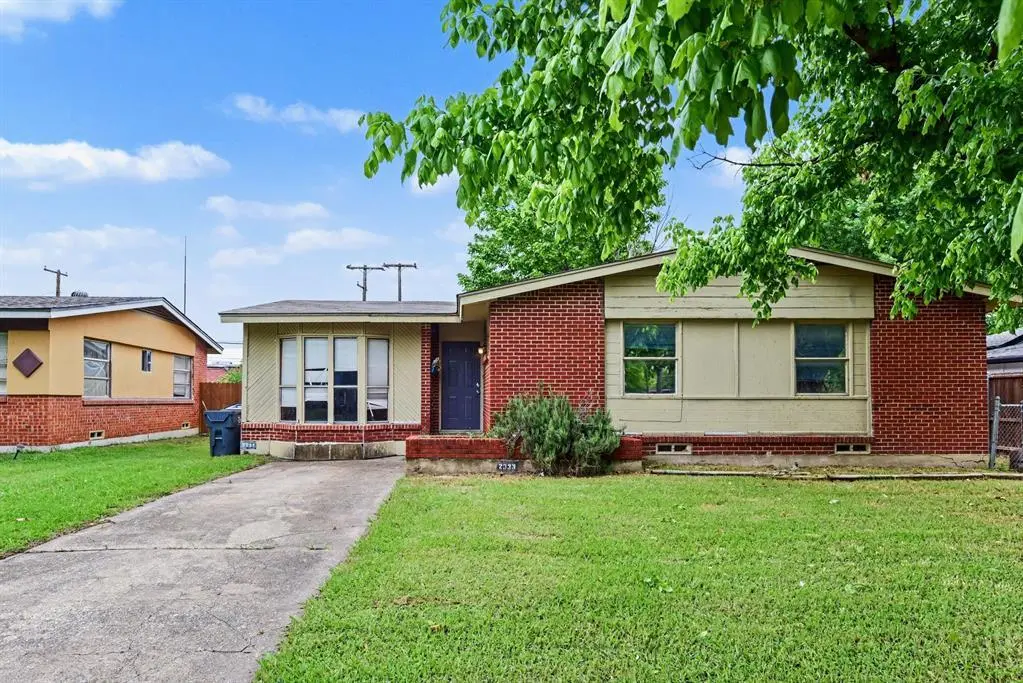
2333 S Lockhart Ave · Dallas, TX
Flood risk 1/10 · Minimal
- FEMA flood zone
- X (unshaded)
- Chance of flooding over 30 yrs
- 0.0%
- Est. flood insurance / yr
- $507 – $1,088
Fire risk 1/10 · Minimal
- Est. fire insurance / yr
- $1,222 – $2,270
Heat risk 7/10 · Major
- Hot days now (above 109°F)
- 7 days/yr
- Hot days in 30 yrs
- 25 days/yr
Wind risk 6/10 · Moderate
- Chance of severe wind over 30 yrs
- 27.0%
Air-quality risk 2/10 · Minimal
- Unhealthy air days now
- 2 days/yr
- Unhealthy air days in 30 yrs
- 2 days/yr
Risk factors via First Street. Map © Google.
Why this score? — see what drove the D grade
The composite is a weighted blend of 9 inputs, each scored 0–100. Each bar is that input's sub-score; the figure is the points it added to the 100-point composite (weight × sub-score).
- ARV discount +15.0/15.0
- Cash flow +10.2/30.0
- 1% rule +4.2/10.0
- Livability +4.0/5.0
- DSCR +2.9/10.0
- Schools +2.8/10.0
- Condition / age +2.5/5.0
- Rent growth +1.3/5.0
- Appreciation +0.0/10.0
$209,900
🖨 Deal sheet (PDF) 📄 Offer letter ✓ Due diligence
Listing remarks MLS
ABSOLUTE DOLL HOUSE! FEATURES 3 BEDROOMS, 1 & HALF BATHS & 2 LG LIVING AREAS. BUILT IN BOOKCASE IN 1 LIVING, CEILING FANS THROUGHOUT. NEW CARPET, VINYL & PAINT INSIDE. ADORABLE KITCHEN WITH BREAKFAST AREA, NEW COUNTER TOPS, STAINLESS STEEL SINK, PLENTY OF CABINET SPACE, SPACIOUS BEDROOMS WITH CEILING FANS AND NEW BLINDS. HUGE FENCED BACKYARD WITH PATIO. ROOF REPLACED TWO YEARS AGO.
Key facts
- Separate living area
- 7,667 sq ft lot
- Built 1954
Tags
Property features AI
Finance
- Other: Lot is less than 0.5 acre (about 0.176 acre); No restrictions; Property listed as For Sale
- Financial info: Listing accepts Cash, Conventional, FHA, and VA loan; No second mortgage reported
- HOA & community: No homeowners association
Exterior
- Parking: No garage spaces; No covered or carport spaces; Other parking features
- Utilities: City water; City sewer; Not in a municipal utility district
- Home design: Single family residence; One level; Residential property; No accessibility features reported; No interior attachments (detached)
- Construction: Brick construction; Built in 1954; Slab foundation; Composition/Shingle roof
- Exterior features: Patio
Interior
- Kitchen: Dishwasher; Kitchen — 10 x 12; Breakfast room — 10 x 8
- Bedrooms: Primary bedroom (1st level) — 14 x 11; Bedroom (1st level) — 11 x 11; Bedroom (1st level) — 11 x 10
- Flooring: Carpet; Vinyl; Wood
- Bathrooms: 1 full bathroom; 1 half bathroom (2 total bathrooms)
- Heating & cooling: Central heating (natural gas); Central air conditioning; Ceiling fan(s); Electric cooling components
- Interior features: 6 rooms total; 2 living areas; 1 dining area; Other interior features
- Laundry & utility: No specific laundry appliances listed
Neighborhood map
What this means for you Summary
Snapshot
- This is a 3-bed/1.5-bath single-family listed at $210k.
Deal economics
- At list price, monthly cash flow is $-119 ($-1k/yr) — negative.
- To cash-flow at today's rent, offer at most $189k (10.0% below list).
- To meet the 1% rule (rent ≥ 1% of price), the offer needs to be $192k (8.5% below list).
- Recommended offer: $189k (10.0% below list) — sets the bar for cash-flow.
- Cap rate 5.6% vs local median 2.3% in Dallas — top-decile yield for the area; either an underpriced asset or a hidden risk that comps aren't pricing in. Stress-test before assuming the spread holds.
Location & tenants
- Location reads 81/100 on livability (#24 in TX, #1,380 nationally) — a professional / high-income tenant draw. Strengths: amenities A+, commute A+, housing A+; Watch: crime F.
- Dallas ISD (urban): math 31% / reading 36% proficiency, ranked #559 of 826 in TX (top 68%) — families likely to look elsewhere, expect single-tenant / working-renter base with shorter leases; 83% free/reduced lunch — lower-income household profile, screen leases tightly.
- Zoned schools: Edwin J Kiest El (math 34% / reading 35%, grade F, #1,995 of 4,322 statewide, top 50%, 574 students, 92% FRL); W H Gaston Middle (math 17% / reading 25%, grade F, #1,387 of 1,662 statewide, top 85%, 688 students, 92% FRL); Bryan Adams H S Leadership Academy (math 41% / reading 41%, grade F, #774 of 1,632 statewide, top 49%, 2,271 students, 89% FRL).
- Market conditions: Rents falling (-4.8%/yr); 307 active listings in the ZIP; 40 comparable units currently listed for rent nearby; rentals at typical pace (median 26d on market — plan ~3-4 weeks tenant-placement turnaround); 12,577 units permitted in Dallas County in 2024 (6,829 in 5+ unit buildings).
- This rent runs 37% of the median local income ($63k/yr) — at the standard rent-burdened threshold; future hikes will face affordability resistance.
Forward outlook
- Local home prices are declining (-3.0%/yr); year-one equity from $1k of loan paydown is wiped out by about $6k of value loss. Plan a longer hold.
- Dallas County population projected at +35% by 2050 — long-run rental-demand tailwind backs the buy-and-hold thesis.
Negotiation context
- It's been on market 48 days — a 3% lower offer ($204k) is reasonable based on typical stale-listing flexibility.
- 3 sale attempts since 14y ago; this cycle's ask has dropped $15k (7%) from the opening price — seller is motivated, your offer sets the floor, not the list.
Risks & watch-outs
- Watch-outs: property tax is 2.6% of price; built in 1954 — expect roof / HVAC / electrical / plumbing capex.
- Climate carrying-cost: major wind risk, 27% chance of damaging wind over 30y; extreme-heat days projected 7→25/yr by 2055 (HVAC capex compounding) — expect insurance premiums to compound above CPI over the hold.
Questions for the listing agent
- What do current leases actually rent for vs. the listed asking? Can we see a recent rent roll and the last 12 months of T-12 income?
- It's been on market 48 days. Have you received any prior offers? Is the seller open to a 10% concession, seller financing, or rate buy-down credit?
- Built in 1954 — when were the roof, HVAC, electrical panel, plumbing, and water heater last replaced?
- Property tax is high relative to price — has the assessment been appealed recently, and will the sale trigger a re-assessment?
- Is there a deadline driving the sale (1031 exchange, divorce, estate, relocation)? That informs how much negotiation room exists.
- Crime grade is F in this area — have there been break-ins, vandalism, or insurance claims at this property in the last 3 years? What carrier currently insures it and at what premium?
- The area grade is low — what's the realistic commute time and amenity access for the typical tenant pool here? Any planned neighborhood developments (good or bad) we should know about?
- What's the average days-on-market for RENTAL listings here right now (not sales)? A rising rental-DOM trend means longer vacancies and softer asking-rent achievability than the comps imply.
- What's the recent tenant-quality profile in this submarket — average credit score on applications, eviction rate, late-payment / NSF rate, and stable-employment percentage? A property-management company in the area should have these aggregated.
- How much new for-sale + rental construction is in the pipeline within 1–3 miles? Heavy new supply typically softens prices + rents 12–24 months out; constrained supply supports both.
Investment metrics
- 1% rule
- 0.92% ✗
- Cap rate
- 5.61%
- Cash-on-cash
- -2.43%
- DSCR
- 0.89
- GRM
- 9.1
CMA / ARV
- ARV (median comp)
- $264,543
- List price
- $209,900
- Delta
- -20.66%
- Verdict
- UNDERPRICED
- Comps
- 20 within 1.0 mi
Show comp detail 12 sales within ~0.75 mi
| Address | Dist | Beds/Ba | Sqft | Sold | Price | $/sf | Match |
|---|---|---|---|---|---|---|---|
| 2406 Globe Ave | 0.39mi | 3/2.0 | 1,403 (-0%) | 1mo | $285,000 | $203 | 79 |
| 9308 Lindaro Ln | 0.28mi | 3/2.0 | 1,258 (-11%) | 3mo | $325,000 | $258 | 65 |
| 9119 Piper Ln | 0.32mi | 3/1.5 | 1,223 (-13%) | 1mo | $240,000 | $196 | 62 |
| 2604 Andrea Ln | 0.60mi | 3/2.0 | 1,337 (-5%) | 1mo | $425,000 | $318 | 61 |
| 8719 Freeport Dr | 0.51mi | 4/2.0 (+1) | 1,500 (+6%) | 2mo | $199,999 | $133 | 57 |
| 8905 La Prada Dr | 0.74mi | 3/2.5 | 1,352 (-4%) | 2mo | $275,000 | $203 | 54 |
| 2330 Peavy Pl | 0.49mi | 3/2.0 | 1,571 (+12%) | 3mo | $460,000 | $293 | 53 |
| 2719 Andrea Ln | 0.74mi | 4/1.5 (+1) | 1,361 (-3%) | 3mo | $139,900 | $103 | 52 |
| 2729 Lockhart Ave | 0.54mi | 3/2.0 | 1,238 (-12%) | 2mo | $300,000 | $242 | 52 |
| 1759 Gross Rd | 0.66mi | 3/2.0 | 1,559 (+11%) | 1mo | $280,000 | $180 | 49 |
| 2472 Highwood Dr | 0.61mi | 4/2.0 (+1) | 1,535 (+9%) | 3mo | $300,000 | $195 | 47 |
| 2623 Province Ln | 0.44mi | 4/2.0 (+1) | 1,619 (+15%) | 1mo | $285,000 | $176 | 47 |
Match score weights: distance 35% · size 25% · config 20% · recency 20%. Top-matched comps best support the ARV.
Projected returns pro-forma
-3.0% appreciation · 0.0% rent growth · sell at horizon
- IRR
- -24.2%
- Equity multiple
- 0.20×
- Total profit
- $-47,091
- Equity at exit
- $31,297
- IRR
- -33.6%
- Equity multiple
- -0.22×
- Total profit
- $-71,959
- Equity at exit
- $18,148
Cash invested: $58,772 (down + closing). Projections, not guarantees.
Landlord ↔ Tenant lean methodology
- Overall (STATE)
- 87 Strongly Landlord-Friendly
- State Texas
- 87 Strongly Landlord-Friendly · R+5
- County
- — inherits STATE
- City
- — inherits STATE
ZIP-level market 75228
- Rents YoY
- -4.8%
- Active inventory
- 307
- Price-to-rent
- 9.1×
Monthly cashflow live
- Estimated rent
- $1,922 high interval (Pro) →
- Mortgage (P&I)
- −$1,101
- Tax from tax record
- −$449 /mo · $5,389/yr
- Insurance
- −$87
- HOA
- −$0
- Vacancy / Maint / Mgmt
- −$404
- Net cashflow
- $-119
Break-even live
Sensitivity live
| Price | -10% $0 | -5% $-60 | +0% $-119 | +5% $-179 | +10% $-238 |
|---|---|---|---|---|---|
| Rent | -10% $-271 | -5% $-195 | +0% $-119 | +5% $-43 | +10% $33 |
| Rate | -1.0pp $-13 | -0.5pp $-66 | base $-119 | +0.5pp $-174 | +1.0pp $-229 |
UW: 25.0% down · 7.5% · 30yr · 1.5% tax · 5.0% vac · 8.0% maint · 8.0% mgmt
Financing live
Cash to close
- Down payment
- $52,475
- Closing costs
- $6,297
- Reserves months
- —
- Total cash needed
- —
Loan-product check · same deal, 3 products live
Conventional
25% down · 7.5% · 30yr
- Down + closing
- —
- Monthly P&I
- —
- Monthly cashflow
- —
- DSCR
- —
- Eligible?
- —
Personal DTI + credit; lowest rate.
DSCR
20% down · 8.5% · 30yr
- Down + closing
- —
- Monthly P&I
- —
- Monthly cashflow
- —
- DSCR
- —
- Eligible?
- —
No personal income docs; deal must DSCR.
Hard money
10% down · 12.0% · 12mo
- Down + closing
- —
- Monthly P&I
- —
- Monthly cashflow
- —
- DSCR
- —
- Eligible?
- —
Short-term bridge; refi at stabilization.
Rent comps 40 comps
| Address | Beds | Baths | Sqft | Rent | $/sqft | DOM | Units | Dist |
|---|---|---|---|---|---|---|---|---|
| 2346 Hillsboro Ave Dallas, TX | 3.0 | 2.0 | 1226 | $1,900 | $1.55 | 9d | 1 | 0.30mi |
| 9107 Rustown Dr Dallas, TX | 3.0 | 1.5 | 1138 | $1,700 | $1.49 | 26d | 1 | 0.31mi |
| 2506 Hillsboro Ave Dallas, TX | 4.0 | 1.5 | 1234 | $2,200 | $1.78 | 24d | 1 | 0.34mi |
| 2539 Hillsboro Ave Dallas, TX | 3.0 | 1.5 | 1438 | $1,800 | $1.25 | 45d | 1 | 0.36mi |
| 9911 Ferguson Rd Dallas, TX | 3.0 | 2.0 | 1299 | $2,500 | $1.92 | 45d | 1 | 0.37mi |
| 2508 Hillglenn Rd Dallas, TX | 3.0 | 2.0 | 1392 | $2,050 | $1.47 | 9d | 1 | 0.41mi |
| 1830 Viewcrest Dr Dallas, TX | 3.0 | 2.0 | 1379 | $2,100 | $1.52 | 26d | 1 | 0.43mi |
| 2523 Gross Rd Dallas, TX | 3.0 | 1.0 | 1025 | $1,650 | $1.61 | 45d | 1 | 0.44mi |
| 2314 Blyth Dr Dallas, TX | 3.0 | 1.0 | 1203 | $1,650 | $1.37 | 19d | 1 | 0.47mi |
| 2127 Clarksdale Dr Dallas, TX | 3.0 | 2.0 | 1322 | $2,600 | $1.97 | 16d | 1 | 0.48mi |
| 2729 Lockhart Ave Dallas, TX | 3.0 | 2.0 | 1238 | $2,300 | $1.86 | 20d | 1 | 0.52mi |
| 2729 Lockhart Ave Unit NA Dallas, TX | 3.0 | 2.0 | 1238 | $2,300 | $1.86 | 26d | 1 | 0.52mi |
| 2425 Materhorn Dr Dallas, TX | 3.0 | 2.0 | 1520 | $2,195 | $1.44 | 45d | 1 | 0.56mi |
| 1905 Province Ln Dallas, TX | 3.0 | 2.0 | 1460 | $3,000 | $2.05 | 14d | 1 | 0.56mi |
| 2510 Materhorn Dr Dallas, TX | 3.0 | 2.0 | 1452 | $2,195 | $1.51 | 5d | 1 | 0.63mi |
| 2708 Running Brook Ln Dallas, TX | 3.0 | 2.0 | 1436 | $1,900 | $1.32 | 45d | 1 | 0.65mi |
| 8702 Shiloh Rd Dallas, TX | 2.0–4.0 | 1.0–2.0 | 1070 | $1,592 | $1.49 | 45d | 1 | 0.67mi |
| 2908 Scottsbluff Dr Dallas, TX | 3.0 | 2.0 | 1134 | $2,100 | $1.85 | 0d | 1 | 0.68mi |
| 2251 Hartline Dr Dallas, TX | 3.0 | 2.0 | 1468 | $2,500 | $1.70 | 18d | 1 | 0.71mi |
| 2728 N Buckner Blvd Dallas, TX | 1.0–2.0 | 1.0 | 760 | $1,195 | $1.57 | 26d | 1 | 0.73mi |
| 2728 N Buckner Blvd Dallas, TX | 1.0–3.0 | 1.0–2.0 | 1012 | $1,500 | $1.48 | 45d | 3 | 0.73mi |
| 9924 Coldwater Cir Dallas, TX | 3.0 | 2.0 | 1366 | $2,200 | $1.61 | 45d | 1 | 0.74mi |
| 3022 Larry Dr Dallas, TX | 3.0 | 2.0 | 1125 | $1,949 | $1.73 | 4d | 1 | 0.75mi |
| 1827 Abshire Ln Dallas, TX | 3.0 | 1.0 | 1140 | $1,725 | $1.51 | 26d | 1 | 0.77mi |
| 3008 Scottsbluff Dr Dallas, TX | 4.0 | 2.0 | 1220 | $2,200 | $1.80 | 21d | 1 | 0.77mi |
| 2605 John West Rd Dallas, TX | 2.0–3.0 | 2.0 | 1025 | $1,396 | $1.36 | 1d | 11 | 0.77mi |
| 2938 Healey Dr Dallas, TX | 3.0 | 2.0 | 1400 | $2,095 | $1.50 | 45d | 1 | 0.78mi |
| 2709 Highwood Dr Dallas, TX | 3.0 | 1.0 | 1116 | $1,695 | $1.52 | 26d | 1 | 0.82mi |
| 2322 San Paula Ave Dallas, TX | 4.0 | 2.0 | 1591 | $2,200 | $1.38 | 26d | 1 | 0.84mi |
| 2630 Pasteur Ave Dallas, TX | 3.0 | 2.0 | 1418 | $2,200 | $1.55 | 22d | 1 | 0.87mi |
| 10205 San Juan Ave Dallas, TX | 3.0 | 2.0 | 1458 | $2,225 | $1.53 | 26d | 1 | 0.87mi |
| 10008 San Lorenzo Dr Dallas, TX | 3.0 | 2.0 | 1550 | $2,400 | $1.55 | 26d | 1 | 0.87mi |
| 10028 San Lorenzo Dr Dallas, TX | 3.0 | 2.0 | 1238 | $2,600 | $2.10 | 17d | 1 | 0.88mi |
| 8411 La Prada Dr Dallas, TX | 1.0–3.0 | 1.0–2.0 | 825 | $1,305 | $1.58 | 1d | 24 | 0.89mi |
| 2414 San Medina Ave Dallas, TX | 3.0 | 1.5 | 1231 | $2,100 | $1.71 | 8d | 1 | 0.89mi |
| 8383 La Prada Dr Dallas, TX | 1.0–2.0 | 1.0–2.0 | 910 | $1,545 | $1.70 | 1d | 9 | 0.90mi |
| 1804 Mariposa Dr Dallas, TX | 2.0 | 1.0 | 1125 | $1,900 | $1.69 | 17d | 1 | 0.91mi |
| 9302 Beck Ave Unit 189 Dallas, TX | 2.0 | 1.0 | 975 | $1,350 | $1.38 | 45d | 1 | 0.93mi |
| 9302 Beck Ave Dallas, TX | 2.0 | 1.0–1.5 | 663 | $1,495 | $2.25 | 1d | 83 | 0.93mi |
| 9302 Beck Ave Unit 159 Dallas, TX | 2.0 | 1.0 | 975 | $1,299 | $1.33 | 45d | 1 | 0.93mi |
Listing history 28 events
-
2026-06-21days on market $209,900 Active 48 DOM
-
2026-06-18price $209,900 Active 45 DOM
-
2026-06-18days on market $219,900 Active 45 DOM
-
2026-06-17days on market $219,900 Active 44 DOM
-
2026-06-16days on market $219,900 Active 43 DOM
-
2026-06-15days on market $219,900 Active 42 DOM
-
2026-06-13days on market $219,900 Active 40 DOM
-
2026-06-09days on market $219,900 Active 36 DOM
-
2026-06-08days on market $219,900 Active 35 DOM
-
2026-06-07days on market $219,900 Active 34 DOM
-
2026-06-04days on market $219,900 Active 31 DOM
-
2026-06-03days on market $219,900 Active 30 DOM
-
2026-06-02days on market $219,900 Active 29 DOM
-
2026-06-02price $219,900 Active 28 DOM
-
2026-06-01days on market $225,000 Active 28 DOM
-
2026-05-31days on market $225,000 Active 27 DOM
-
2026-04-30$225,000 Active 573-char remark
-
2023-08-16historical $1,795
-
2023-08-08$1,795
-
2022-02-03price $1,650
-
2013-04-09soldstatus
-
2013-04-05soldstatus Closed 402-char remark
Show marketing remark (402 chars)
ABSOLUTE DOLL HOUSE! FEATURES 3 BEDROOMS, 1 & HALF BATHS & 2 LG LIVING AREAS. BUILT IN BOOKCASE IN 1 LIVING, CEILING FANS THROUGHOUT. NEW CARPET, VINYL & PAINT INSIDE. ADORABLE KITCHEN WITH BREAKFAST AREA, NEW COUNTER TOPS, STAINLESS STEEL SINK, PLENTY OF CABINET SPACE, SPACIOUS BEDROOMS WITH CEILING FANS AND NEW BLINDS. HUGE FENCED BACKYARD WITH PATIO. ROOF REPLACED TWO YEARS AGO.
-
2013-03-25status Pending 402-char remark
Show marketing remark (402 chars)
ABSOLUTE DOLL HOUSE! FEATURES 3 BEDROOMS, 1 & HALF BATHS & 2 LG LIVING AREAS. BUILT IN BOOKCASE IN 1 LIVING, CEILING FANS THROUGHOUT. NEW CARPET, VINYL & PAINT INSIDE. ADORABLE KITCHEN WITH BREAKFAST AREA, NEW COUNTER TOPS, STAINLESS STEEL SINK, PLENTY OF CABINET SPACE, SPACIOUS BEDROOMS WITH CEILING FANS AND NEW BLINDS. HUGE FENCED BACKYARD WITH PATIO. ROOF REPLACED TWO YEARS AGO.
-
2013-03-14historical Active Option Contract 402-char remark
Show marketing remark (402 chars)
ABSOLUTE DOLL HOUSE! FEATURES 3 BEDROOMS, 1 & HALF BATHS & 2 LG LIVING AREAS. BUILT IN BOOKCASE IN 1 LIVING, CEILING FANS THROUGHOUT. NEW CARPET, VINYL & PAINT INSIDE. ADORABLE KITCHEN WITH BREAKFAST AREA, NEW COUNTER TOPS, STAINLESS STEEL SINK, PLENTY OF CABINET SPACE, SPACIOUS BEDROOMS WITH CEILING FANS AND NEW BLINDS. HUGE FENCED BACKYARD WITH PATIO. ROOF REPLACED TWO YEARS AGO.
-
2013-02-21price $78,500 402-char remark
Show marketing remark (402 chars)
ABSOLUTE DOLL HOUSE! FEATURES 3 BEDROOMS, 1 & HALF BATHS & 2 LG LIVING AREAS. BUILT IN BOOKCASE IN 1 LIVING, CEILING FANS THROUGHOUT. NEW CARPET, VINYL & PAINT INSIDE. ADORABLE KITCHEN WITH BREAKFAST AREA, NEW COUNTER TOPS, STAINLESS STEEL SINK, PLENTY OF CABINET SPACE, SPACIOUS BEDROOMS WITH CEILING FANS AND NEW BLINDS. HUGE FENCED BACKYARD WITH PATIO. ROOF REPLACED TWO YEARS AGO.
-
2013-02-08price $79,000 402-char remark
Show marketing remark (402 chars)
ABSOLUTE DOLL HOUSE! FEATURES 3 BEDROOMS, 1 & HALF BATHS & 2 LG LIVING AREAS. BUILT IN BOOKCASE IN 1 LIVING, CEILING FANS THROUGHOUT. NEW CARPET, VINYL & PAINT INSIDE. ADORABLE KITCHEN WITH BREAKFAST AREA, NEW COUNTER TOPS, STAINLESS STEEL SINK, PLENTY OF CABINET SPACE, SPACIOUS BEDROOMS WITH CEILING FANS AND NEW BLINDS. HUGE FENCED BACKYARD WITH PATIO. ROOF REPLACED TWO YEARS AGO.
-
2012-12-03$79,900 Active 402-char remark
Show marketing remark (402 chars)
ABSOLUTE DOLL HOUSE! FEATURES 3 BEDROOMS, 1 & HALF BATHS & 2 LG LIVING AREAS. BUILT IN BOOKCASE IN 1 LIVING, CEILING FANS THROUGHOUT. NEW CARPET, VINYL & PAINT INSIDE. ADORABLE KITCHEN WITH BREAKFAST AREA, NEW COUNTER TOPS, STAINLESS STEEL SINK, PLENTY OF CABINET SPACE, SPACIOUS BEDROOMS WITH CEILING FANS AND NEW BLINDS. HUGE FENCED BACKYARD WITH PATIO. ROOF REPLACED TWO YEARS AGO.
-
2004-03-04soldstatus
ⓘ Source: listings_history table (triggers on properties + properties_extension) + one-shot
backfill from property_details.listing_events for pre-trigger history.
Tax reassessment forecast TX · Resets to sale price
- Current annual tax
- $5,389 · $449/mo
- Projected year-2 tax
- $5,389 · $449/mo
- Expected delta
- $0/yr ($0/mo · 0.0%)
ⓘ Screening estimate from a state-policy table — verify with the county assessor before closing.
Climate risk First Street
- Flood 1/10 Low FEMA zone X (unshaded) · 0% chance over 30 yrs
- Wildfire 1/10 Low
- Heat 7/10 Severe 7 d/yr ≥109°F today · 25 d/yr by 30 yrs out
- Wind 6/10 Major 27% chance of damaging wind over 30 yrs
- Air quality 2/10 Low 2 unhealthy d/yr today · 2 by 30 yrs out
Nearby sold comps map
Loading sold comps map…
Walkable amenities ~0.75 mi
Loading nearby amenities…
Taxation est. · year 1
- Rental income
- $23,059
- − Mortgage interest
- −$11,758
- − Property taxes
- −$5,389
- − Insurance
- −$1,050
- − Repairs & maintenance
- −$1,845
- − Management
- −$1,845
- − Depreciation
- −$6,106
- Taxable loss
- −$4,932
- Est. tax savings @ 24.0%
- +$1,184
- After-tax cash flow
- $-246/yr
For passive investors: Depreciation is non-cash, so a rental often shows a tax loss while cash-flowing — sheltering income. Rental losses are passive: they offset passive income freely, and up to $25,000/yr can offset ordinary (W-2) income if you actively participate and your MAGI is under $100k (phasing out to $0 by $150k); unused losses carry forward. On sale, claimed depreciation is recaptured at up to 25%, and gains may owe capital-gains tax (a 1031 exchange can defer both). Figures are a year-1 estimate at your 24.0% rate — not tax advice; consult a CPA.
Schools (NCES district)
- District
- Dallas ISD
- NCES district ID
- 4816230
- Math proficiency
- 31% ▼ -16.00%
- Reading proficiency
- 36% ▼ -4.00%
- Median HH income
- $42,881
- Composite
- 28.41/100
- National rank
- #6763
- State rank
- #559 of 826 in TX
Livability — Dallas
- Score
- 81/100
- State rank
- #24
- US rank
- #1380
Category grades
Schools grade is shown separately in the Schools card above.
Census & demographics
- Census place
- Dallas, TX
- County
- Dallas County · 2,612,404 people
- City population
- 1,168,437
- Metro
- Dallas-Fort Worth-Arlington, TX
- Population (ZIP)
- 67,714
- Household income
- $62,667
- Rent vs Own
- Severe rent burden
- 3281.0
Population outlook (Dallas County) Hauer SSP2
- Today (2025)
- 2,979,839 people
- By 2030
- 3,191,823 · +7.1%
- By 2040
- 3,619,611 · +21.5%
- By 2050
- 4,026,915 · +35.1%
- By 2075
- 4,957,073 · +66.4%
- By 2100
- 5,508,725 · +84.9%
Race, ethnicity, and origin ACS 2023
- Neighborhood character
- Diverse neighborhood (Simpson 0.61)
- Race & ethnicity
- Hispanic / Latino 56% Two or more races 32% White 20% Black 19% Asian 2%
- Hispanic origin (detail)
- Mexican 48%
- Common ancestry
- Slovak 1% Lithuanian 1% Italian 1%
- Foreign-born
- 28% · Canada, China, Vietnam
- Languages at home
- 48% English-only · Spanish 48% Vietnamese 1%
Political lean MEDSL · Dallas
- 2024 margin
- Strong D (+22.2) · D 60.2% · R 38.0% · Other 1.8%
- 2008→2024 swing
- +6.9pp toward D · 2008: 15.3pp · 2024: 22.2pp
- All cycles
- 2024: D+22.2 2020: D+31.6 2016: D+26.2 2012: D+15.4 2008: D+15.3
Not yet ingested
- Civics
- —
Market trends
- HPI YoY
- ▼ -319.11%
- Current HPI
- 354.1624
- Rent YoY
- ▼ -4.85%
- Metro
- Dallas-Fort Worth-Arlington, TX
- State GDP YoY
- ▲ 3.95%
- F500 in state
- 110
Industry mix (Fortune 500 HQ in TX)
| Industry | F500 HQs | Revenue |
|---|---|---|
| Energy | 16 | $1,198B |
|
||
| Technology | 5 | $198B |
|
||
| Engineering / Construction | 4 | $72B |
|
||
| Energy Services | 3 | $60B |
|
||
| Utilities | 3 | $41B |
|
||
| Healthcare | 2 | $330B |
|
||
Price history
+175.2% since first listed13 events — show timeline
- 2026-06-01 Price Changed $219,900 NTREIS
- 2026-04-30 Listed $225,000 NTREIS
- 2023-08-16 Rental Removed $1,795 RENTLY
- 2023-08-08 Listed for Rent $1,795 RENTLY
- 2022-02-03 Price Changed $1,650 RENTLY
- 2013-04-09 Sold (Public Records) — Public Records
- 2013-04-05 Sold (MLS) — NTREIS
- 2013-03-25 Pending — NTREIS
- 2013-03-14 Contingent — NTREIS
- 2013-02-21 Price Changed $78,500 NTREIS
- 2013-02-08 Price Changed $79,000 NTREIS
- 2012-12-03 Listed $79,900 NTREIS
- 2004-03-04 Sold (Public Records) — Public Records
Property tax history
+6.2%/yrLatest (2025): $5,389 · -0.4% YoY. Source: county tax records.
Cash-flow waterfall
monthlySold comps — $/sqft
last 12 mo · ≤1 miLoading sold comps…