 6-Plex
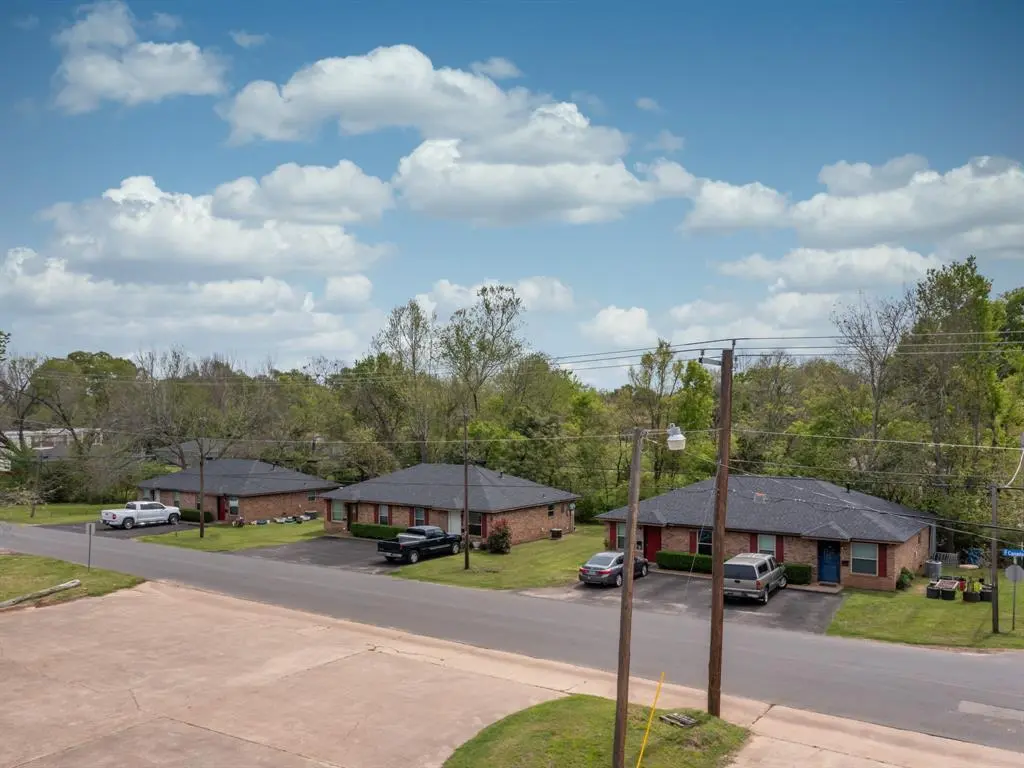
601-611 Canada St · Jacksonville, TX
Flood risk 6/10 · Moderate
- FEMA flood zone
- X (unshaded)
- Chance of flooding over 30 yrs
- 0.74%
- Est. flood insurance / yr
- $507 – $1,088
Fire risk 5/10 · Moderate
- Est. fire insurance / yr
- $1,222 – $2,270
Heat risk 7/10 · Major
- Hot days now (above 109°F)
- 7 days/yr
- Hot days in 30 yrs
- 25 days/yr
Wind risk 6/10 · Moderate
- Chance of severe wind over 30 yrs
- 72.0%
Air-quality risk 1/10 · Minimal
- Unhealthy air days now
- 0 days/yr
- Unhealthy air days in 30 yrs
- 0 days/yr
Risk factors via First Street. Map © Google.
Why this score? — see what drove the D- grade
The composite is a weighted blend of 9 inputs, each scored 0–100. Each bar is that input's sub-score; the figure is the points it added to the 100-point composite (weight × sub-score).
- Cash flow +13.2/30.0
- ARV discount +7.5/15.0
- DSCR +4.0/10.0
- 1% rule +3.7/10.0
- Livability +3.4/5.0
- Schools +2.9/10.0
- Rent growth +2.5/5.0
- Condition / age +2.5/5.0
- Appreciation +0.0/10.0
$585,000
🖨 Deal sheet 📄 Offer letter ✓ Due diligence
Multi-family units
County records classify this as Multi-Family (5+ Unit). Listing-text estimate: 6 units. confirmed
5+ unit building — per-unit beds/baths from public records are typically unavailable; the breakdown below (if shown) is an estimate from the listing text.
Listing remarks MLS
Investment Opportunity in Jacksonville - 3 Duplex Buildings! Don't miss the excellent investment opportunity in the heart of the city. Each of the buildings offer 2 nice sized units with 2 bedrooms and 1 bath. Functional layout with ceramic tile flooring throughout, a comfortable family room, and a galley kitchen. Units are equipped with washer and dryer hookups and include additional interior storage space-ideal for long term tenants. Updates include roofs on all buildings in 2021, windows installed in 2022 and 2023, and asphalt parking pads in 2023. Currently at 100% occupancy. Solid rental potential in a growing market. Whether you're an experienced investor or just getting started, this is a must-see addition to your portfolio.
Key facts
- Galley kitchen
- Roofs updated
- Windows installed
Tags
Neighborhood map
What this means for you Summary
Snapshot
- This is a 6 × 2-bed/1-bath units multifamily listed at $585k.
Deal economics
- At list price, monthly cash flow is $-10 ($-118/yr) — negative. Per door: $-2/mo.
- To cash-flow at today's rent, offer at most $584k (0.2% below list).
- To meet the 1% rule (rent ≥ 1% of price), the offer needs to be $510k (12.7% below list).
- Recommended offer: $510k (12.7% below list) — sets the bar for 1% rule.
- Cap rate 6.3% vs local median 2.0% in Jacksonville — top-decile yield for the area; either an underpriced asset or a hidden risk that comps aren't pricing in. Stress-test before assuming the spread holds.
Location & tenants
- Location reads 68/100 on livability (#452 in TX) — a middle-class / working-renter tenant base. Strengths: cost of living A+, housing A+, health & safety A; Watch: crime D+, schools F, amenities F.
- Jacksonville ISD (town): math 31% / reading 39% proficiency, ranked #534 of 826 in TX (top 65%) — families likely to look elsewhere, expect single-tenant / working-renter base with shorter leases; 75% free/reduced lunch — lower-income household profile, screen leases tightly.
- Market conditions: 282 active listings in the ZIP; 39 units permitted in Cherokee County in 2024 (0 in 5+ unit buildings).
Forward outlook
- Local home prices are declining (-3.0%/yr); year-one equity from $4k of loan paydown is wiped out by about $18k of value loss. Plan a longer hold.
Negotiation context
- It's been on market 92 days — a 9% lower offer ($532k) is reasonable based on typical stale-listing flexibility.
- 3 sale attempts with the ask held roughly flat each time — persistent listings suggest the price (not the market) is what's stuck; bring a comps-based counter.
Risks & watch-outs
- Climate carrying-cost: major flood risk; major wind risk, 72% chance of damaging wind over 30y; moderate wildfire risk; extreme-heat days projected 7→25/yr by 2055 (HVAC capex compounding) — expect insurance premiums to compound above CPI over the hold.
Questions for the listing agent
- What do current leases actually rent for vs. the listed asking? Can we see a recent rent roll and the last 12 months of T-12 income?
- It's been on market 92 days. Have you received any prior offers? Is the seller open to a 13% concession, seller financing, or rate buy-down credit?
- Can we see the unit-by-unit rent roll, current vacancy, and any below-market leases? What's the average tenancy length?
- What capital expenditures (roof, boiler, parking lot, exteriors) have been made in the last 5 years, and what's planned in the next 2?
- Built in 1976 — when were the roof, HVAC, electrical panel, plumbing, and water heater last replaced?
- Why hasn't it sold? Are there any deal-killer items the seller is aware of (foundation, flood, title, zoning, code violations)?
- Is there a deadline driving the sale (1031 exchange, divorce, estate, relocation)? That informs how much negotiation room exists.
- Schools are F-rated, which usually means shorter tenancies and higher turnover. Who's the typical renter profile here, and what's been the actual vacancy rate?
- Crime grade is D in this area — have there been break-ins, vandalism, or insurance claims at this property in the last 3 years? What carrier currently insures it and at what premium?
- The area grade is low — what's the realistic commute time and amenity access for the typical tenant pool here? Any planned neighborhood developments (good or bad) we should know about?
- What's the average days-on-market for RENTAL listings here right now (not sales)? A rising rental-DOM trend means longer vacancies and softer asking-rent achievability than the comps imply.
- What's the recent tenant-quality profile in this submarket — average credit score on applications, eviction rate, late-payment / NSF rate, and stable-employment percentage? A property-management company in the area should have these aggregated.
- How much new apartment / multifamily construction is in the pipeline within 1–3 miles? Heavy new supply (>2% of stock underway) typically softens rents 12–24 months out; light construction supports rent growth.
Investment metrics
- 1% rule
- 0.87% ✗
- Cap rate
- 6.27%
- Cash-on-cash
- -0.07%
- DSCR
- 1.00
- GRM
- 9.5
CMA / ARV
No comps found within radius.
Projected returns pro-forma
-3.0% appreciation · 3.0% rent growth · sell at horizon
- IRR
- -16.4%
- Equity multiple
- 0.42×
- Total profit
- $-95,346
- Equity at exit
- $87,225
- IRR
- -8.1%
- Equity multiple
- 0.49×
- Total profit
- $-83,520
- Equity at exit
- $50,580
Cash invested: $163,800 (down + closing). Projections, not guarantees.
Landlord ↔ Tenant lean methodology
- Overall (STATE)
- 87 Strongly Landlord-Friendly
- State Texas
- 87 Strongly Landlord-Friendly · R+5
- County
- — inherits STATE
- City
- — inherits STATE
ZIP-level market 75766
- Home prices YoY
- -16.5%
- Active inventory
- 282
- Price-to-rent
- 57.3×
Monthly cashflow live
- Estimated rent
- $5,105 high interval (Pro) →
- Mortgage (P&I)
- −$3,068
- Tax est. 1.5%
- −$731 /mo · $8,775/yr
- Insurance
- −$244
- HOA
- −$0
- Vacancy / Maint / Mgmt
- −$1,072
- Net cashflow
- $-10
Break-even live
6-unit breakdown (identical units grouped — click to expand)
| Units | Beds | Baths | Est. rent |
|---|---|---|---|
| 6× units | 2 | 1 | $5,106 |
| #1 | 2 | 1 | $851 |
| #2 | 2 | 1 | $851 |
| #3 | 2 | 1 | $851 |
| #4 | 2 | 1 | $851 |
| #5 | 2 | 1 | $851 |
| #6 | 2 | 1 | $851 |
| Total (6 units) | $5,105 | ||
UW: 25.0% down · 7.5% · 30yr · 1.5% tax · 5.0% vac · 8.0% maint · 8.0% mgmt
Financing live
Cash to close
- Down payment
- $146,250
- Closing costs
- $17,550
- Reserves months
- —
- Total cash needed
- —
Loan-product check · same deal, 3 products live
Conventional
25% down · 7.5% · 30yr
- Down + closing
- —
- Monthly P&I
- —
- Monthly cashflow
- —
- DSCR
- —
- Eligible?
- —
Personal DTI + credit; lowest rate.
DSCR
20% down · 8.5% · 30yr
- Down + closing
- —
- Monthly P&I
- —
- Monthly cashflow
- —
- DSCR
- —
- Eligible?
- —
No personal income docs; deal must DSCR.
Hard money
10% down · 12.0% · 12mo
- Down + closing
- —
- Monthly P&I
- —
- Monthly cashflow
- —
- DSCR
- —
- Eligible?
- —
Short-term bridge; refi at stabilization.
Listing history 19 events
-
2026-06-19days on market $585,000 Active 92 DOM
-
2026-06-18days on market $585,000 Active 91 DOM
-
2026-06-17days on market $585,000 Active 90 DOM
-
2026-06-16days on market $585,000 Active 89 DOM
-
2026-06-15days on market $585,000 Active 88 DOM
-
2026-06-14days on market $585,000 Active 86 DOM
-
2026-06-12days on market $585,000 Active 85 DOM
-
2026-06-09days on market $585,000 Active 82 DOM
-
2026-06-08days on market $585,000 Active 81 DOM
-
2026-06-07days on market $585,000 Active 80 DOM
-
2026-06-04days on market $585,000 Active 76 DOM
-
2026-06-02days on market $585,000 Active 75 DOM
-
2026-06-01days on market $585,000 Active 74 DOM
-
2026-05-31days on market $585,000 Active 73 DOM
-
2026-05-31days on market $585,000 Active 72 DOM
-
2026-03-19$599,900 Active 741-char remark
Show marketing remark (741 chars)
Investment Opportunity in Jacksonville - 3 Duplex Buildings! Don't miss the excellent investment opportunity in the heart of the city. Each of the buildings offer 2 nice sized units with 2 bedrooms and 1 bath. Functional layout with ceramic tile flooring throughout, a comfortable family room, and a galley kitchen. Units are equipped with washer and dryer hookups and include additional interior storage space-ideal for long term tenants. Updates include roofs on all buildings in 2021, windows installed in 2022 and 2023, and asphalt parking pads in 2023. Currently at 100% occupancy. Solid rental potential in a growing market. Whether you're an experienced investor or just getting started, this is a must-see addition to your portfolio.
-
2025-11-19historical
-
2025-05-19$630,000 Active
ⓘ Source: listings_history table (triggers on properties + properties_extension) + one-shot
backfill from property_details.listing_events for pre-trigger history.
Climate risk First Street
- Flood 6/10 Major FEMA zone X (unshaded) · 74% chance over 30 yrs
- Wildfire 5/10 Major
- Heat 7/10 Severe 7 d/yr ≥109°F today · 25 d/yr by 30 yrs out
- Wind 6/10 Major 72% chance of damaging wind over 30 yrs
- Air quality 1/10 Low 0 unhealthy d/yr today · 0 by 30 yrs out
Nearby sold comps map
Loading sold comps map…
Walkable amenities ~0.75 mi
Loading nearby amenities…
Taxation est. · year 1
- Rental income
- $61,260
- − Mortgage interest
- −$32,769
- − Property taxes
- −$8,775
- − Insurance
- −$2,925
- − Repairs & maintenance
- −$4,901
- − Management
- −$4,901
- − Depreciation
- −$17,018
- Taxable loss
- −$10,029
- Est. tax savings @ 24.0%
- +$2,407
- After-tax cash flow
- $2,289/yr
For passive investors: Depreciation is non-cash, so a rental often shows a tax loss while cash-flowing — sheltering income. Rental losses are passive: they offset passive income freely, and up to $25,000/yr can offset ordinary (W-2) income if you actively participate and your MAGI is under $100k (phasing out to $0 by $150k); unused losses carry forward. On sale, claimed depreciation is recaptured at up to 25%, and gains may owe capital-gains tax (a 1031 exchange can defer both). Figures are a year-1 estimate at your 24.0% rate — not tax advice; consult a CPA.
Schools (NCES district)
- District
- Jacksonville ISD
- NCES district ID
- 4824590
- Math proficiency
- 31% ▼ -6.00%
- Reading proficiency
- 39% ▲ 1.00%
- Median HH income
- $37,097
- Composite
- 29.09/100
- National rank
- #6598
- State rank
- #534 of 826 in TX
Livability — Jacksonville
- Score
- 68/100
- State rank
- #452
- US rank
- #9160
Category grades
Schools grade is shown separately in the Schools card above.
Census & demographics
- Census place
- Jacksonville, TX
- City population
- 25,988
- Population (ZIP)
- 25,988
Population outlook (Cherokee County) Hauer SSP2
- Today (2025)
- 51,949 people
- By 2030
- 51,984 · +0.1%
- By 2040
- 51,780 · -0.3%
- By 2050
- 51,085 · -1.7%
- By 2075
- 47,418 · -8.7%
- By 2100
- 39,464 · -24.0%
Race, ethnicity, and origin ACS 2023
- Neighborhood character
- Diverse neighborhood (Simpson 0.61)
- Race & ethnicity
- White 53% Hispanic / Latino 31% Two or more races 16% Black 12% Native American 2%
- Hispanic origin (detail)
- Mexican 29%
- Common ancestry
- Slovak 1% Lithuanian 1% Serbian 1%
- Foreign-born
- 12% · Canada
- Languages at home
- 74% English-only · Spanish 26% Tagalog/Filipino 1%
Political lean MEDSL · Cherokee
- 2024 margin
- Solid R (+62.7) · D 18.3% · R 80.9%
- 2008→2024 swing
- -19.5pp toward R · 2008: -43.2pp · 2024: -62.7pp
- All cycles
- 2024: R+62.7 2020: R+55.8 2016: R+56.5 2012: R+51.0 2008: R+43.2
Not yet ingested
- Civics
- —
Market trends
- HPI YoY
- ▼ -38.95%
- Current HPI
- 197.5972
- Rent YoY
- —
- Metro
- —
- State GDP YoY
- ▲ 3.95%
- F500 in state
- 110
Industry mix (Fortune 500 HQ in TX)
| Industry | F500 HQs | Revenue |
|---|---|---|
| Energy | 16 | $1,198B |
|
||
| Technology | 5 | $198B |
|
||
| Engineering / Construction | 4 | $72B |
|
||
| Energy Services | 3 | $60B |
|
||
| Utilities | 3 | $41B |
|
||
| Healthcare | 2 | $330B |
|
||
Price history
-4.8% since first listed4 events — show timeline
- 2026-03-19 Listed $599,900 NTREIS
- 2026-03-19 Listed $599,900 GTAR
- 2025-11-19 Listing Removed — NTREIS
- 2025-05-19 Listed $630,000 NTREIS
Cash-flow waterfall
monthlySold comps — $/sqft
last 12 mo · ≤1 miLoading sold comps…