446 Spring Dr · Stanardsville, VA
Flood risk 1/10 · Minimal
- FEMA flood zone
- X (unshaded)
- Chance of flooding over 30 yrs
- 0.0%
- Est. flood insurance / yr
- $507 – $1,088
Fire risk 6/10 · Moderate
- Est. fire insurance / yr
- $666 – $1,236
Heat risk 4/10 · Minor
- Hot days now (above 101°F)
- 7 days/yr
- Hot days in 30 yrs
- 16 days/yr
Wind risk 2/10 · Minimal
- Chance of severe wind over 30 yrs
- 1.0%
Air-quality risk 1/10 · Minimal
- Unhealthy air days now
- 0 days/yr
- Unhealthy air days in 30 yrs
- 0 days/yr
Risk factors via First Street. Map © Google.
Why this score? — see what drove the D- grade
The composite is a weighted blend of 9 inputs, each scored 0–100. Each bar is that input's sub-score; the figure is the points it added to the 100-point composite (weight × sub-score).
- Cash flow +10.7/30.0
- ARV discount +10.4/15.0
- Schools +4.5/10.0
- Livability +3.5/5.0
- DSCR +3.1/10.0
- Rent growth +2.5/5.0
- Condition / age +2.5/5.0
- 1% rule +1.9/10.0
- Appreciation +0.0/10.0
$275,000
🖨 Deal sheet 📄 Offer letter ✓ Due diligence
Listing remarks
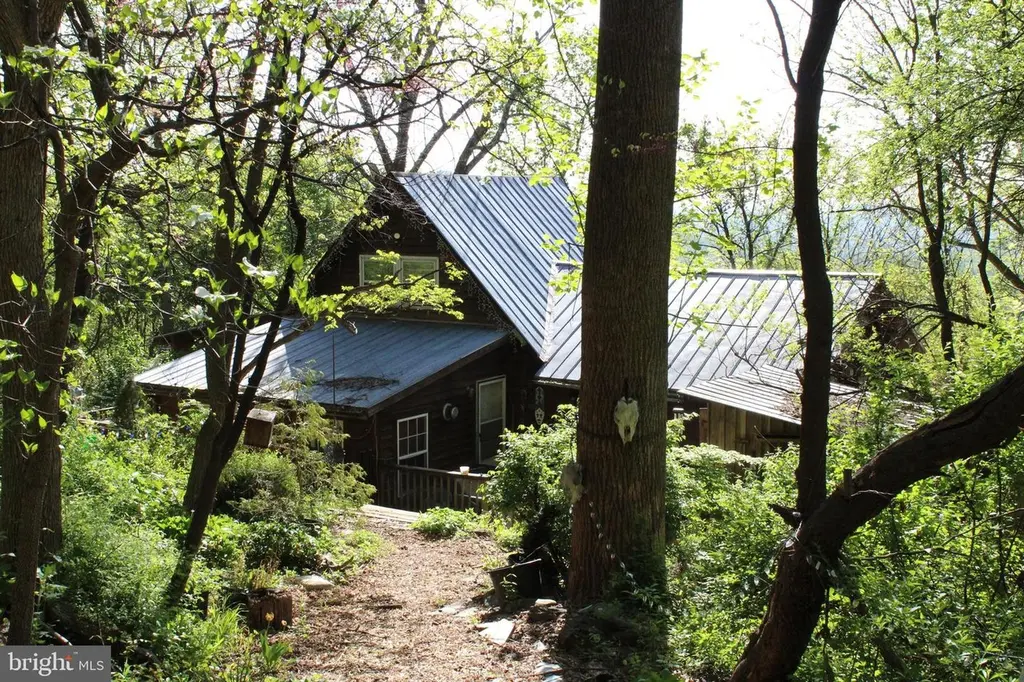
Charming Mountain Retreat on 9.25 Acres within a stones throw from Rapidan Wildlife Management land and the Shenandoah National Park! This cabin has been loved by this owner and family a very long time, and is used as a full time residence. This property has mountain views, very established flower gardens and fish pond are just some of the highlights outdoors. It is on a dead end drive, so privacy, comfort and seclusion is at it's best here! Inside there are 4 possible bedrooms, a laundry room, bathroom, living room and eat in kitchen. Decks all around, even off of the Master Bedroom! Lots of windows to let the fresh mountain air in. Community Pond. 4 wheel drive, AWD or FWD vehicle wit
Key facts
- 9.25 acre lot
- Built 1971
- Listed 55 days
Property features AI
Finance
- Other: Fee simple ownership; Not in a federal flood zone; Additional parcels included: two parcels (6.15 acres and 3.10 acres) being sold together
Exterior
- Parking: Driveway
- Utilities: Well water; Gravity septic field; Propane for hot water; Propane utility; No municipal trash service
- Home design: Detached property; Above-grade finished area recorded by assessor
- Construction: Cedar construction; Shingle and metal roof; Pillar/post/pier foundation; Building not winterized; Year built source: Assessor
- Exterior features: Mountainous lot; Secluded setting; Trees/wooded
Interior
- Kitchen: Oven/Range - Gas; Refrigerator; Exhaust fan
- Bedrooms: 2 bedrooms on main level; 2 bedrooms on 1st upper level
- Flooring: Carpet; Wood floors
- Bathrooms: 1 full bathroom on main level; 1 full bathroom total
- Heating & cooling: Wood burning stove; Other heating; Propane (leased) heating fuel; Window cooling units (electric)
- Interior features: Carpet; Ceiling fan(s); Family room off kitchen; Floor plan - Traditional; Eat-in kitchen; Kitchen island; Wood stove; Wood floors; Entry-level bedroom
- Laundry & utility: Washer in unit; Dryer in unit; Washer on main floor; Dryer on main floor; Water heater
Neighborhood map
What this means for you Summary
Snapshot
- This is a 2-bed/1.0-bath single-family listed at $275k.
Deal economics
- At list price, monthly cash flow is $-131 ($-2k/yr) — negative.
- To cash-flow at today's rent, offer at most $252k (8.4% below list).
- To meet the 1% rule (rent ≥ 1% of price), the offer needs to be $189k (31.1% below list).
- Recommended offer: $189k (31.1% below list) — sets the bar for 1% rule.
- Cap rate 5.7% vs local median 4.8% in Stanardsville — meaningfully above typical; check what's discounted (condition, days-on-market, listing class) to confirm the premium yield is real.
Location & tenants
- Location reads 69/100 on livability (#243 in VA) — a middle-class / working-renter tenant base. Strengths: health & safety A+, schools A-, cost of living A-; Watch: employment D+, amenities F, commute F.
- Greene County Public School District (town): math 40% / reading 64% proficiency, ranked #88 of 131 in VA (top 67%) — acceptable for families but not a draw, mixed tenant base, ~2y average lease.
- Market conditions: 83 active listings in the ZIP; 204 units permitted in Greene County in 2024 (34 in 5+ unit buildings).
Forward outlook
- Local home prices are declining (-3.0%/yr); year-one equity from $2k of loan paydown is wiped out by about $8k of value loss. Plan a longer hold.
- Greene County population projected at +6% by 2050 — modest demand growth; plan on rents tracking national, not racing it.
Negotiation context
- It's been on market 56 days — a 3% lower offer ($267k) is reasonable based on typical stale-listing flexibility.
Risks & watch-outs
- Climate carrying-cost: major wildfire risk — expect insurance premiums to compound above CPI over the hold.
Questions for the listing agent
- What do current leases actually rent for vs. the listed asking? Can we see a recent rent roll and the last 12 months of T-12 income?
- It's been on market 56 days. Have you received any prior offers? Is the seller open to a 31% concession, seller financing, or rate buy-down credit?
- Built in 1971 — when were the roof, HVAC, electrical panel, plumbing, and water heater last replaced?
- Is there a deadline driving the sale (1031 exchange, divorce, estate, relocation)? That informs how much negotiation room exists.
- Schools are A-rated — typically a magnet for longer-tenancy family renters. What's the average tenant stay here, and is there a school-zone premium baked into asking?
- The area grade is low — what's the realistic commute time and amenity access for the typical tenant pool here? Any planned neighborhood developments (good or bad) we should know about?
- What's the average days-on-market for RENTAL listings here right now (not sales)? A rising rental-DOM trend means longer vacancies and softer asking-rent achievability than the comps imply.
- What's the recent tenant-quality profile in this submarket — average credit score on applications, eviction rate, late-payment / NSF rate, and stable-employment percentage? A property-management company in the area should have these aggregated.
- How much new for-sale + rental construction is in the pipeline within 1–3 miles? Heavy new supply typically softens prices + rents 12–24 months out; constrained supply supports both.
Investment metrics
- 1% rule
- 0.69% ✗
- Cap rate
- 5.72%
- Cash-on-cash
- -2.05%
- DSCR
- 0.91
- GRM
- 12.1
CMA / ARV
- ARV (median comp)
- $293,746
- List price
- $275,000
- Delta
- -6.38%
- Verdict
- FAIR
- Comps
- 2 within 1.0 mi
Show comp detail 1 sale within ~0.75 mi
| Address | Dist | Beds/Ba | Sqft | Sold | Price | $/sf | Match |
|---|---|---|---|---|---|---|---|
| 152 Mae Dr | 0.41mi | 2/1.0 | 1,120 (+11%) | 22mo | $325,000 | $290 | 44 |
Match score weights: distance 35% · size 25% · config 20% · recency 20%. Top-matched comps best support the ARV.
Projected returns pro-forma
-3.0% appreciation · 3.0% rent growth · sell at horizon
- IRR
- -19.8%
- Equity multiple
- 0.31×
- Total profit
- $-53,068
- Equity at exit
- $41,003
- IRR
- -12.7%
- Equity multiple
- 0.25×
- Total profit
- $-57,550
- Equity at exit
- $23,777
Cash invested: $77,000 (down + closing). Projections, not guarantees.
Landlord ↔ Tenant lean methodology
- Overall (STATE)
- 55 Moderately Landlord-Leaning
- State Virginia
- 55 Moderately Landlord-Leaning · D+2
- County
- — inherits STATE
- City
- — inherits STATE
ZIP-level market 22973
- Home prices YoY
- -25.3%
- Active inventory
- 83
- Price-to-rent
- 12.1×
Monthly cashflow live
- Estimated rent
- $1,893 medium interval (Pro) →
- Mortgage (P&I)
- −$1,442
- Tax from tax record
- −$70 /mo · $845/yr
- Insurance
- −$115
- HOA
- −$0
- Vacancy / Maint / Mgmt
- −$398
- Net cashflow
- $-131
Break-even live
UW: 25.0% down · 7.5% · 30yr · 1.5% tax · 5.0% vac · 8.0% maint · 8.0% mgmt
Financing live
Cash to close
- Down payment
- $68,750
- Closing costs
- $8,250
- Reserves months
- —
- Total cash needed
- —
Loan-product check · same deal, 3 products live
Conventional
25% down · 7.5% · 30yr
- Down + closing
- —
- Monthly P&I
- —
- Monthly cashflow
- —
- DSCR
- —
- Eligible?
- —
Personal DTI + credit; lowest rate.
DSCR
20% down · 8.5% · 30yr
- Down + closing
- —
- Monthly P&I
- —
- Monthly cashflow
- —
- DSCR
- —
- Eligible?
- —
No personal income docs; deal must DSCR.
Hard money
10% down · 12.0% · 12mo
- Down + closing
- —
- Monthly P&I
- —
- Monthly cashflow
- —
- DSCR
- —
- Eligible?
- —
Short-term bridge; refi at stabilization.
Listing history 18 events
-
2026-06-19days on market $275,000 Active 56 DOM
-
2026-06-18days on market $275,000 Active 55 DOM
-
2026-06-17days on market $275,000 Active 54 DOM
-
2026-06-16days on market $275,000 Active 53 DOM
-
2026-06-15days on market $275,000 Active 52 DOM
-
2026-06-14days on market $275,000 Active 50 DOM
-
2026-06-13days on market $275,000 Active 49 DOM
-
2026-06-10days on market $275,000 Active 47 DOM
-
2026-06-09days on market $275,000 Active 46 DOM
-
2026-06-08days on market $275,000 Active 45 DOM
-
2026-06-07days on market $275,000 Active 44 DOM
-
2026-06-05days on market $275,000 Active 41 DOM
-
2026-06-03days on market $275,000 Active 40 DOM
-
2026-06-02days on market $275,000 Active 39 DOM
-
2026-06-01days on market $275,000 Active 38 DOM
-
2026-05-31days on market $275,000 Active 37 DOM
-
2026-05-30days on market $275,000 Active 36 DOM
-
2026-04-24$275,000 Active 754-char remark
ⓘ Source: listings_history table (triggers on properties + properties_extension) + one-shot
backfill from property_details.listing_events for pre-trigger history.
Tax reassessment forecast VA · Resets to sale price
- Current annual tax
- $845 · $70/mo
- Projected year-2 tax
- $2,255 · $188/mo
- Expected delta
- +$1,410/yr (+$117/mo · 166.8%)
ⓘ Screening estimate from a state-policy table — verify with the county assessor before closing.
Climate risk First Street
- Flood 1/10 Low FEMA zone X (unshaded) · 0% chance over 30 yrs
- Wildfire 6/10 Major
- Heat 4/10 Moderate 7 d/yr ≥101°F today · 16 d/yr by 30 yrs out
- Wind 2/10 Low 100% chance of damaging wind over 30 yrs
- Air quality 1/10 Low 0 unhealthy d/yr today · 0 by 30 yrs out
Nearby sold comps map
Loading sold comps map…
Walkable amenities ~0.75 mi
Loading nearby amenities…
Taxation est. · year 1
- Rental income
- $22,721
- − Mortgage interest
- −$15,404
- − Property taxes
- −$845
- − Insurance
- −$1,375
- − Repairs & maintenance
- −$1,818
- − Management
- −$1,818
- − Depreciation
- −$8,000
- Taxable loss
- −$6,539
- Est. tax savings @ 24.0%
- +$1,569
- After-tax cash flow
- $-7/yr
For passive investors: Depreciation is non-cash, so a rental often shows a tax loss while cash-flowing — sheltering income. Rental losses are passive: they offset passive income freely, and up to $25,000/yr can offset ordinary (W-2) income if you actively participate and your MAGI is under $100k (phasing out to $0 by $150k); unused losses carry forward. On sale, claimed depreciation is recaptured at up to 25%, and gains may owe capital-gains tax (a 1031 exchange can defer both). Figures are a year-1 estimate at your 24.0% rate — not tax advice; consult a CPA.
Schools (NCES district)
- District
- Greene County Public School District
- NCES district ID
- 5101710
- Math proficiency
- 40% ▼ -37.00%
- Reading proficiency
- 64% ▼ -7.00%
- Median HH income
- $59,129
- Composite
- 45.22/100
- National rank
- #2668
- State rank
- #88 of 131 in VA
Livability — Stanardsville
- Score
- 69/100
- State rank
- #243
- US rank
- #8223
Category grades
Schools grade is shown separately in the Schools card above.
Census & demographics
- Population (ZIP)
- 5,980
Population outlook (Greene County) Hauer SSP2
- Today (2025)
- 20,465 people
- By 2030
- 20,958 · +2.4%
- By 2040
- 21,619 · +5.6%
- By 2050
- 21,699 · +6.0%
- By 2075
- 21,656 · +5.8%
- By 2100
- 20,156 · -1.5%
Race, ethnicity, and origin ACS 2023
- Neighborhood character
- Predominantly White (82%)
- Race & ethnicity
- White 82% Two or more races 9% Black 6% Hispanic / Latino 4% Asian 2%
- Common ancestry
- Italian 3% Romanian 2% Serbian 2%
- Foreign-born
- 3% · Canada, China
- Languages at home
- 96% English-only · Spanish 2% German/W. Germanic 1%
Political lean MEDSL · Greene
- 2024 margin
- Strong R (+24.7) · D 37.0% · R 61.7% · Other 1.2%
- 2008→2024 swing
- -2.9pp toward R · 2008: -21.9pp · 2024: -24.7pp
- All cycles
- 2024: R+24.7 2020: R+23.9 2016: R+31.8 2012: R+25.3 2008: R+21.9
Not yet ingested
- Civics
- —
Market trends
- HPI YoY
- ▼ -61.51%
- Current HPI
- 181.8265
- Rent YoY
- —
- Metro
- —
- State GDP YoY
- ▲ 2.40%
- F500 in state
- 50
Industry mix (Fortune 500 HQ in VA)
| Industry | F500 HQs | Revenue |
|---|---|---|
| Aerospace / Defense | 4 | $236B |
|
||
| Technology / Defense | 3 | $32B |
|
||
| Financial Services | 2 | $176B |
|
||
| Utilities | 2 | $27B |
|
||
| Insurance | 2 | $25B |
|
||
| Technology | 2 | $15B |
|
||
Price history
1 event — show timeline
- 2026-04-24 Listed $275,000 BRIGHT MLS
Property tax history
+1.2%/yrLatest (2025): $845 · +0.7% YoY. Source: county tax records.
Cash-flow waterfall
monthlySold comps — $/sqft
last 12 mo · ≤1 miLoading sold comps…