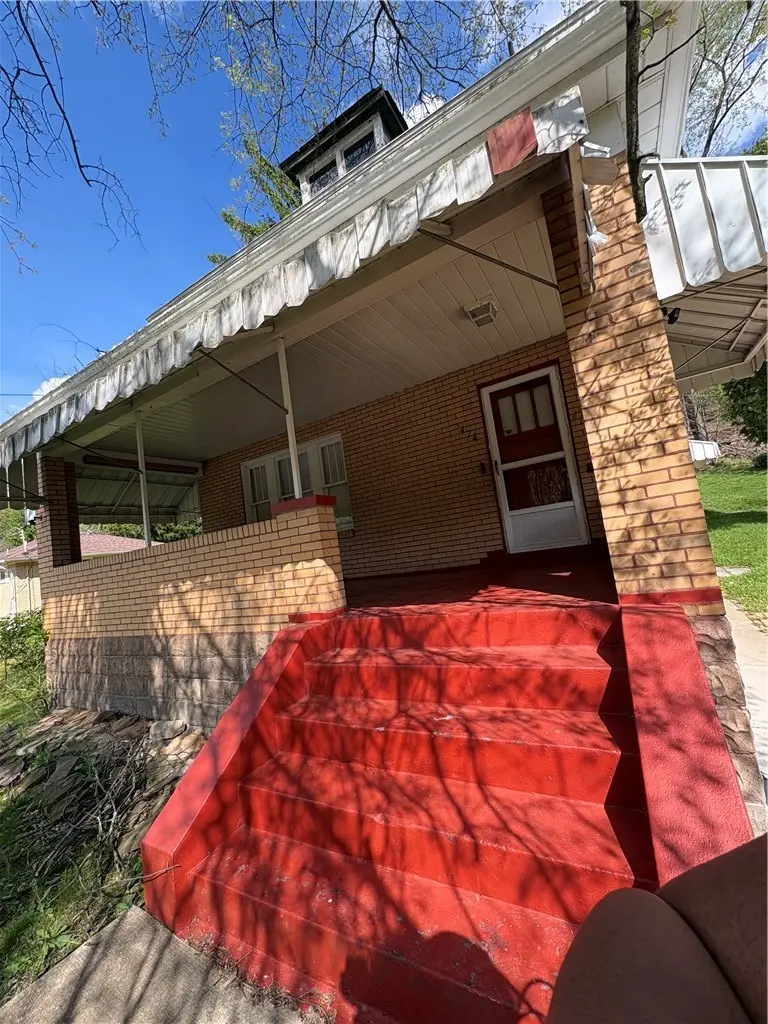
474 Hochberg Rd · Penn Hills, PA
Flood risk 1/10 · Minimal
- FEMA flood zone
- X (unshaded)
- Chance of flooding over 30 yrs
- 0.0%
- Est. flood insurance / yr
- $473 – $860
Fire risk 1/10 · Minimal
- Est. fire insurance / yr
- $511 – $949
Heat risk 3/10 · Minor
- Hot days now (above 96°F)
- 6 days/yr
- Hot days in 30 yrs
- 15 days/yr
Wind risk 2/10 · Minimal
- Chance of severe wind over 30 yrs
- 0.0%
Air-quality risk 4/10 · Minor
- Unhealthy air days now
- 5 days/yr
- Unhealthy air days in 30 yrs
- 7 days/yr
Risk factors via First Street. Map © Google.
Why this score? — see what drove the D grade
The composite is a weighted blend of 9 inputs, each scored 0–100. Each bar is that input's sub-score; the figure is the points it added to the 100-point composite (weight × sub-score).
- Cash flow +17.2/30.0
- ARV discount +5.7/15.0
- DSCR +5.4/10.0
- Rent growth +4.4/5.0
- 1% rule +4.3/10.0
- Livability +2.5/5.0
- Condition / age +2.5/5.0
- Schools +1.6/10.0
- Appreciation +0.0/10.0
$164,900
🖨 Deal sheet 📄 Offer letter ✓ Due diligence
Listing remarks
Welcome to this spacious and family friendly home offering a flexible layout and plenty of room to grow! The first floor features a comfortable living room, dining room, and kitchen, perfect for everyday living and gatherings. The second floor includes two bedrooms and an additional room that can be used as a home office, playroom, or a potential third bedroom. The third floor features two multi-purpose rooms that can be used for hobbies, storage, or additional living space. The lot is included with the home, providing outdoor space for relaxation, play, or future possibilities. A great opportunity to make this home your own and create lasting memories! A one-year Home Warranty system pa
Key facts
- Multi-purpose rooms
- Flexible layout
- Outdoor space
Tags
Property features AI
Finance
- Financial info: Assessed value noted; Annual tax amount noted
Exterior
- Home design: 2-story residence; Resale property; Home warranty included
- Exterior features: Lot approximately 0.177 acres
Interior
- Kitchen: Kitchen on main level — 13 x 9
- Bedrooms: Bedroom (upper level) — 11 x 12; Additional bedroom (upper level) — 12 x 13
- Bathrooms: 1 full bathroom
- Interior features: Total of 6 rooms; Bonus room on upper level
Neighborhood map
What this means for you Summary
Snapshot
- This is a 2-bed/1.0-bath single-family listed at $165k.
Deal economics
- At list price, monthly cash flow is $119 ($1k/yr) — positive.
- The deal already cash-flows at list — no discount required.
- To meet the 1% rule (rent ≥ 1% of price), the offer needs to be $153k (7.1% below list).
- Recommended offer: $153k (7.1% below list) — sets the bar for 1% rule.
Location & tenants
- Location reads: area grade D — affects rentability + tenant quality, not the cash-flow math above.
- Penn Hills SD (suburban): math 13% / reading 24% proficiency, ranked #496 of 539 in PA (top 92%) — low school quality limits family demand, transient renter base, plan for 1-2y turnover.
- Market conditions: Rents rising fast (+7.6%/yr); 129 active listings in the ZIP; 19 comparable units currently listed for rent nearby; rentals at typical pace (median 14d on market — plan ~3-4 weeks tenant-placement turnaround); 2,996 units permitted in Allegheny County in 2024 (1,588 in 5+ unit buildings).
Forward outlook
- Local home prices are declining (-3.0%/yr); year-one equity from $1k of loan paydown is wiped out by about $5k of value loss. Plan a longer hold.
Negotiation context
- It's been on market 52 days — a 3% lower offer ($160k) is reasonable based on typical stale-listing flexibility.
- Current owner paid $44k; list at $165k implies a 279% gain — meaningful room to come down on a strong offer.
Risks & watch-outs
- Watch-outs: built in 1928 — expect roof / HVAC / electrical / plumbing capex.
Questions for the listing agent
- It's been on market 52 days. Have you received any prior offers? Is the seller open to a 7% concession, seller financing, or rate buy-down credit?
- Built in 1928 — when were the roof, HVAC, electrical panel, plumbing, and water heater last replaced?
- Is there a deadline driving the sale (1031 exchange, divorce, estate, relocation)? That informs how much negotiation room exists.
- The area grade is low — what's the realistic commute time and amenity access for the typical tenant pool here? Any planned neighborhood developments (good or bad) we should know about?
- What's the average days-on-market for RENTAL listings here right now (not sales)? A rising rental-DOM trend means longer vacancies and softer asking-rent achievability than the comps imply.
- What's the recent tenant-quality profile in this submarket — average credit score on applications, eviction rate, late-payment / NSF rate, and stable-employment percentage? A property-management company in the area should have these aggregated.
- How much new for-sale + rental construction is in the pipeline within 1–3 miles? Heavy new supply typically softens prices + rents 12–24 months out; constrained supply supports both.
Investment metrics
- 1% rule
- 0.93% ✗
- Cap rate
- 7.16%
- Cash-on-cash
- 3.10%
- DSCR
- 1.14
- GRM
- 9.0
CMA / ARV
- ARV (median comp)
- $158,624
- List price
- $164,900
- Delta
- 3.96%
- Verdict
- FAIR
- Comps
- 20 within 1.0 mi
Show comp detail 12 sales within ~0.75 mi
| Address | Dist | Beds/Ba | Sqft | Sold | Price | $/sf | Match |
|---|---|---|---|---|---|---|---|
| 162 Conestoga Rd | 0.09mi | 3/2.0 (+1) | 1,435 (-8%) | 4mo | $185,500 | $129 | 70 |
| 2173 Sampson St | 0.31mi | 3/1.0 (+1) | 1,714 (+10%) | 3mo | $160,000 | $93 | 61 |
| 8527 Westwood Rd | 0.61mi | 3/1.0 (+1) | 1,528 (-2%) | 4mo | $156,000 | $102 | 60 |
| 8952 Eastwood Rd | 0.28mi | 3/2.0 (+1) | 1,714 (+10%) | 2mo | $245,000 | $143 | 59 |
| 409 Grove Rd | 0.47mi | 3/1.5 (+1) | 1,450 (-7%) | 4mo | $232,000 | $160 | 57 |
| 200 Champa St | 0.26mi | 3/3.0 (+1) | 1,756 (+13%) | 4mo | $130,000 | $74 | 50 |
| 2534 Graham Blvd | 0.57mi | 3/2.5 (+1) | 1,680 (+8%) | 1mo | $340,000 | $202 | 48 |
| 451 Grove Rd | 0.58mi | 3/1.5 (+1) | 1,412 (-9%) | 5mo | $164,900 | $117 | 46 |
| 1871 Atkinson Pl | 0.74mi | 3/1.0 (+1) | 1,700 (+9%) | 1mo | $240,000 | $141 | 44 |
| 7841 Mark Dr | 0.54mi | 3/2.0 (+1) | 1,350 (-13%) | 1mo | $214,000 | $159 | 43 |
| 7720 Mark Dr | 0.69mi | 3/2.5 (+1) | 1,418 (-9%) | 5mo | $235,000 | $166 | 38 |
| 8250 Aber Rd | 0.73mi | 3/2.0 (+1) | 1,364 (-12%) | 1mo | $220,000 | $161 | 36 |
Match score weights: distance 35% · size 25% · config 20% · recency 20%. Top-matched comps best support the ARV.
Projected returns pro-forma
-3.0% appreciation · 7.63% rent growth · sell at horizon
- IRR
- -6.5%
- Equity multiple
- 0.75×
- Total profit
- $-11,671
- Equity at exit
- $24,587
- IRR
- 7.9%
- Equity multiple
- 1.72×
- Total profit
- $33,307
- Equity at exit
- $14,258
Cash invested: $46,172 (down + closing). Projections, not guarantees.
Landlord ↔ Tenant lean methodology
- Overall (STATE)
- 62 Landlord-Friendly
- State Pennsylvania
- 62 Landlord-Friendly · EVEN
- County
- — inherits STATE
- City
- — inherits STATE
ZIP-level market 15235
- Home prices YoY
- -34.1%
- Rents YoY
- 7.6%
- Active inventory
- 129
- Price-to-rent
- 9.0×
Monthly cashflow live
- Estimated rent
- $1,532 high interval (Pro) →
- Mortgage (P&I)
- −$865
- Tax from tax record
- −$157 /mo · $1,889/yr
- Insurance
- −$69
- HOA
- −$0
- Vacancy / Maint / Mgmt
- −$322
- Net cashflow
- $119
Break-even live
UW: 25.0% down · 7.5% · 30yr · 1.5% tax · 5.0% vac · 8.0% maint · 8.0% mgmt
Financing live
Cash to close
- Down payment
- $41,225
- Closing costs
- $4,947
- Reserves months
- —
- Total cash needed
- —
Loan-product check · same deal, 3 products live
Conventional
25% down · 7.5% · 30yr
- Down + closing
- —
- Monthly P&I
- —
- Monthly cashflow
- —
- DSCR
- —
- Eligible?
- —
Personal DTI + credit; lowest rate.
DSCR
20% down · 8.5% · 30yr
- Down + closing
- —
- Monthly P&I
- —
- Monthly cashflow
- —
- DSCR
- —
- Eligible?
- —
No personal income docs; deal must DSCR.
Hard money
10% down · 12.0% · 12mo
- Down + closing
- —
- Monthly P&I
- —
- Monthly cashflow
- —
- DSCR
- —
- Eligible?
- —
Short-term bridge; refi at stabilization.
Rent comps 19 comps
| Address | Beds | Baths | Sqft | Rent | $/sqft | DOM | Units | Dist |
|---|---|---|---|---|---|---|---|---|
| 8918 Frankstown Rd Pittsburgh, PA | 3.0 | 1.0 | 1400 | $1,907 | $1.36 | 14d | 1 | 0.30mi |
| 103 Grove Rd Verona, PA | 3.0 | 1.5 | 1460 | $1,450 | $0.99 | 12d | 1 | 0.30mi |
| 216 Grove Rd Verona, PA | 3.0 | 1.0 | 1165 | $1,550 | $1.33 | 43d | 1 | 0.37mi |
| 8612 Oakcrest Rd Pittsburgh, PA | 2.0 | 1.0 | 1218 | $1,450 | $1.19 | 23d | 1 | 0.48mi |
| 251 Selvin Dr Verona, PA | 3.0 | 1.0 | 1320 | $1,295 | $0.98 | 2d | 1 | 0.73mi |
| 10135 Pearl Rd Pittsburgh, PA | 3.0 | 2.0 | 1163 | $1,450 | $1.25 | 23d | 1 | 0.74mi |
| 273 Bramble St Verona, PA | 3.0 | 1.5 | 1076 | $1,720 | $1.60 | 4d | 1 | 0.79mi |
| 3005 Laketon Rd Pittsburgh, PA | 3.0 | 1.0 | 1100 | $1,295 | $1.18 | 14d | 1 | 0.83mi |
| 8075 Chaske St Verona, PA | 3.0 | 1.5 | 1092 | $1,425 | $1.30 | 7d | 1 | 0.86mi |
| 648 Southern Ave Penn Hills, PA | 3.0 | 1.0 | 1100 | $1,600 | $1.45 | 7d | 1 | 0.88mi |
| 610 Churchill Ave Pittsburgh, PA | 3.0 | 1.0 | 1100 | $1,395 | $1.27 | 1d | 1 | 0.92mi |
| 1250 Blackadore Ave Pittsburgh, PA | 3.0 | 1.0 | 1440 | $1,750 | $1.22 | 23d | 1 | 0.99mi |
| 2031 Chalfant St Pittsburgh, PA | 3.0 | 1.5 | 1150 | $1,950 | $1.70 | 43d | 1 | 0.99mi |
| 1962 McNary Blvd Pittsburgh, PA | 3.0 | 1.0 | 1517 | $1,545 | $1.02 | 7d | 1 | 1.17mi |
| 314 Penn Vista Dr Pittsburgh, PA | 2.0 | 1.0 | 1150 | $1,250 | $1.09 | 43d | 1 | 1.33mi |
| 131 Jacob Dr Pittsburgh, PA | 3.0 | 1.0 | 1144 | $2,300 | $2.01 | 1d | 1 | 1.34mi |
| 7534 Penn Bridge Ct Pittsburgh, PA | 2.0 | 2.0 | 1259 | $1,750 | $1.39 | 43d | 1 | 1.42mi |
| 641 Penny Dr Pittsburgh, PA | 3.0 | 1.5 | 1199 | $1,525 | $1.27 | 14d | 1 | 1.43mi |
| 124 Dauntless Dr Pittsburgh, PA | 3.0 | 1.0 | 1100 | $1,395 | $1.27 | 23d | 1 | 1.46mi |
Listing history 16 events
-
2026-06-18days on market $164,900 Active 52 DOM
-
2026-06-17days on market $164,900 Active 51 DOM
-
2026-06-16days on market $164,900 Active 50 DOM
-
2026-06-15days on market $164,900 Active 49 DOM
-
2026-06-13days on market $164,900 Active 47 DOM
-
2026-06-13days on market $164,900 Active 46 DOM
-
2026-06-09days on market $164,900 Active 43 DOM
-
2026-06-08days on market $164,900 Active 42 DOM
-
2026-06-07days on market $164,900 Active 41 DOM
-
2026-06-05days on market $164,900 Active 38 DOM
-
2026-06-03days on market $164,900 Active 37 DOM
-
2026-06-02days on market $164,900 Active 36 DOM
-
2026-06-01days on market $164,900 Active 35 DOM
-
2026-05-31days on market $164,900 Active 34 DOM
-
2026-04-27$164,900 Active 746-char remark
-
1987-07-24soldstatus $43,500
ⓘ Source: listings_history table (triggers on properties + properties_extension) + one-shot
backfill from property_details.listing_events for pre-trigger history.
Tax reassessment forecast PA · Partial reset (capped growth)
- Current annual tax
- $1,889 · $157/mo
- Projected year-2 tax
- $2,247 · $187/mo
- Expected delta
- +$358/yr (+$30/mo · 19.0%)
ⓘ Screening estimate from a state-policy table — verify with the county assessor before closing.
Climate risk First Street
- Flood 1/10 Low FEMA zone X (unshaded) · 0% chance over 30 yrs
- Wildfire 1/10 Low
- Heat 3/10 Moderate 6 d/yr ≥96°F today · 15 d/yr by 30 yrs out
- Wind 2/10 Low 0% chance of damaging wind over 30 yrs
- Air quality 4/10 Moderate 5 unhealthy d/yr today · 7 by 30 yrs out
Nearby sold comps map
Loading sold comps map…
Walkable amenities ~0.75 mi
Loading nearby amenities…
Taxation est. · year 1
- Rental income
- $18,380
- − Mortgage interest
- −$9,237
- − Property taxes
- −$1,889
- − Insurance
- −$824
- − Repairs & maintenance
- −$1,470
- − Management
- −$1,470
- − Depreciation
- −$4,797
- Taxable loss
- −$1,308
- Est. tax savings @ 24.0%
- +$314
- After-tax cash flow
- $1,744/yr
For passive investors: Depreciation is non-cash, so a rental often shows a tax loss while cash-flowing — sheltering income. Rental losses are passive: they offset passive income freely, and up to $25,000/yr can offset ordinary (W-2) income if you actively participate and your MAGI is under $100k (phasing out to $0 by $150k); unused losses carry forward. On sale, claimed depreciation is recaptured at up to 25%, and gains may owe capital-gains tax (a 1031 exchange can defer both). Figures are a year-1 estimate at your 24.0% rate — not tax advice; consult a CPA.
Schools (NCES district)
- District
- Penn Hills SD
- NCES district ID
- 4218590
- Math proficiency
- 13% ▼ -6.00%
- Reading proficiency
- 24% ▼ -14.00%
- Median HH income
- $47,794
- Composite
- 16.42/100
- National rank
- #9192
- State rank
- #496 of 539 in PA
Livability — Penn Hills
No livability data for this city. (Only ~50 U.S. cities are tracked.)
Census & demographics
- County
- Allegheny County · 1,022,028 people
- Metro
- Pittsburgh, PA
- Population (ZIP)
- 33,951
- Household income
- $67,240
- Rent vs Own
- Severe rent burden
- 955.0
Population outlook (Allegheny County) Hauer SSP2
- Today (2025)
- 1,250,282 people
- By 2030
- 1,256,482 · +0.5%
- By 2040
- 1,256,318 · +0.5%
- By 2050
- 1,244,169 · -0.5%
- By 2075
- 1,197,693 · -4.2%
- By 2100
- 1,093,187 · -12.6%
Race, ethnicity, and origin ACS 2023
- Neighborhood character
- Diverse neighborhood (Simpson 0.58)
- Race & ethnicity
- White 51% Black 40% Two or more races 7% Hispanic / Latino 2%
- Common ancestry
- Romanian 5% Serbian 2% Slovak 1%
- Foreign-born
- 4% · Canada
- Languages at home
- 97% English-only · Other Indo-European 1% Spanish 1%
Political lean MEDSL · Allegheny
- 2024 margin
- Strong D (+20.3) · D 59.7% · R 39.4%
- 2008→2024 swing
- +4.8pp toward D · 2008: 15.5pp · 2024: 20.3pp
- All cycles
- 2024: D+20.3 2020: D+20.4 2016: D+16.4 2012: D+14.4 2008: D+15.5
Not yet ingested
- Civics
- —
Market trends
- HPI YoY
- ▼ -121.68%
- Current HPI
- 235.4861
- Rent YoY
- ▲ 7.63%
- Metro
- Pittsburgh, PA
- State GDP YoY
- ▲ 1.68%
- F500 in state
- 34
Industry mix (Fortune 500 HQ in PA)
| Industry | F500 HQs | Revenue |
|---|---|---|
| Healthcare | 2 | $309B |
|
||
| Insurance | 2 | $27B |
|
||
| Telecommunications / Media | 1 | $124B |
|
||
| Industrial Distribution | 1 | $22B |
|
||
| Financial Services | 1 | $20B |
|
||
| Chemicals / Materials | 1 | $18B |
|
||
Price history
+279.1% since first listed2 events — show timeline
- 2026-04-27 Listed $164,900 West Penn MLS
- 1987-07-24 Sold (Public Records) $43,500 Public Records
Property tax history
+2.2%/yrLatest (2026): $1,889 · +0.0% YoY. Source: county tax records.
Cash-flow waterfall
monthlySold comps — $/sqft
last 12 mo · ≤1 miLoading sold comps…