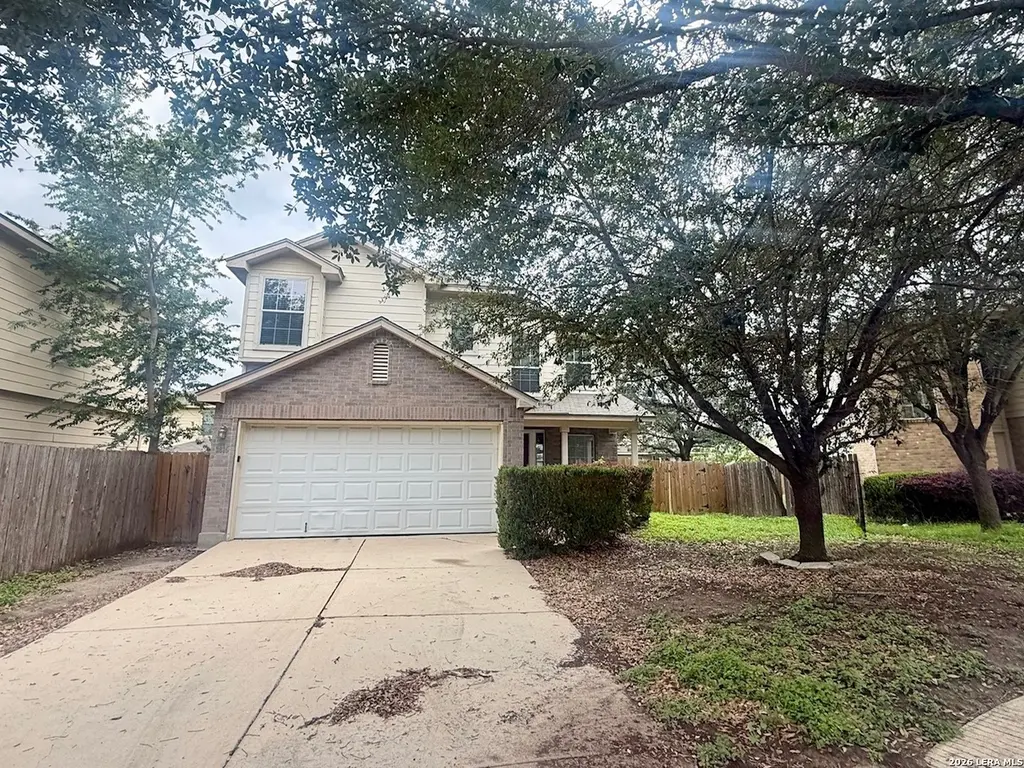
3615 Dunlap Flds · San Antonio, TX
Flood risk 1/10 · Minimal
- FEMA flood zone
- X (unshaded)
- Chance of flooding over 30 yrs
- 0.0%
- Est. flood insurance / yr
- $507 – $1,088
Fire risk 4/10 · Minor
- Est. fire insurance / yr
- $1,222 – $2,270
Heat risk 8/10 · Major
- Hot days now (above 108°F)
- 7 days/yr
- Hot days in 30 yrs
- 22 days/yr
Wind risk 8/10 · Major
- Chance of severe wind over 30 yrs
- 80.0%
Air-quality risk 2/10 · Minimal
- Unhealthy air days now
- 0 days/yr
- Unhealthy air days in 30 yrs
- 1 days/yr
Risk factors via First Street. Map © Google.
Why this score? — see what drove the C- grade
The composite is a weighted blend of 9 inputs, each scored 0–100. Each bar is that input's sub-score; the figure is the points it added to the 100-point composite (weight × sub-score).
- Cash flow +16.2/30.0
- ARV discount +15.0/15.0
- DSCR +5.0/10.0
- 1% rule +4.8/10.0
- Livability +4.0/5.0
- Condition / age +2.5/5.0
- Schools +2.4/10.0
- Rent growth +2.2/5.0
- Appreciation +0.0/10.0
$175,000
🖨 Deal sheet (PDF) 📄 Offer letter ✓ Due diligence
Listing remarks MLS
Spacious home located approx. 5 minutes from Fort Sam Houston and Randolph AFB. Approx. 10 minutes to downtown San Antonio and conveniently located near schools and shopping. Full interior paint with new pad and carpet installed this year. Located on a cul de sac offering privacy and safety for your buyer's children. Garden tub and separate shower in primary bath. Walking distance to HOA playground. Close to Wagner High School. Back yard fence has been repaired.
Key facts
- Located near schools
- 3,920 sq ft lot
- 2 garage spots
Tags
Neighborhood map
What this means for you Summary
Snapshot
- This is a 3-bed/2.5-bath single-family listed at $175k.
Deal economics
- At list price, monthly cash flow is $93 ($1k/yr) — positive.
- The deal already cash-flows at list — no discount required.
- To meet the 1% rule (rent ≥ 1% of price), the offer needs to be $171k (2.2% below list).
- Recommended offer: $164k (6.0% below list) — sets the bar for market timing.
- Cap rate 6.9% vs local median 3.8% in San Antonio — top-decile yield for the area; either an underpriced asset or a hidden risk that comps aren't pricing in. Stress-test before assuming the spread holds.
Location & tenants
- Location reads 80/100 on livability (#31 in TX, #1,616 nationally) — a professional / high-income tenant draw. Strengths: amenities A+, commute A+, cost of living A+; Watch: schools C-, crime F.
- Judson ISD (suburban): math 21% / reading 33% proficiency, ranked #660 of 826 in TX (top 80%) — low school quality limits family demand, transient renter base, plan for 1-2y turnover.
- Market conditions: Rents soft (-1.1%/yr); 1208 active listings in the ZIP; 40 comparable units currently listed for rent nearby; rentals at typical pace (median 22d on market — plan ~3-4 weeks tenant-placement turnaround); solid renter incomes; 8,308 units permitted in Bexar County in 2024 (2,506 in 5+ unit buildings).
Forward outlook
- Local home prices are declining (-3.0%/yr); year-one equity from $1k of loan paydown is wiped out by about $5k of value loss. Plan a longer hold.
- Bexar County population projected at +50% by 2050 — long-run rental-demand tailwind backs the buy-and-hold thesis.
Negotiation context
- It's been on market 76 days — a 6% lower offer ($164k) is reasonable based on typical stale-listing flexibility.
- 3 sale attempts since 18y ago; this cycle's ask has dropped $23k (12%) from the opening price — seller is motivated, your offer sets the floor, not the list.
Risks & watch-outs
- Climate carrying-cost: severe wind risk, 80% chance of damaging wind over 30y; extreme-heat days projected 7→22/yr by 2055 (HVAC capex compounding) — expect insurance premiums to compound above CPI over the hold.
Questions for the listing agent
- It's been on market 76 days. Have you received any prior offers? Is the seller open to a 6% concession, seller financing, or rate buy-down credit?
- What does the HOA fee cover, when was the last increase, and are there any pending special assessments or reserve-fund shortfalls?
- Why hasn't it sold? Are there any deal-killer items the seller is aware of (foundation, flood, title, zoning, code violations)?
- Is there a deadline driving the sale (1031 exchange, divorce, estate, relocation)? That informs how much negotiation room exists.
- Crime grade is F in this area — have there been break-ins, vandalism, or insurance claims at this property in the last 3 years? What carrier currently insures it and at what premium?
- What's the average days-on-market for RENTAL listings here right now (not sales)? A rising rental-DOM trend means longer vacancies and softer asking-rent achievability than the comps imply.
- What's the recent tenant-quality profile in this submarket — average credit score on applications, eviction rate, late-payment / NSF rate, and stable-employment percentage? A property-management company in the area should have these aggregated.
- How much new for-sale + rental construction is in the pipeline within 1–3 miles? Heavy new supply typically softens prices + rents 12–24 months out; constrained supply supports both.
Investment metrics
- 1% rule
- 0.98% ✗
- Cap rate
- 6.93%
- Cash-on-cash
- 2.27%
- DSCR
- 1.10
- GRM
- 8.5
CMA / ARV
- ARV (median comp)
- $238,485
- List price
- $175,000
- Delta
- -26.62%
- Verdict
- UNDERPRICED
- Comps
- 20 within 1.0 mi
Show comp detail 12 sales within ~0.75 mi
| Address | Dist | Beds/Ba | Sqft | Sold | Price | $/sf | Match |
|---|---|---|---|---|---|---|---|
| 3842 Candleglenn | 0.46mi | 3/2.5 | 1,501 (-3%) | 0mo | $155,000 | $103 | 73 |
| 3717 Candlecreek Ct | 0.51mi | 3/2.5 | 1,501 (-3%) | 0mo | $199,999 | $133 | 71 |
| 6518 Candleview | 0.42mi | 3/2.0 | 1,630 (+5%) | 1mo | $179,000 | $110 | 69 |
| 4141 Sunrise Cove Dr | 0.46mi | 3/2.5 | 1,478 (-4%) | 3mo | $125,000 | $85 | 69 |
| 6011 Meadow Sunrise Dr | 0.58mi | 3/2.0 | 1,521 (-2%) | 1mo | $150,000 | $99 | 67 |
| 6617 Richland Pl | 0.41mi | 3/2.0 | 1,653 (+7%) | 2mo | $232,500 | $141 | 66 |
| 3019 Pacific Coast | 0.46mi | 3/2.0 | 1,654 (+7%) | 1mo | $245,000 | $148 | 65 |
| 6143 Lyndell Spgs | 0.70mi | 3/2.5 | 1,501 (-3%) | 1mo | $208,000 | $139 | 62 |
| 2915 Candleside | 0.43mi | 3/2.5 | 1,716 (+11%) | 2mo | $190,000 | $111 | 60 |
| 5123 Pine Lk | 0.69mi | 3/2.0 | 1,626 (+5%) | 1mo | $202,000 | $124 | 56 |
| 6002 Glacier Sun | 0.46mi | 3/2.0 | 1,344 (-13%) | 1mo | $165,000 | $123 | 54 |
| 4230 Sunrise Cv | 0.53mi | 4/2.0 (+1) | 1,733 (+12%) | 1mo | $164,000 | $95 | 48 |
Match score weights: distance 35% · size 25% · config 20% · recency 20%. Top-matched comps best support the ARV.
Projected returns pro-forma
-3.0% appreciation · 0.0% rent growth · sell at horizon
- IRR
- -16.2%
- Equity multiple
- 0.44×
- Total profit
- $-27,416
- Equity at exit
- $26,093
- IRR
- -14.7%
- Equity multiple
- 0.28×
- Total profit
- $-35,427
- Equity at exit
- $15,131
Cash invested: $49,000 (down + closing). Projections, not guarantees.
Landlord ↔ Tenant lean methodology
- Overall (STATE)
- 87 Strongly Landlord-Friendly
- State Texas
- 87 Strongly Landlord-Friendly · R+5
- County
- — inherits STATE
- City
- — inherits STATE
ZIP-level market 78109
- Home prices YoY
- -17.8%
- Rents YoY
- -1.1%
- Active inventory
- 1208
- Price-to-rent
- 8.5×
Monthly cashflow live
- Estimated rent
- $1,711 high interval (Pro) →
- Mortgage (P&I)
- −$918
- Tax from tax record
- −$260 /mo · $3,126/yr
- Insurance
- −$73
- HOA
- −$8
- Vacancy / Maint / Mgmt
- −$359
- Net cashflow
- $93
Break-even live
Sensitivity live
| Price | -10% $192 | -5% $142 | +0% $93 | +5% $43 | +10% $-6 |
|---|---|---|---|---|---|
| Rent | -10% $-43 | -5% $25 | +0% $93 | +5% $160 | +10% $228 |
| Rate | -1.0pp $181 | -0.5pp $137 | base $93 | +0.5pp $47 | +1.0pp $1 |
UW: 25.0% down · 7.5% · 30yr · 1.5% tax · 5.0% vac · 8.0% maint · 8.0% mgmt
Financing live
Cash to close
- Down payment
- $43,750
- Closing costs
- $5,250
- Reserves months
- —
- Total cash needed
- —
Loan-product check · same deal, 3 products live
Conventional
25% down · 7.5% · 30yr
- Down + closing
- —
- Monthly P&I
- —
- Monthly cashflow
- —
- DSCR
- —
- Eligible?
- —
Personal DTI + credit; lowest rate.
DSCR
20% down · 8.5% · 30yr
- Down + closing
- —
- Monthly P&I
- —
- Monthly cashflow
- —
- DSCR
- —
- Eligible?
- —
No personal income docs; deal must DSCR.
Hard money
10% down · 12.0% · 12mo
- Down + closing
- —
- Monthly P&I
- —
- Monthly cashflow
- —
- DSCR
- —
- Eligible?
- —
Short-term bridge; refi at stabilization.
Rent comps 40 comps
| Address | Beds | Baths | Sqft | Rent | $/sqft | DOM | Units | Dist |
|---|---|---|---|---|---|---|---|---|
| 3603 Aranda Flds Converse, TX | 3.0 | 2.0 | 1346 | $1,650 | $1.23 | 44d | 1 | 0.02mi |
| 3511 Dunlap Flds Converse, TX | 3.0 | 2.0 | 1317 | $1,650 | $1.25 | 12d | 1 | 0.05mi |
| 3422 Dunlap Flds Converse, TX | 3.0 | 2.0 | 1450 | $1,540 | $1.06 | 21d | 1 | 0.11mi |
| 3327 Candlemoon Dr San Antonio, TX | 3.0 | 2.0 | 1344 | $1,550 | $1.15 | 44d | 1 | 0.15mi |
| 6703 Foster Flds Converse, TX | 4.0 | 2.0 | 1894 | $1,850 | $0.98 | 16d | 1 | 0.16mi |
| 6523 Candlecrest Ct San Antonio, TX | 4.0 | 2.0 | 1905 | $1,930 | $1.01 | 44d | 1 | 0.21mi |
| 6734 Summer Fest Dr San Antonio, TX | 3.0 | 2.5 | 1225 | $1,550 | $1.27 | 3d | 8 | 0.30mi |
| 6734 Summer Fest Dr Unit 150 San Antonio, TX | 3.0 | 2.5 | 1225 | $1,575 | $1.29 | 16d | 1 | 0.31mi |
| 6734 Summer Fest Dr Unit 130 San Antonio, TX | 3.0 | 2.5 | 1225 | $1,600 | $1.31 | 25d | 1 | 0.31mi |
| 6734 Summer Fest Dr Unit 114 San Antonio, TX | 3.0 | 2.5 | 1225 | $1,400 | $1.14 | 16d | 1 | 0.31mi |
| 6734 Summer Fest Dr Unit 108 San Antonio, TX | 3.0 | 2.5 | 1225 | $1,450 | $1.18 | 45d | 1 | 0.31mi |
| 6734 Summer Fest Dr Unit 148 San Antonio, TX | 3.0 | 2.5 | 1225 | $1,500 | $1.22 | 16d | 1 | 0.31mi |
| 6734 Summer Fest Dr Unit 128 San Antonio, TX | 3.0 | 2.5 | 1225 | $1,450 | $1.18 | 44d | 1 | 0.35mi |
| 4001 Colonial Sun Dr San Antonio, TX | 3.0 | 2.0 | 1344 | $1,400 | $1.04 | 44d | 1 | 0.42mi |
| 4111 Sunrise Terrace Dr San Antonio, TX | 4.0 | 2.0 | 1220 | $1,800 | $1.48 | 44d | 1 | 0.43mi |
| 4111 Sunrise Terrace Dr San Antonio, TX | 4.0 | 2.0 | 1220 | $1,700 | $1.39 | 3d | 1 | 0.43mi |
| 4311 Rogans Hbr San Antonio, TX | 3.0 | 2.0 | 1380 | $1,500 | $1.09 | 44d | 1 | 0.43mi |
| 4014 Sunrise Creek Dr San Antonio, TX | 3.0 | 2.0 | 1100 | $1,600 | $1.45 | 44d | 1 | 0.45mi |
| 6458 Candleview Ct San Antonio, TX | 4.0 | 2.5 | 2008 | $1,645 | $0.82 | 5d | 1 | 0.45mi |
| 3814 Pickles Way Converse, TX | 3.0 | 2.0 | 1450 | $1,595 | $1.10 | 44d | 1 | 0.46mi |
| 6941 Sunspot Converse, TX | 3.0 | 2.0 | 1355 | $1,240 | $0.92 | 13d | 1 | 0.47mi |
| 6402 Candlewick Ct San Antonio, TX | 4.0 | 2.5 | 2008 | $1,790 | $0.89 | 5d | 1 | 0.48mi |
| 6254 Eddie Way San Antonio, TX | 3.0 | 2.5 | 1225 | $1,375 | $1.12 | 44d | 1 | 0.52mi |
| 6402 Candleview Ct San Antonio, TX | 3.0 | 2.0 | 1319 | $1,499 | $1.14 | 5d | 1 | 0.53mi |
| 3713 Candlebluff Dr San Antonio, TX | 3.0 | 2.5 | 1501 | $2,100 | $1.40 | 16d | 1 | 0.53mi |
| 7111 Azure Waters Converse, TX | 3.0 | 2.0 | 1654 | $1,800 | $1.09 | 16d | 1 | 0.54mi |
| 4122 Alaskian Sunrise San Antonio, TX | 3.0 | 2.0 | 1454 | $1,495 | $1.03 | 44d | 1 | 0.55mi |
| 6230 Eddie Way San Antonio, TX | 3.0 | 2.5 | 1225 | $1,350 | $1.10 | 25d | 1 | 0.57mi |
| 3123 Saturn Path Converse, TX | 3.0 | 2.5 | 1935 | $1,975 | $1.02 | 5d | 1 | 0.59mi |
| 5223 Fawn Lk San Antonio, TX | 3.0 | 3.0 | 1831 | $1,750 | $0.96 | 4d | 1 | 0.59mi |
| 6222 Eddie Way San Antonio, TX | 3.0 | 2.5 | 1225 | $1,350 | $1.10 | 25d | 1 | 0.59mi |
| 6222 Eddie Way Unit 2 San Antonio, TX | 3.0 | 2.5 | 1225 | $1,350 | $1.10 | 4d | 1 | 0.59mi |
| 2726 Candleridge Dr San Antonio, TX | 3.0 | 2.0 | 1430 | $1,349 | $0.94 | 25d | 1 | 0.61mi |
| 3710 Candleglenn San Antonio, TX | 3.0 | 2.5 | 1582 | $1,650 | $1.04 | 4d | 1 | 0.61mi |
| 6214 Eddie Way Unit 2 San Antonio, TX | 3.0 | 2.5 | 1225 | $1,600 | $1.31 | 23d | 1 | 0.61mi |
| 6214 Eddie Way San Antonio, TX | 3.0 | 2.5 | 1225 | $1,600 | $1.31 | 21d | 1 | 0.61mi |
| 6615 Port Elizabeth Converse, TX | 3.0 | 2.0 | 1596 | $1,489 | $0.93 | 5d | 1 | 0.61mi |
| 7022 Phoenix Path Converse, TX | 3.0 | 2.0 | 1209 | $1,750 | $1.45 | 17d | 1 | 0.62mi |
| 6210 Eddie Way Unit 1 San Antonio, TX | 3.0 | 2.5 | 1225 | $1,350 | $1.10 | 4d | 1 | 0.62mi |
| 6210 Eddie Way Unit 1 San Antonio, TX | 3.0 | 2.5 | 1225 | $1,350 | $1.10 | 44d | 1 | 0.62mi |
HOA detail
- Monthly dues
- $8 · $96/yr
Listing history 22 events
-
2026-06-21statusdays on market $175,000 Active Option 76 DOM
-
2026-06-18days on market $175,000 Active 73 DOM
-
2026-06-17statusdays on market $175,000 Active 72 DOM
-
2026-06-16days on market $175,000 Price Change 71 DOM
-
2026-06-15days on market $175,000 Price Change 70 DOM
-
2026-06-13days on market $175,000 Price Change 68 DOM
-
2026-06-09days on market $175,000 Price Change 64 DOM
-
2026-06-08days on market $175,000 Price Change 63 DOM
-
2026-06-07pricestatusdays on market $175,000 Price Change 62 DOM
-
2026-06-04days on market $184,900 Active 59 DOM
-
2026-06-03days on market $184,900 Active 58 DOM
-
2026-06-02days on market $184,900 Active 57 DOM
-
2026-06-01days on market $184,900 Active 56 DOM
-
2026-05-31days on market $184,900 Active 55 DOM
-
2026-05-19price $184,900 470-char remark
Show marketing remark (470 chars)
Spacious home located approx. 5 minutes from Fort Sam Houston and Randolph AFB. Approx. 10 minutes to downtown San Antonio and conveniently located near schools and shopping. Full interior paint with new pad and carpet installed this year. Located on a cul de sac offering privacy and safety for your buyer's children. Garden tub and separate shower in primary bath. Walking distance to HOA playground. Close to Wagner High School. Back yard fence has been repaired.
-
2026-04-06$198,000 New 470-char remark
Show marketing remark (470 chars)
Spacious home located approx. 5 minutes from Fort Sam Houston and Randolph AFB. Approx. 10 minutes to downtown San Antonio and conveniently located near schools and shopping. Full interior paint with new pad and carpet installed this year. Located on a cul de sac offering privacy and safety for your buyer's children. Garden tub and separate shower in primary bath. Walking distance to HOA playground. Close to Wagner High School. Back yard fence has been repaired.
-
2020-10-16soldstatus
-
2009-06-06historical
-
2009-05-18$136,000
-
2008-06-13historical
-
2008-04-18$141,900
-
2007-06-19soldstatus
ⓘ Source: listings_history table (triggers on properties + properties_extension) + one-shot
backfill from property_details.listing_events for pre-trigger history.
Tax reassessment forecast TX · Resets to sale price
- Current annual tax
- $3,126 · $260/mo
- Projected year-2 tax
- $3,202 · $267/mo
- Expected delta
- +$77/yr (+$6/mo · 2.4%)
ⓘ Screening estimate from a state-policy table — verify with the county assessor before closing.
Climate risk First Street
- Flood 1/10 Low FEMA zone X (unshaded) · 0% chance over 30 yrs
- Wildfire 4/10 Moderate
- Heat 8/10 Severe 7 d/yr ≥108°F today · 22 d/yr by 30 yrs out
- Wind 8/10 Severe 80% chance of damaging wind over 30 yrs
- Air quality 2/10 Low 0 unhealthy d/yr today · 1 by 30 yrs out
Nearby sold comps map
Loading sold comps map…
Walkable amenities ~0.75 mi
Loading nearby amenities…
Taxation est. · year 1
- Rental income
- $20,533
- − Mortgage interest
- −$9,803
- − Property taxes
- −$3,126
- − Insurance
- −$875
- − Repairs & maintenance
- −$1,643
- − Management
- −$1,643
- − HOA
- −$96
- − Depreciation
- −$5,091
- Taxable loss
- −$1,743
- Est. tax savings @ 24.0%
- +$418
- After-tax cash flow
- $1,530/yr
For passive investors: Depreciation is non-cash, so a rental often shows a tax loss while cash-flowing — sheltering income. Rental losses are passive: they offset passive income freely, and up to $25,000/yr can offset ordinary (W-2) income if you actively participate and your MAGI is under $100k (phasing out to $0 by $150k); unused losses carry forward. On sale, claimed depreciation is recaptured at up to 25%, and gains may owe capital-gains tax (a 1031 exchange can defer both). Figures are a year-1 estimate at your 24.0% rate — not tax advice; consult a CPA.
Schools (NCES district)
- District
- Judson ISD
- NCES district ID
- 4824990
- Math proficiency
- 21% ▼ -21.00%
- Reading proficiency
- 33% ▼ -7.00%
- Median HH income
- $57,542
- Composite
- 24.39/100
- National rank
- #7689
- State rank
- #660 of 826 in TX
Livability — San Antonio
- Score
- 80/100
- State rank
- #31
- US rank
- #1616
Category grades
Schools grade is shown separately in the Schools card above.
Census & demographics
- County
- Bexar County · 1,990,555 people
- City population
- 1,806,925
- Metro
- San Antonio-New Braunfels, TX
- Population (ZIP)
- 63,067
- Household income
- $91,320
- Rent vs Own
- Severe rent burden
- 1732.0
Population outlook (Bexar County) Hauer SSP2
- Today (2025)
- 2,336,851 people
- By 2030
- 2,560,728 · +9.6%
- By 2040
- 3,020,569 · +29.3%
- By 2050
- 3,493,522 · +49.5%
- By 2075
- 4,668,459 · +99.8%
- By 2100
- 5,533,242 · +136.8%
Race, ethnicity, and origin ACS 2023
- Neighborhood character
- Diverse neighborhood (Simpson 0.69)
- Race & ethnicity
- Hispanic / Latino 44% White 27% Two or more races 21% Black 21% Asian 3%
- Hispanic origin (detail)
- Mexican 29% Puerto Rican 4%
- Common ancestry
- Lithuanian 1% Romanian 1% Italian 1%
- Foreign-born
- 11% · Canada, Vietnam, South Korea
- Languages at home
- 71% English-only · Spanish 23% Tagalog/Filipino 1% Other Asian/Pacific 1%
Political lean MEDSL · Bexar
- 2024 margin
- Lean D (+9.8) · D 54.3% · R 44.6% · Other 1.1%
- 2008→2024 swing
- +4.2pp toward D · 2008: 5.6pp · 2024: 9.8pp
- All cycles
- 2024: D+9.8 2020: D+18.2 2016: D+13.5 2012: D+4.6 2008: D+5.6
Not yet ingested
- Civics
- —
Market trends
- HPI YoY
- ▼ -51.02%
- Current HPI
- 236.4923
- Rent YoY
- ▼ -1.08%
- Metro
- San Antonio-New Braunfels, TX
- State GDP YoY
- ▲ 3.95%
- F500 in state
- 110
Industry mix (Fortune 500 HQ in TX)
| Industry | F500 HQs | Revenue |
|---|---|---|
| Energy | 16 | $1,198B |
|
||
| Technology | 5 | $198B |
|
||
| Engineering / Construction | 4 | $72B |
|
||
| Energy Services | 3 | $60B |
|
||
| Utilities | 3 | $41B |
|
||
| Healthcare | 2 | $330B |
|
||
Price history
+30.3% since first listed8 events — show timeline
- 2026-05-19 Price Changed $184,900 LERA
- 2026-04-06 Listed $198,000 LERA
- 2020-10-16 Sold (Public Records) — Public Records
- 2009-06-06 Listing Removed — LERA
- 2009-05-18 Listed $136,000 LERA
- 2008-06-13 Listing Removed — LERA
- 2008-04-18 Listed $141,900 LERA
- 2007-06-19 Sold (Public Records) — Public Records
Property tax history
+9.8%/yrLatest (2025): $3,126 · -5.4% YoY. Source: county tax records.
Cash-flow waterfall
monthlySold comps — $/sqft
last 12 mo · ≤1 miLoading sold comps…