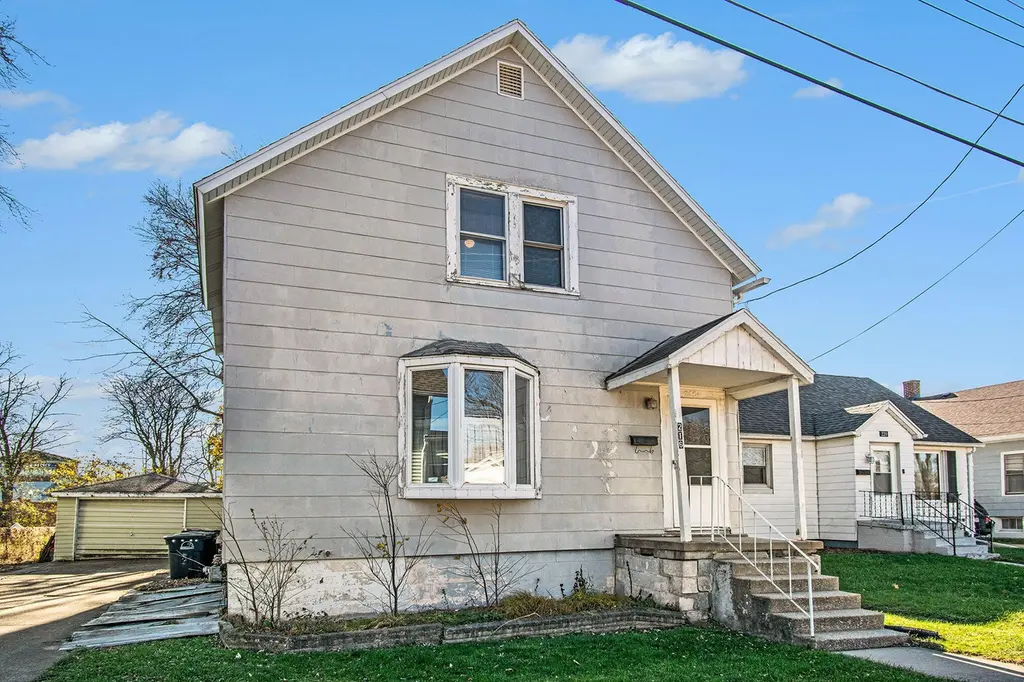
216 May Ave · Michigan City, IN
Flood risk 6/10 · Moderate
- FEMA flood zone
- X (unshaded)
- Chance of flooding over 30 yrs
- 0.73%
- Est. flood insurance / yr
- $473 – $860
Fire risk 3/10 · Minor
- Est. fire insurance / yr
- $717 – $1,331
Heat risk 3/10 · Minor
- Hot days now (above 99°F)
- 7 days/yr
- Hot days in 30 yrs
- 14 days/yr
Wind risk 2/10 · Minimal
- Chance of severe wind over 30 yrs
- —
Air-quality risk 3/10 · Minor
- Unhealthy air days now
- 2 days/yr
- Unhealthy air days in 30 yrs
- 3 days/yr
Risk factors via First Street. Map © Google.
Why this score? — see what drove the B+ grade
The composite is a weighted blend of 9 inputs, each scored 0–100. Each bar is that input's sub-score; the figure is the points it added to the 100-point composite (weight × sub-score).
- Cash flow +30.0/30.0
- ARV discount +15.0/15.0
- 1% rule +10.0/10.0
- DSCR +10.0/10.0
- Rent growth +4.9/5.0
- Livability +4.0/5.0
- Condition / age +2.5/5.0
- Schools +2.2/10.0
- Appreciation +0.0/10.0
$99,500
🖨 Deal sheet 📄 Offer letter ✓ Due diligence
Listing remarks
Discover a true "diamond in the rough" at 216 May Ave. A property with historic charm and endless potential that investors truly appreciate. This spacious two-story home is an ideal canvas for your next spring renovation project. With two kitchens, three bedrooms, and a full bathroom, there's ample space to bring your creative vision to life. The flexible layout, including a separate entry for upstairs as well as access through the main level, makes it perfect for multi-generational living or rental possibilities. Located near Michigan City's shopping, dining, and the NICTD double track, and only minutes from the breathtaking shores of Lake Michigan, this home offers both convenie
Key facts
- Two kitchens
- Near dining
- Near shopping
Tags
Property features AI
Exterior
- Parking: Detached garage (1-car); Driveway; On-street parking; Off-street parking; Concrete driveway; Garage faces front
- Utilities: Electricity connected; Public water; Public sewer; Natural gas connected
- Home design: Two-story home; Built in 1890; Property listed as fixer
- Construction: Original construction circa 1890
- Exterior features: Front porch; Rear porch; Partial fencing; Neighborhood view
Interior
- Kitchen: Eat-in kitchen
- Bedrooms: Primary bedroom; Bedroom 2; Bedroom 3; Office (can be used as bedroom/den)
- Flooring: Hardwood floors; Vinyl flooring
- Bathrooms: 1 full bathroom
- Heating & cooling: Forced air heating (natural gas); Central air conditioning
- Interior features: Ceiling fans; Eat-in kitchen; Full unfinished basement with walk-out access and interior entry
- Laundry & utility: No appliances included
Neighborhood map
What this means for you Summary
Snapshot
- This is a 3-bed/1.0-bath single-family listed at $100k.
Deal economics
- At list price, monthly cash flow is $545 ($7k/yr) — positive.
- The deal already cash-flows at list — no discount required.
- Meets the 1% rule at list price ($2k rent vs $100k).
- Cap rate 12.9% vs local median 2.7% in Michigan City — top-decile yield for the area; either an underpriced asset or a hidden risk that comps aren't pricing in. Stress-test before assuming the spread holds.
Location & tenants
- Location reads 81/100 on livability (#15 in IN, #1,317 nationally) — a professional / high-income tenant draw. Strengths: commute A+, cost of living A+, housing A+; Watch: employment D, schools D-, amenities D-.
- Michigan City Area Schools (urban): math 23% / reading 28% proficiency, ranked #262 of 301 in IN (top 87%) — low school quality limits family demand, transient renter base, plan for 1-2y turnover; 68% free/reduced lunch — lower-income household profile, screen leases tightly.
- Market conditions: Rents rising fast (+9.7%/yr); 371 active listings in the ZIP; 3 comparable units currently listed for rent nearby; rentals lingering (median 44d on market — plan ~5-8 weeks vacancy on turnover, expect pricing pressure); 100% of comp listings sitting > 30 days — soft ceiling on asking rent; 216 units permitted in LaPorte County in 2024 (75 in 5+ unit buildings).
- This rent runs 32% of the median local income ($59k/yr) — at the standard rent-burdened threshold; future hikes will face affordability resistance.
Forward outlook
- Local home prices are declining (-3.0%/yr); year-one equity from $688 of loan paydown is wiped out by about $3k of value loss. Plan a longer hold.
- LaPorte County population projected to shrink 7% by 2050 — rents likely to lag national; underwrite the cash flow, not the appreciation.
- At projected returns (-3.0% appreciation + 8.0% rent growth), your $28k cash investment doubles in ~5 years — after that, you're playing with house money.
Negotiation context
- Only 8 days on market — expect competitive offers; lowballing is unlikely to land.
- 2 sale attempts with the ask held roughly flat each time — persistent listings suggest the price (not the market) is what's stuck; bring a comps-based counter.
- Current owner paid $77k; 29% above their basis — modest negotiation headroom, anchor on the comps not their cost.
Risks & watch-outs
- Watch-outs: built in 1890 — expect roof / HVAC / electrical / plumbing capex.
- Climate carrying-cost: major flood risk — expect insurance premiums to compound above CPI over the hold.
Questions for the listing agent
- Built in 1890 — when were the roof, HVAC, electrical panel, plumbing, and water heater last replaced?
- Is there a deadline driving the sale (1031 exchange, divorce, estate, relocation)? That informs how much negotiation room exists.
- Schools are D-rated, which usually means shorter tenancies and higher turnover. Who's the typical renter profile here, and what's been the actual vacancy rate?
- What's the average days-on-market for RENTAL listings here right now (not sales)? A rising rental-DOM trend means longer vacancies and softer asking-rent achievability than the comps imply.
- What's the recent tenant-quality profile in this submarket — average credit score on applications, eviction rate, late-payment / NSF rate, and stable-employment percentage? A property-management company in the area should have these aggregated.
- How much new for-sale + rental construction is in the pipeline within 1–3 miles? Heavy new supply typically softens prices + rents 12–24 months out; constrained supply supports both.
Investment metrics
- 1% rule
- 1.57% ✓
- Cap rate
- 12.86%
- Cash-on-cash
- 23.47%
- DSCR
- 2.04
- GRM
- 5.3
CMA / ARV
- ARV (median comp)
- $182,512
- List price
- $99,500
- Delta
- -45.48%
- Verdict
- UNDERPRICED
- Comps
- 20 within 1.0 mi
Show comp detail 12 sales within ~0.75 mi
| Address | Dist | Beds/Ba | Sqft | Sold | Price | $/sf | Match |
|---|---|---|---|---|---|---|---|
| 216 May Ave | 0.00mi | 3/1.0 | 1,769 (0%) | 1mo | $77,000 | $44 | 99 |
| 1601 Tennessee St | 0.46mi | 3/1.0 | 1,840 (+4%) | 6mo | $80,000 | $43 | 66 |
| 1818 Elston St | 0.29mi | 3/1.0 | 1,592 (-10%) | 5mo | $115,000 | $72 | 65 |
| 1210 Wabash St | 0.50mi | 3/2.5 | 1,816 (+3%) | 4mo | $150,000 | $83 | 63 |
| 105 Belden St | 0.31mi | 4/2.0 (+1) | 1,968 (+11%) | 2mo | $210,000 | $107 | 56 |
| 518 Dupage St | 0.67mi | 3/1.5 | 1,647 (-7%) | 1mo | $129,000 | $78 | 54 |
| 1930 Tennessee St | 0.40mi | 4/1.5 (+1) | 1,596 (-10%) | 5mo | $170,000 | $107 | 54 |
| 1919 Elston St | 0.31mi | 2/2.0 (-1) | 1,532 (-13%) | 4mo | $159,900 | $104 | 51 |
| 607 W Ripley St | 0.45mi | 2/1.0 (-1) | 1,546 (-13%) | 3mo | $97,000 | $63 | 50 |
| 621 Gardena St | 0.69mi | 3/1.0 | 1,596 (-10%) | 8mo | $199,000 | $125 | 45 |
| 1109 Manhattan St | 0.58mi | 4/1.0 (+1) | 1,584 (-10%) | 7mo | $75,000 | $47 | 45 |
| 621 Superior St | 0.67mi | 3/2.0 | 1,512 (-14%) | 0mo | $165,000 | $109 | 40 |
Match score weights: distance 35% · size 25% · config 20% · recency 20%. Top-matched comps best support the ARV.
Projected returns pro-forma
-3.0% appreciation · 8.0% rent growth · sell at horizon
- IRR
- 22.1%
- Equity multiple
- 1.96×
- Total profit
- $26,846
- Equity at exit
- $14,836
- IRR
- 33.3%
- Equity multiple
- 4.79×
- Total profit
- $105,680
- Equity at exit
- $8,603
Cash invested: $27,860 (down + closing). Projections, not guarantees.
Landlord ↔ Tenant lean methodology
- Overall (STATE)
- 90 Strongly Landlord-Friendly
- State Indiana
- 90 Strongly Landlord-Friendly · R+11
- County
- — inherits STATE
- City
- — inherits STATE
ZIP-level market 46360
- Rents YoY
- 9.7%
- Active inventory
- 371
- Price-to-rent
- 5.3×
Monthly cashflow live
- Estimated rent
- $1,560 medium interval (Pro) →
- Mortgage (P&I)
- −$522
- Tax est. 1.5%
- −$124 /mo · $1,492/yr
- Insurance
- −$41
- HOA
- −$0
- Vacancy / Maint / Mgmt
- −$328
- Net cashflow
- $545
Break-even live
UW: 25.0% down · 7.5% · 30yr · 1.5% tax · 5.0% vac · 8.0% maint · 8.0% mgmt
Financing live
Cash to close
- Down payment
- $24,875
- Closing costs
- $2,985
- Reserves months
- —
- Total cash needed
- —
Loan-product check · same deal, 3 products live
Conventional
25% down · 7.5% · 30yr
- Down + closing
- —
- Monthly P&I
- —
- Monthly cashflow
- —
- DSCR
- —
- Eligible?
- —
Personal DTI + credit; lowest rate.
DSCR
20% down · 8.5% · 30yr
- Down + closing
- —
- Monthly P&I
- —
- Monthly cashflow
- —
- DSCR
- —
- Eligible?
- —
No personal income docs; deal must DSCR.
Hard money
10% down · 12.0% · 12mo
- Down + closing
- —
- Monthly P&I
- —
- Monthly cashflow
- —
- DSCR
- —
- Eligible?
- —
Short-term bridge; refi at stabilization.
Rent comps 3 comps
| Address | Beds | Baths | Sqft | Rent | $/sqft | DOM | Units | Dist |
|---|---|---|---|---|---|---|---|---|
| 1303 Buffalo St Unit 1 Michigan City, IN | 3.0 | 1.0 | 1700 | $1,700 | $1.00 | 43d | 1 | 0.50mi |
| 416 E 9th St Unit 2 Michigan City, IN | 3.0 | 2.0 | 1400 | $1,325 | $0.95 | 43d | 1 | 0.80mi |
| 910 S Carroll Ave Michigan City, IN | 2.0–3.0 | 2.0 | 1187 | $1,600 | $1.35 | 43d | 3 | 1.50mi |
Listing history 5 events
-
2026-05-15status Pending 807-char remark
-
2026-05-07$99,500 Active 807-char remark
-
2026-02-13historical
-
2025-12-18price $109,900
-
2025-11-19$114,900 Active
ⓘ Source: listings_history table (triggers on properties + properties_extension) + one-shot
backfill from property_details.listing_events for pre-trigger history.
Climate risk First Street
- Flood 6/10 Major FEMA zone X (unshaded) · 73% chance over 30 yrs
- Wildfire 3/10 Moderate
- Heat 3/10 Moderate 7 d/yr ≥99°F today · 14 d/yr by 30 yrs out
- Wind 2/10 Low
- Air quality 3/10 Moderate 2 unhealthy d/yr today · 3 by 30 yrs out
Nearby sold comps map
Loading sold comps map…
Walkable amenities ~0.75 mi
Loading nearby amenities…
Taxation est. · year 1
- Rental income
- $18,721
- − Mortgage interest
- −$5,574
- − Property taxes
- −$1,492
- − Insurance
- −$498
- − Repairs & maintenance
- −$1,498
- − Management
- −$1,498
- − Depreciation
- −$2,895
- Taxable income
- $5,267
- Est. tax owed @ 24.0%
- −$1,264
- After-tax cash flow
- $5,274/yr
For passive investors: Depreciation is non-cash, so a rental often shows a tax loss while cash-flowing — sheltering income. Rental losses are passive: they offset passive income freely, and up to $25,000/yr can offset ordinary (W-2) income if you actively participate and your MAGI is under $100k (phasing out to $0 by $150k); unused losses carry forward. On sale, claimed depreciation is recaptured at up to 25%, and gains may owe capital-gains tax (a 1031 exchange can defer both). Figures are a year-1 estimate at your 24.0% rate — not tax advice; consult a CPA.
Schools (NCES district)
- District
- Michigan City Area Schools
- NCES district ID
- 1806570
- Math proficiency
- 23% ▼ -16.00%
- Reading proficiency
- 28% ▼ -10.00%
- Median HH income
- $42,629
- Composite
- 21.76/100
- National rank
- #8257
- State rank
- #262 of 301 in IN
Livability — Michigan City
- Score
- 81/100
- State rank
- #15
- US rank
- #1317
Category grades
Schools grade is shown separately in the Schools card above.
Census & demographics
- Census place
- Michigan City, IN
- County
- La Porte County · 88,580 people
- City population
- 43,817
- Metro
- Michigan City-La Porte, IN
- Population (ZIP)
- 43,817
- Household income
- $59,266
- Rent vs Own
- Severe rent burden
- 1152.0
Population outlook (LaPorte County) Hauer SSP2
- Today (2025)
- 109,757 people
- By 2030
- 108,288 · -1.3%
- By 2040
- 105,070 · -4.3%
- By 2050
- 102,330 · -6.8%
- By 2075
- 97,009 · -11.6%
- By 2100
- 86,459 · -21.2%
Race, ethnicity, and origin ACS 2023
- Neighborhood character
- Predominantly White (67%)
- Race & ethnicity
- White 67% Black 20% Hispanic / Latino 8% Two or more races 7%
- Hispanic origin (detail)
- Mexican 5%
- Common ancestry
- Romanian 11% Lithuanian 2% Iranian 1%
- Foreign-born
- 3% · Canada
- Languages at home
- 95% English-only · Spanish 3%
Political lean MEDSL · LaPorte
- 2024 margin
- R (+14.1) · D 42.1% · R 56.2% · Other 1.7%
- 2008→2024 swing
- -19.1pp toward R · 2008: 5.0pp · 2024: -14.1pp
- All cycles
- 2024: R+14.1 2020: R+7.2 2016: R+6.4 2012: D+12.6 2008: D+5.0
Not yet ingested
- Civics
- —
Market trends
- HPI YoY
- ▼ -210.27%
- Current HPI
- 206.0882
- Rent YoY
- ▲ 9.72%
- Metro
- Michigan City-La Porte, IN
- State GDP YoY
- ▲ 2.90%
- F500 in state
- 18
Industry mix (Fortune 500 HQ in IN)
| Industry | F500 HQs | Revenue |
|---|---|---|
| Industrial Machinery | 2 | $37B |
|
||
| Healthcare | 1 | $177B |
|
||
| Pharmaceuticals | 1 | $45B |
|
||
| Metals / Steel | 1 | $18B |
|
||
| Agriculture | 1 | $17B |
|
||
| Packaging | 1 | $12B |
|
||
Price history
-33.0% since first listed6 events — show timeline
- 2026-05-29 Sold (MLS) $77,000 NIRA MLS as Distributed by MLS Grid
- 2026-05-15 Pending — NIRA MLS as Distributed by MLS Grid
- 2026-05-07 Listed $99,500 NIRA MLS as Distributed by MLS Grid
- 2026-02-13 Listing Removed — NIRA MLS as Distributed by MLS Grid
- 2025-12-18 Price Changed $109,900 NIRA MLS as Distributed by MLS Grid
- 2025-11-19 Listed $114,900 NIRA MLS as Distributed by MLS Grid
Property tax history
-31.1%/yrLatest (2023): $7 · -97.2% YoY. Source: county tax records.
Cash-flow waterfall
monthlySold comps — $/sqft
last 12 mo · ≤1 miLoading sold comps…