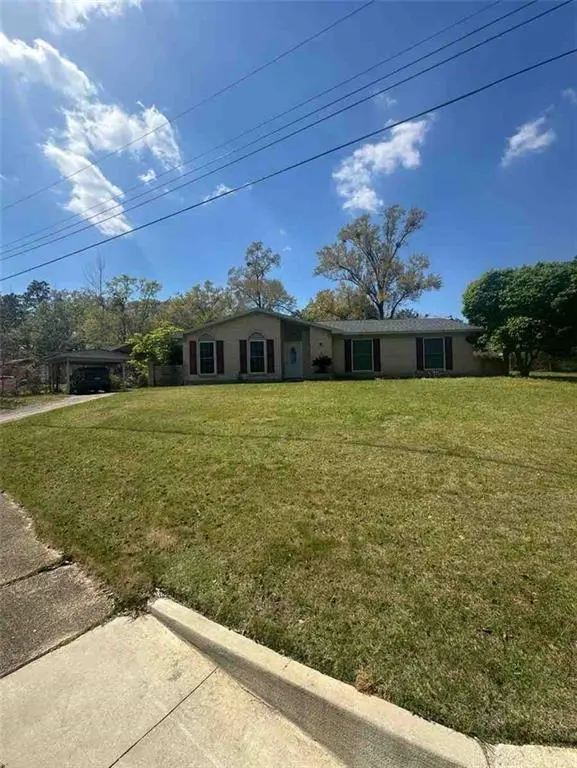
5361 Larchmont Dr · Mobile, AL
Flood risk 1/10 · Minimal
- FEMA flood zone
- X (unshaded)
- Chance of flooding over 30 yrs
- 0.0%
- Est. flood insurance / yr
- $507 – $1,088
Fire risk 3/10 · Minor
- Est. fire insurance / yr
- $916 – $1,700
Heat risk 9/10 · Severe
- Hot days now (above 105°F)
- 7 days/yr
- Hot days in 30 yrs
- 21 days/yr
Wind risk 9/10 · Severe
- Chance of severe wind over 30 yrs
- 99.0%
Air-quality risk 1/10 · Minimal
- Unhealthy air days now
- 0 days/yr
- Unhealthy air days in 30 yrs
- 0 days/yr
Risk factors via First Street. Map © Google.
Why this score? — see what drove the C- grade
The composite is a weighted blend of 9 inputs, each scored 0–100. Each bar is that input's sub-score; the figure is the points it added to the 100-point composite (weight × sub-score).
- Cash flow +18.6/30.0
- ARV discount +13.2/15.0
- DSCR +5.8/10.0
- 1% rule +4.5/10.0
- Livability +3.8/5.0
- Rent growth +2.6/5.0
- Condition / age +2.5/5.0
- Schools +2.3/10.0
- Appreciation +0.0/10.0
$195,000
🖨 Deal sheet 📄 Offer letter ✓ Due diligence
Listing remarks
Located in the heart of West Mobile, this 4-bedroom, 2-bath brick home offers approximately 1,964 square feet of comfortable living space. The home features a cozy kitchen with ample cabinet and countertop space, perfect for everyday living and meal prep. A separate dining room provides a great space for family gatherings or entertaining guests, while the nicely sized laundry room adds convenience and functionality. Step outside to enjoy the covered back patio—ideal for relaxing during crisp spring and fall mornings. The privacy-fenced backyard offers plenty of space for outdoor activities and includes a storage shed for added convenience. Situated on a generously sized lot, this prop
Key facts
- Cozy kitchen
- Separate dining room
- Generously sized lot
Tags
Property features AI
Exterior
- Parking: Carport (1 space)
- Utilities: Public sewer; Electric service: Other
- Home design: Single-family residence; Residential property; Built in 1998
- Construction: Shingle roof; Other roof materials; Concrete perimeter and slab foundation
- Exterior features: Other exterior features; No fencing; No pool or spa; Property offers a view
Interior
- Kitchen: Other appliances/features
- Bedrooms: 4 bedrooms
- Flooring: Ceramic tile; Vinyl
- Bathrooms: 2 full bathrooms
- Heating & cooling: Central heating; Ceiling fan(s)
- Interior features: Other
- Laundry & utility: Other utilities
Neighborhood map
What this means for you Summary
Snapshot
- This is a 4-bed/2.0-bath single-family listed at $195k.
Deal economics
- At list price, monthly cash flow is $188 ($2k/yr) — positive.
- The deal already cash-flows at list — no discount required.
- To meet the 1% rule (rent ≥ 1% of price), the offer needs to be $185k (5.1% below list).
- Recommended offer: $185k (5.1% below list) — sets the bar for 1% rule.
- Cap rate 7.4% vs local median 4.9% in Mobile — top-decile yield for the area; either an underpriced asset or a hidden risk that comps aren't pricing in. Stress-test before assuming the spread holds.
Location & tenants
- Location reads 75/100 on livability (#20 in AL, #4,262 nationally) — a middle-class / working-renter tenant base. Strengths: commute A+, cost of living A+, housing A+; Watch: crime F, employment D-.
- Mobile County (urban): math 15% / reading 39% proficiency, ranked #81 of 129 in AL (top 63%) — low school quality limits family demand, transient renter base, plan for 1-2y turnover; 67% free/reduced lunch — lower-income household profile, screen leases tightly.
- Zoned schools: Olive J Dodge Elementary School (math 6% / reading 35%, grade F, #453 of 627 statewide, top 72%, 875 students, 67% FRL); Murphy High School (math 10% / reading 19%, grade F, #220 of 305 statewide, top 77%, 1,254 students, 66% FRL) — zoned schools at 66% FRL track the district average.
- Market conditions: Rents flat; 142 active listings in the ZIP; 7 comparable units currently listed for rent nearby; rentals leasing fast (median 14d on market — plan ~1-2 weeks tenant-placement turnaround); 43% of comp listings sitting > 30 days — soft ceiling on asking rent; 1,678 units permitted in Mobile County in 2024 (264 in 5+ unit buildings).
- This rent runs 32% of the median local income ($69k/yr) — at the standard rent-burdened threshold; future hikes will face affordability resistance.
Forward outlook
- Local home prices are declining (-3.0%/yr); year-one equity from $1k of loan paydown is wiped out by about $6k of value loss. Plan a longer hold.
- Mobile County population projected to shrink 8% by 2050 — rents likely to lag national; underwrite the cash flow, not the appreciation.
Negotiation context
- It's been on market 19 days — a 2% lower offer ($192k) is reasonable based on typical stale-listing flexibility.
Risks & watch-outs
- Climate carrying-cost: severe wind risk, 99% chance of damaging wind over 30y; extreme-heat days projected 7→21/yr by 2055 (HVAC capex compounding) — expect insurance premiums to compound above CPI over the hold.
Questions for the listing agent
- Is there a deadline driving the sale (1031 exchange, divorce, estate, relocation)? That informs how much negotiation room exists.
- Schools are D-rated, which usually means shorter tenancies and higher turnover. Who's the typical renter profile here, and what's been the actual vacancy rate?
- Crime grade is F in this area — have there been break-ins, vandalism, or insurance claims at this property in the last 3 years? What carrier currently insures it and at what premium?
- What's the average days-on-market for RENTAL listings here right now (not sales)? A rising rental-DOM trend means longer vacancies and softer asking-rent achievability than the comps imply.
- What's the recent tenant-quality profile in this submarket — average credit score on applications, eviction rate, late-payment / NSF rate, and stable-employment percentage? A property-management company in the area should have these aggregated.
- How much new for-sale + rental construction is in the pipeline within 1–3 miles? Heavy new supply typically softens prices + rents 12–24 months out; constrained supply supports both.
Investment metrics
- 1% rule
- 0.95% ✗
- Cap rate
- 7.45%
- Cash-on-cash
- 4.13%
- DSCR
- 1.18
- GRM
- 8.8
CMA / ARV
- ARV (median comp)
- $223,135
- List price
- $195,000
- Delta
- 0.79%
- Verdict
- FAIR
- Comps
- 20 within 1.0 mi
Show comp detail 12 sales within ~0.75 mi
| Address | Dist | Beds/Ba | Sqft | Sold | Price | $/sf | Match |
|---|---|---|---|---|---|---|---|
| 5524 Cross Creek Dr | 0.18mi | 4/2.0 | 2,033 (+4%) | 3mo | $396,435 | $195 | 83 |
| 5529 Cross Creek Dr | 0.16mi | 4/2.0 | 1,885 (-4%) | 4mo | $380,770 | $202 | 82 |
| 2858 Woodmere St W | 0.29mi | 3/2.0 (-1) | 1,904 (-3%) | 1mo | $259,000 | $136 | 75 |
| 3058 Yorkwood Rd E | 0.43mi | 4/2.0 | 2,028 (+3%) | 1mo | $270,000 | $133 | 73 |
| 5116 Geoffrey Dr | 0.41mi | 3/1.5 (-1) | 1,986 (+1%) | 5mo | $223,900 | $113 | 68 |
| 2636 Mountbrook Dr | 0.61mi | 4/2.0 | 2,001 (+2%) | 1mo | $232,000 | $116 | 68 |
| 5536 Cross Creek Dr | 0.22mi | 3/2.5 (-1) | 2,160 (+10%) | 4mo | $417,506 | $193 | 62 |
| 3549 Rue Royal | 0.68mi | 3/2.0 (-1) | 2,007 (+2%) | 0mo | $399,900 | $199 | 59 |
| 3447 Rue Royal | 0.68mi | 3/2.0 (-1) | 2,014 (+2%) | 2mo | $365,000 | $181 | 58 |
| 5710 Antoine Rd | 0.66mi | 3/2.0 (-1) | 2,026 (+3%) | 2mo | $150,000 | $74 | 58 |
| 3401 Emelye Dr | 0.57mi | 4/2.0 | 2,130 (+8%) | 4mo | $220,000 | $103 | 56 |
| 2830 Kings Mill Dr W | 0.62mi | 3/2.0 (-1) | 2,229 (+14%) | 4mo | $300,000 | $135 | 40 |
Match score weights: distance 35% · size 25% · config 20% · recency 20%. Top-matched comps best support the ARV.
Projected returns pro-forma
-3.0% appreciation · 0.24% rent growth · sell at horizon
- IRR
- -12.8%
- Equity multiple
- 0.55×
- Total profit
- $-24,641
- Equity at exit
- $29,075
- IRR
- -8.5%
- Equity multiple
- 0.53×
- Total profit
- $-25,521
- Equity at exit
- $16,860
Cash invested: $54,600 (down + closing). Projections, not guarantees.
Landlord ↔ Tenant lean methodology
- Overall (STATE)
- 90 Strongly Landlord-Friendly
- State Alabama
- 90 Strongly Landlord-Friendly · R+15
- County
- — inherits STATE
- City
- — inherits STATE
ZIP-level market 36693
- Home prices YoY
- -28.1%
- Rents YoY
- 0.2%
- Active inventory
- 142
- Price-to-rent
- 8.8×
Monthly cashflow live
- Estimated rent
- $1,850 high interval (Pro) →
- Mortgage (P&I)
- −$1,023
- Tax from tax record
- −$169 /mo · $2,033/yr
- Insurance
- −$81
- HOA
- −$0
- Vacancy / Maint / Mgmt
- −$388
- Net cashflow
- $188
Break-even live
UW: 25.0% down · 7.5% · 30yr · 1.5% tax · 5.0% vac · 8.0% maint · 8.0% mgmt
Financing live
Cash to close
- Down payment
- $48,750
- Closing costs
- $5,850
- Reserves months
- —
- Total cash needed
- —
Loan-product check · same deal, 3 products live
Conventional
25% down · 7.5% · 30yr
- Down + closing
- —
- Monthly P&I
- —
- Monthly cashflow
- —
- DSCR
- —
- Eligible?
- —
Personal DTI + credit; lowest rate.
DSCR
20% down · 8.5% · 30yr
- Down + closing
- —
- Monthly P&I
- —
- Monthly cashflow
- —
- DSCR
- —
- Eligible?
- —
No personal income docs; deal must DSCR.
Hard money
10% down · 12.0% · 12mo
- Down + closing
- —
- Monthly P&I
- —
- Monthly cashflow
- —
- DSCR
- —
- Eligible?
- —
Short-term bridge; refi at stabilization.
Rent comps 7 comps
| Address | Beds | Baths | Sqft | Rent | $/sqft | DOM | Units | Dist |
|---|---|---|---|---|---|---|---|---|
| 2754 Seaton Ct Mobile, AL | 3.0 | 2.5 | 1640 | $1,950 | $1.19 | 13d | 1 | 0.43mi |
| 4950 Government Blvd Mobile, AL | 1.0–4.0 | 1.0–2.5 | 1225 | $1,483 | $1.21 | 13d | 7 | 0.72mi |
| 4273 Vega Dr Mobile, AL | 3.0 | 1.5 | 1300 | $1,600 | $1.23 | 43d | 1 | 0.81mi |
| 4861 Woodcliff Dr N Mobile, AL | 3.0 | 2.0 | 1610 | $1,300 | $0.81 | 43d | 1 | 0.99mi |
| 4361 Montclair Cir E Mobile, AL | 3.0 | 2.0 | 1456 | $1,700 | $1.17 | 43d | 1 | 1.16mi |
| 6190 Girby Rd Mobile, AL | 1.0–3.0 | 1.0–2.0 | 1034 | $1,789 | $1.73 | 13d | 15 | 1.18mi |
| 2316 Woodland Rd Mobile, AL | 4.0 | 2.0 | 1560 | $2,200 | $1.41 | 13d | 1 | 1.32mi |
Listing history 13 events
-
2026-06-13status $195,000 Pending 19 DOM
-
2026-06-10days on market $195,000 Active 19 DOM
-
2026-06-09days on market $195,000 Active 18 DOM
-
2026-06-08days on market $195,000 Active 17 DOM
-
2026-06-07days on market $195,000 Active 16 DOM
-
2026-06-05pricedays on market $195,000 Active 13 DOM
-
2026-06-03days on market $199,900 Active 12 DOM
-
2026-06-02days on market $199,900 Active 11 DOM
-
2026-06-01days on market $199,900 Active 10 DOM
-
2026-05-31days on market $199,900 Active 9 DOM
-
2026-05-30days on market $199,900 Active 8 DOM
-
2026-05-11price $214,900
-
2026-04-20price $224,900
ⓘ Source: listings_history table (triggers on properties + properties_extension) + one-shot
backfill from property_details.listing_events for pre-trigger history.
Tax reassessment forecast AL · Resets to sale price
- Current annual tax
- $2,033 · $169/mo
- Projected year-2 tax
- $2,033 · $169/mo
- Expected delta
- $0/yr ($0/mo · 0.0%)
ⓘ Screening estimate from a state-policy table — verify with the county assessor before closing.
Climate risk First Street
- Flood 1/10 Low FEMA zone X (unshaded) · 0% chance over 30 yrs
- Wildfire 3/10 Moderate
- Heat 9/10 Extreme 7 d/yr ≥105°F today · 21 d/yr by 30 yrs out
- Wind 9/10 Extreme 99% chance of damaging wind over 30 yrs
- Air quality 1/10 Low 0 unhealthy d/yr today · 0 by 30 yrs out
Nearby sold comps map
Loading sold comps map…
Walkable amenities ~0.75 mi
Loading nearby amenities…
Taxation est. · year 1
- Rental income
- $22,197
- − Mortgage interest
- −$10,923
- − Property taxes
- −$2,033
- − Insurance
- −$975
- − Repairs & maintenance
- −$1,776
- − Management
- −$1,776
- − Depreciation
- −$5,673
- Taxable loss
- −$959
- Est. tax savings @ 24.0%
- +$230
- After-tax cash flow
- $2,486/yr
For passive investors: Depreciation is non-cash, so a rental often shows a tax loss while cash-flowing — sheltering income. Rental losses are passive: they offset passive income freely, and up to $25,000/yr can offset ordinary (W-2) income if you actively participate and your MAGI is under $100k (phasing out to $0 by $150k); unused losses carry forward. On sale, claimed depreciation is recaptured at up to 25%, and gains may owe capital-gains tax (a 1031 exchange can defer both). Figures are a year-1 estimate at your 24.0% rate — not tax advice; consult a CPA.
Schools (NCES district)
- District
- Mobile County
- NCES district ID
- 0102370
- Math proficiency
- 15% ▼ -28.00%
- Reading proficiency
- 39% ▬ 0.00%
- Median HH income
- $42,455
- Composite
- 22.9/100
- National rank
- #8002
- State rank
- #81 of 129 in AL
Livability — Mobile
- Score
- 75/100
- State rank
- #20
- US rank
- #4262
Category grades
Schools grade is shown separately in the Schools card above.
Census & demographics
- Census place
- Mobile, AL
- County
- Mobile County · 246,577 people
- City population
- 205,729
- Metro
- Mobile, AL
- Population (ZIP)
- 18,726
- Household income
- $68,933
- Rent vs Own
- Severe rent burden
- 498.0
Population outlook (Mobile County) Hauer SSP2
- Today (2025)
- 415,303 people
- By 2030
- 411,755 · -0.9%
- By 2040
- 399,670 · -3.8%
- By 2050
- 382,616 · -7.9%
- By 2075
- 337,353 · -18.8%
- By 2100
- 283,391 · -31.8%
Race, ethnicity, and origin ACS 2023
- Neighborhood character
- Predominantly White (65%)
- Race & ethnicity
- White 65% Black 23% Hispanic / Latino 5% Asian 4% Two or more races 4%
- Common ancestry
- Slovak 4% Italian 3% Serbian 2%
- Foreign-born
- 8% · Canada, Vietnam
- Languages at home
- 90% English-only · Spanish 4% Tagalog/Filipino 2% Vietnamese 1%
Political lean MEDSL · Mobile
- 2024 margin
- R (+16.4) · D 41.3% · R 57.7%
- 2008→2024 swing
- -7.7pp toward R · 2008: -8.7pp · 2024: -16.4pp
- All cycles
- 2024: R+16.4 2020: R+11.9 2016: R+13.9 2012: R+9.3 2008: R+8.7
Not yet ingested
- Civics
- —
Market trends
- HPI YoY
- ▼ -71.22%
- Current HPI
- 182.6406
- Rent YoY
- ▲ 0.24%
- Metro
- Mobile, AL
- State GDP YoY
- ▲ 2.94%
- F500 in state
- 4
Industry mix (Fortune 500 HQ in AL)
| Industry | F500 HQs | Revenue |
|---|---|---|
| Financial Services | 1 | $8B |
|
||
| Healthcare | 1 | $5B |
|
||
Price history
-13.3% since first listed5 events — show timeline
- 2026-06-10 Pending — GCMLS AL
- 2026-06-04 Price Changed $195,000 GCMLS AL
- 2026-05-22 Listed $199,900 GCMLS AL
- 2026-05-11 Price Changed $214,900 GCMLS AL
- 2026-04-20 Price Changed $224,900 GCMLS AL
Property tax history
+13.1%/yrLatest (2025): $2,033 · +5.2% YoY. Source: county tax records.
Cash-flow waterfall
monthlySold comps — $/sqft
last 12 mo · ≤1 miLoading sold comps…