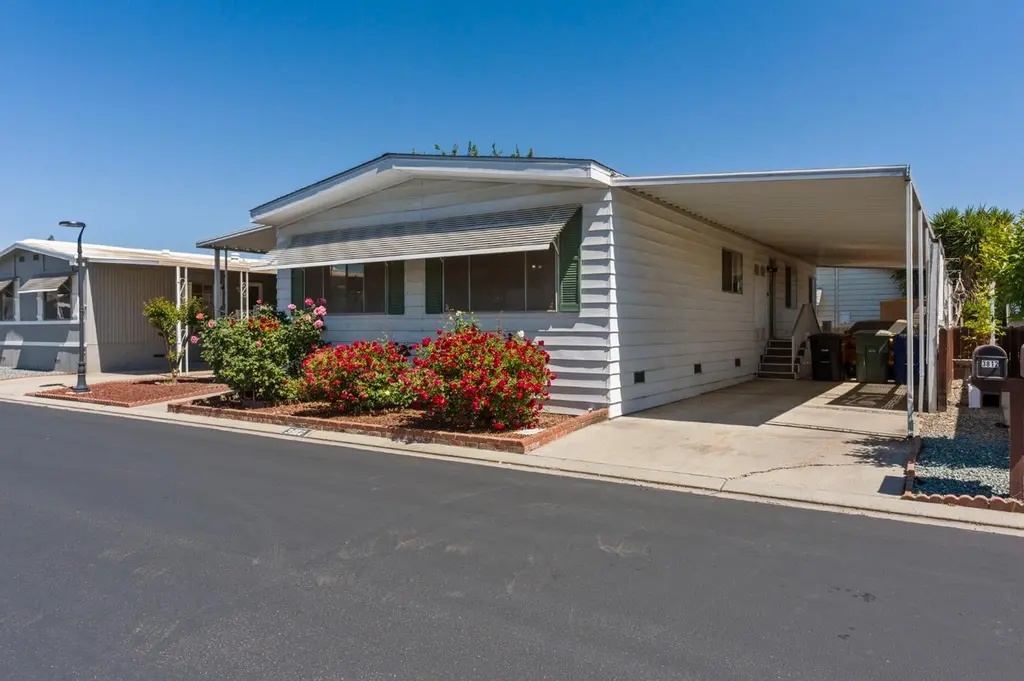
3812 Maui Terrance · Modesto, CA
Flood risk 1/10 · Minimal
- FEMA flood zone
- X (unshaded)
- Chance of flooding over 30 yrs
- 0.0%
- Est. flood insurance / yr
- $507 – $1,088
Fire risk 2/10 · Minimal
- Est. fire insurance / yr
- $659 – $1,223
Heat risk 7/10 · Major
- Hot days now (above 102°F)
- 7 days/yr
- Hot days in 30 yrs
- 15 days/yr
Wind risk 1/10 · Minimal
- Chance of severe wind over 30 yrs
- —
Air-quality risk 10/10 · Severe
- Unhealthy air days now
- 28 days/yr
- Unhealthy air days in 30 yrs
- 32 days/yr
Risk factors via First Street. Map © Google.
Why this score? — see what drove the B grade
The composite is a weighted blend of 9 inputs, each scored 0–100. Each bar is that input's sub-score; the figure is the points it added to the 100-point composite (weight × sub-score).
- Cash flow +30.0/30.0
- 1% rule +10.0/10.0
- DSCR +10.0/10.0
- ARV discount +7.5/15.0
- Schools +4.4/10.0
- Condition / age +3.8/5.0
- Livability +3.2/5.0
- Rent growth +2.8/5.0
- Appreciation +0.0/10.0
$131,900
🖨 Deal sheet 📄 Offer letter ✓ Due diligence
Listing remarks MLS
We are pleased to present this adorable updated two-bedroom, two-bathroom residence, 1360 square feet, situated within a highly desirable 55+ community. This distinguished home, located in the Homewood Village, offers an array of amenities designed to enhance comfort and lifestyle, including organized activities, a swimming pool, a library, a spa, an exercise room, a banquet room, and billiards facilities. The community is conveniently located three miles from the expanding Riverbank shopping center. Upon entry, one is greeted by a spacious, open-concept floor plan, complemented by a newly renovated kitchen. The impeccable interior presentation clearly reflects a commitment to ownership excellence. Further enhancing this property are an additional room adjacent to the dining area, a private rear patio, and a covered porch.--
Key facts
- Parking
- Built 1977
- Listed 69 days
Property features AI
Finance
- Other: Located in a senior community
- Financial info: Land lease amount applies
- HOA & community: No homeowners association; Land lease community — monthly land lease
Exterior
- Parking: Attached covered parking
- Utilities: Public water; Public sewer; Individual electric meter; Individual gas meter; Cable available; 220V outlet in laundry
- Home design: Manufactured in park (double wide); Built in 1977
- Construction: Shingle roof; Manufactured home (Golden West)
- Exterior features: Front landscaping; Fenced yard
Interior
- Kitchen: Free standing gas range; Range hood; Dishwasher; Garbage disposal; Pantry cabinet; Dining bar / dining-living combo
- Bedrooms: 2 bedrooms
- Flooring: Carpet; Tile; Vinyl; Wood
- Bathrooms: 2 full bathrooms; Tub and separate shower stall(s)
- Heating & cooling: Central heating; Central air conditioning; Ceiling fans
- Interior features: Porch; Deck attached to living area; Pantry cabinet; Bonus room; Pets allowed (cats and dogs allowed; number and size limits)
- Laundry & utility: Washer and dryer included; Washer/dryer hookups; Electric hookup in laundry; Laundry located inside
Neighborhood map
What this means for you Summary
Snapshot
- This is a 2-bed/2.0-bath manufactured listed at $132k. Condition is rated good.
Deal economics
- At list price, monthly cash flow is $691 ($8k/yr) — positive.
- The deal already cash-flows at list — no discount required.
- Meets the 1% rule at list price ($2k rent vs $132k).
- Recommended offer: $124k (6.0% below list) — sets the bar for market timing.
- Cap rate 12.6% vs local median 3.2% in Modesto — top-decile yield for the area; either an underpriced asset or a hidden risk that comps aren't pricing in. Stress-test before assuming the spread holds.
Location & tenants
- Location reads 63/100 on livability (#451 in CA) — a middle-class / working-renter tenant base. Strengths: housing A+; Watch: amenities C-, schools D+, health & safety D+.
- Sylvan Union Elementary (urban): math 44% / reading 52% proficiency, ranked #457 of 1,400 in CA (top 33%) — families likely to look elsewhere, expect single-tenant / working-renter base with shorter leases.
- Market conditions: Rents rising (+1.3%/yr); 222 active listings in the ZIP; 10 comparable units currently listed for rent nearby; rentals leasing fast (median 14d on market — plan ~1-2 weeks tenant-placement turnaround); solid renter incomes; 923 units permitted in Stanislaus County in 2024 (63 in 5+ unit buildings).
Forward outlook
- Local home prices are declining (-3.0%/yr); year-one equity from $912 of loan paydown is wiped out by about $4k of value loss. Plan a longer hold.
- Stanislaus County population projected at +14% by 2050 — modest demand growth; plan on rents tracking national, not racing it.
- At projected returns (-3.0% appreciation + 1.3% rent growth), your $37k cash investment doubles in ~6 years — after that, you're playing with house money.
Negotiation context
- It's been on market 69 days — a 6% lower offer ($124k) is reasonable based on typical stale-listing flexibility.
Risks & watch-outs
- Climate carrying-cost: extreme-heat days projected 7→15/yr by 2055 (HVAC capex compounding) — expect insurance premiums to compound above CPI over the hold.
Questions for the listing agent
- It's been on market 69 days. Have you received any prior offers? Is the seller open to a 6% concession, seller financing, or rate buy-down credit?
- Built in 1977 — when were the roof, HVAC, electrical panel, plumbing, and water heater last replaced?
- Why hasn't it sold? Are there any deal-killer items the seller is aware of (foundation, flood, title, zoning, code violations)?
- Is there a deadline driving the sale (1031 exchange, divorce, estate, relocation)? That informs how much negotiation room exists.
- Schools are D-rated, which usually means shorter tenancies and higher turnover. Who's the typical renter profile here, and what's been the actual vacancy rate?
- Crime grade is F in this area — have there been break-ins, vandalism, or insurance claims at this property in the last 3 years? What carrier currently insures it and at what premium?
- What's the average days-on-market for RENTAL listings here right now (not sales)? A rising rental-DOM trend means longer vacancies and softer asking-rent achievability than the comps imply.
- What's the recent tenant-quality profile in this submarket — average credit score on applications, eviction rate, late-payment / NSF rate, and stable-employment percentage? A property-management company in the area should have these aggregated.
- How much new for-sale + rental construction is in the pipeline within 1–3 miles? Heavy new supply typically softens prices + rents 12–24 months out; constrained supply supports both.
Investment metrics
- 1% rule
- 1.54% ✓
- Cap rate
- 12.58%
- Cash-on-cash
- 22.46%
- DSCR
- 2.00
- GRM
- 5.4
CMA / ARV
- ARV (on-the-fly)
- $85,680
- Comps found
- 12
Show comp detail 12 sales within ~0.75 mi
| Address | Dist | Beds/Ba | Sqft | Sold | Price | $/sf | Match |
|---|---|---|---|---|---|---|---|
| 3816 Moana Way | 0.03mi | 2/2.0 | 1,344 (-1%) | 1mo | $77,000 | $57 | 96 |
| 3833 Surfside Dr | 0.07mi | 2/2.0 | 1,400 (+3%) | 1mo | $99,900 | $71 | 91 |
| 3820 Surfside Dr #140 | 0.04mi | 2/2.0 | 1,400 (+3%) | 9mo | $105,000 | $75 | 86 |
| 3808 Maui Ter | 0.01mi | 2/2.0 | 1,440 (+6%) | 12mo | $100,000 | $69 | 79 |
| 3905 Pali Pl #107 | 0.15mi | 2/2.0 | 1,440 (+6%) | 6mo | $90,000 | $63 | 78 |
| 3908 Moana Way | 0.09mi | 2/2.0 | 1,248 (-8%) | 5mo | $65,000 | $52 | 78 |
| 3933 Lahaina Ln | 0.22mi | 2/2.0 | 1,344 (-1%) | 14mo | $55,000 | $41 | 76 |
| 3913 Lahaina Ln | 0.19mi | 2/2.0 | 1,440 (+6%) | 9mo | $65,000 | $45 | 74 |
| 3804 Surfside | 0.04mi | 2/2.0 | 1,536 (+13%) | 6mo | $112,000 | $73 | 71 |
| 3908 Waimea Ln | 0.20mi | 2/2.0 | 1,248 (-8%) | 8mo | $57,000 | $46 | 70 |
| 3932 Surfside Dr | 0.13mi | 2/2.0 | 1,560 (+15%) | 2mo | $115,000 | $74 | 67 |
| 3916 Moana | 0.11mi | 2/2.0 | 1,534 (+13%) | 9mo | $50,000 | $33 | 66 |
Match score weights: distance 35% · size 25% · config 20% · recency 20%. Top-matched comps best support the ARV.
Projected returns pro-forma
-3.0% appreciation · 1.28% rent growth · sell at horizon
- IRR
- 13.3%
- Equity multiple
- 1.52×
- Total profit
- $19,224
- Equity at exit
- $19,667
- IRR
- 20.8%
- Equity multiple
- 2.62×
- Total profit
- $59,862
- Equity at exit
- $11,404
Cash invested: $36,932 (down + closing). Projections, not guarantees.
Landlord ↔ Tenant lean methodology
- Overall (STATE)
- 18 Strongly Tenant-Friendly
- State California
- 18 Strongly Tenant-Friendly · D+13
- County
- — inherits STATE
- City
- — inherits STATE
ZIP-level market 95355
- Rents YoY
- 1.3%
- Active inventory
- 222
- Price-to-rent
- 5.4×
Monthly cashflow live
- Estimated rent
- $2,029 high interval (Pro) →
- Mortgage (P&I)
- −$692
- Tax est. 1.5%
- −$165 /mo · $1,978/yr
- Insurance
- −$55
- HOA
- −$0
- Vacancy / Maint / Mgmt
- −$426
- Net cashflow
- $691
Break-even live
UW: 25.0% down · 7.5% · 30yr · 1.5% tax · 5.0% vac · 8.0% maint · 8.0% mgmt
Financing live
Cash to close
- Down payment
- $32,975
- Closing costs
- $3,957
- Reserves months
- —
- Total cash needed
- —
Loan-product check · same deal, 3 products live
Conventional
25% down · 7.5% · 30yr
- Down + closing
- —
- Monthly P&I
- —
- Monthly cashflow
- —
- DSCR
- —
- Eligible?
- —
Personal DTI + credit; lowest rate.
DSCR
20% down · 8.5% · 30yr
- Down + closing
- —
- Monthly P&I
- —
- Monthly cashflow
- —
- DSCR
- —
- Eligible?
- —
No personal income docs; deal must DSCR.
Hard money
10% down · 12.0% · 12mo
- Down + closing
- —
- Monthly P&I
- —
- Monthly cashflow
- —
- DSCR
- —
- Eligible?
- —
Short-term bridge; refi at stabilization.
Rent comps 10 comps
| Address | Beds | Baths | Sqft | Rent | $/sqft | DOM | Units | Dist |
|---|---|---|---|---|---|---|---|---|
| 1305 Sylvan Meadows Dr Unit C Modesto, CA | 2.0 | 1.5 | 1037 | $2,150 | $2.07 | 13d | 1 | 0.79mi |
| 3904 Monteview Dr Unit 1 Modesto, CA | 3.0 | 2.0 | 1100 | $1,995 | $1.81 | 21d | 1 | 0.80mi |
| 3400 Coffee Rd Modesto, CA | 2.0 | 2.0 | 951 | $1,945 | $2.05 | 21d | 1 | 0.86mi |
| 2912 Niabell Pl Modesto, CA | 3.0 | 2.0 | 1470 | $2,700 | $1.84 | 13d | 1 | 0.98mi |
| 1339 E Rumble Rd Modesto, CA | 2.0 | 1.0 | 1150 | $1,800 | $1.57 | 13d | 1 | 1.01mi |
| 939 Claremont Ct Modesto, CA | 3.0 | 2.5 | 1406 | $2,100 | $1.49 | 13d | 1 | 1.06mi |
| 1313 Floyd Ave Modesto, CA | 1.0–2.0 | 1.0 | 800 | $1,725 | $2.16 | 13d | 2 | 1.24mi |
| 3509 Dragoo Park Dr Unit 3511 Modesto, CA | 3.0 | 2.0 | 1335 | $1,899 | $1.42 | 23d | 1 | 1.34mi |
| 2405 Vera Cruz Dr Apt C Modesto, CA | 2.0 | 1.0 | 918 | $1,675 | $1.82 | 13d | 1 | 1.34mi |
| 1308 Ensenada Dr Unit 5 Modesto, CA | 2.0 | 1.0 | 1050 | $1,450 | $1.38 | 13d | 1 | 1.42mi |
Listing history 17 events
-
2026-06-18days on market $131,900 Active 69 DOM
-
2026-06-17days on market $131,900 Active 68 DOM
-
2026-06-16days on market $131,900 Active 67 DOM
-
2026-06-15days on market $131,900 Active 66 DOM
-
2026-06-14days on market $131,900 Active 64 DOM
-
2026-06-13pricedays on market $131,900 Active 63 DOM
-
2026-06-10days on market $134,000 Active 61 DOM
-
2026-06-09days on market $134,000 Active 60 DOM
-
2026-06-08days on market $134,000 Active 59 DOM
-
2026-06-07days on market $134,000 Active 58 DOM
-
2026-06-05days on market $134,000 Active 55 DOM
-
2026-06-03days on market $134,000 Active 54 DOM
-
2026-06-02days on market $134,000 Active 53 DOM
-
2026-06-01days on market $134,000 Active 52 DOM
-
2026-05-31days on market $134,000 Active 51 DOM
-
2026-05-30days on market $134,000 Active 50 DOM
-
2026-04-10$134,000 Active 842-char remark
Show marketing remark (842 chars)
We are pleased to present this adorable updated two-bedroom, two-bathroom residence, 1360 square feet, situated within a highly desirable 55+ community. This distinguished home, located in the Homewood Village, offers an array of amenities designed to enhance comfort and lifestyle, including organized activities, a swimming pool, a library, a spa, an exercise room, a banquet room, and billiards facilities. The community is conveniently located three miles from the expanding Riverbank shopping center. Upon entry, one is greeted by a spacious, open-concept floor plan, complemented by a newly renovated kitchen. The impeccable interior presentation clearly reflects a commitment to ownership excellence. Further enhancing this property are an additional room adjacent to the dining area, a private rear patio, and a covered porch.--
ⓘ Source: listings_history table (triggers on properties + properties_extension) + one-shot
backfill from property_details.listing_events for pre-trigger history.
Climate risk First Street
- Flood 1/10 Low FEMA zone X (unshaded) · 0% chance over 30 yrs
- Wildfire 2/10 Low
- Heat 7/10 Severe 7 d/yr ≥102°F today · 15 d/yr by 30 yrs out
- Wind 1/10 Low
- Air quality 10/10 Extreme 28 unhealthy d/yr today · 32 by 30 yrs out
Nearby sold comps map
Loading sold comps map…
Walkable amenities ~0.75 mi
Loading nearby amenities…
Taxation est. · year 1
- Rental income
- $24,344
- − Mortgage interest
- −$7,388
- − Property taxes
- −$1,978
- − Insurance
- −$660
- − Repairs & maintenance
- −$1,948
- − Management
- −$1,948
- − Depreciation
- −$3,837
- Taxable income
- $6,586
- Est. tax owed @ 24.0%
- −$1,581
- After-tax cash flow
- $6,713/yr
For passive investors: Depreciation is non-cash, so a rental often shows a tax loss while cash-flowing — sheltering income. Rental losses are passive: they offset passive income freely, and up to $25,000/yr can offset ordinary (W-2) income if you actively participate and your MAGI is under $100k (phasing out to $0 by $150k); unused losses carry forward. On sale, claimed depreciation is recaptured at up to 25%, and gains may owe capital-gains tax (a 1031 exchange can defer both). Figures are a year-1 estimate at your 24.0% rate — not tax advice; consult a CPA.
Condition & rehab AI · 12 photos
This well-maintained mobile home in a desirable 55+ community offers a good condition with minor cosmetic updates needed for optimal resale and rental value.
Value-add opportunities
- Both Paint exterior trim — Enhances curb appeal and value
- Both Clean gutters — Improves drainage and property value
Renovation cost estimate screening
Value-add ROI direction
- Both Paint exterior trim — Enhances curb appeal and value ↑
- Both Clean gutters — Improves drainage and property value ↑
ⓘ Cost ranges are severity-bucket heuristics (US national rule-of-thumb). Get contractor quotes + a written scope before underwriting a rehab budget.
Schools (NCES district)
- District
- Sylvan Union Elementary
- NCES district ID
- 0638670
- Math proficiency
- 44% ▲ 2.00%
- Reading proficiency
- 52% ▬ 0.00%
- Median HH income
- $61,181
- Composite
- 44.28/100
- National rank
- #6167
- State rank
- #457 of 1400 in CA
Livability — Modesto
- Score
- 63/100
- State rank
- #451
- US rank
- #15229
Category grades
Schools grade is shown separately in the Schools card above.
Census & demographics
- Census place
- Modesto, CA
- County
- Stanislaus County · 445,786 people
- City population
- 225,261
- Metro
- Modesto, CA
- Population (ZIP)
- 60,710
- Household income
- $86,849
- Rent vs Own
- Severe rent burden
- 2521.0
Population outlook (Stanislaus County) Hauer SSP2
- Today (2025)
- 579,493 people
- By 2030
- 598,000 · +3.2%
- By 2040
- 630,930 · +8.9%
- By 2050
- 658,300 · +13.6%
- By 2075
- 712,363 · +22.9%
- By 2100
- 719,805 · +24.2%
Race, ethnicity, and origin ACS 2023
- Neighborhood character
- Diverse neighborhood (Simpson 0.66)
- Race & ethnicity
- White 48% Hispanic / Latino 33% Two or more races 18% Asian 8% Black 4% Native American 1%
- Hispanic origin (detail)
- Mexican 29% Puerto Rican 2%
- Common ancestry
- Russian 3% Italian 3% Lithuanian 2%
- Foreign-born
- 15% · Canada, China, Vietnam
- Languages at home
- 73% English-only · Spanish 16% Other Indo-European 4% Tagalog/Filipino 1%
Political lean MEDSL · Stanislaus
- 2024 margin
- R (+11.0) · D 43.2% · R 54.2% · Other 2.6%
- 2008→2024 swing
- -12.7pp toward R · 2008: 1.7pp · 2024: -11.0pp
- All cycles
- 2024: R+11.0 2020: D+0.8 2016: D+0.6 2012: D+0.7 2008: D+1.7
Not yet ingested
- Civics
- —
Market trends
- HPI YoY
- ▼ -458.02%
- Current HPI
- 277.8565
- Rent YoY
- ▲ 1.28%
- Metro
- Modesto, CA
- State GDP YoY
- ▲ 3.21%
- F500 in state
- 116
Industry mix (Fortune 500 HQ in CA)
| Industry | F500 HQs | Revenue |
|---|---|---|
| Technology | 27 | $1,492B |
|
||
| Financial Services | 3 | $174B |
|
||
| Retail | 3 | $44B |
|
||
| Insurance | 3 | $26B |
|
||
| Media / Entertainment | 2 | $115B |
|
||
| Pharmaceuticals / Biotech | 2 | $62B |
|
||
Price history
1 event — show timeline
- 2026-04-10 Listed $134,000 FRESNOMLS
Cash-flow waterfall
monthlySold comps — $/sqft
last 12 mo · ≤1 miLoading sold comps…