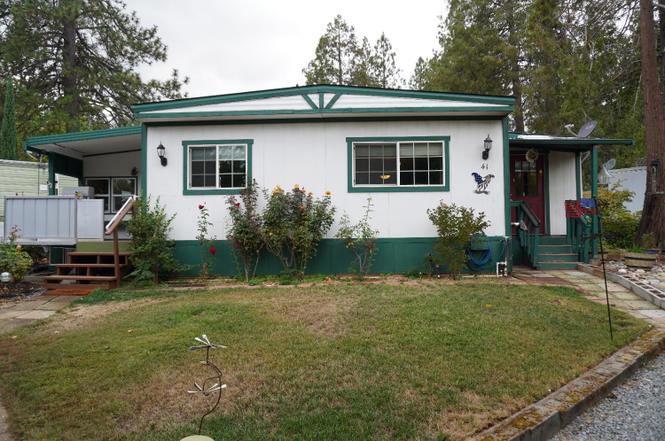
450 Gladycon Rd #41 · Colfax, CA
Flood risk 1/10 · Minimal
- FEMA flood zone
- X (unshaded)
- Chance of flooding over 30 yrs
- 0.0%
- Est. flood insurance / yr
- $507 – $1,088
Fire risk 8/10 · Major
- Est. fire insurance / yr
- $659 – $1,223
Heat risk 5/10 · Moderate
- Hot days now (above 98°F)
- 7 days/yr
- Hot days in 30 yrs
- 15 days/yr
Wind risk 1/10 · Minimal
- Chance of severe wind over 30 yrs
- —
Air-quality risk 10/10 · Severe
- Unhealthy air days now
- 37 days/yr
- Unhealthy air days in 30 yrs
- 39 days/yr
Risk factors via First Street. Map © Google.
Why this score? — see what drove the B- grade
The composite is a weighted blend of 9 inputs, each scored 0–100. Each bar is that input's sub-score; the figure is the points it added to the 100-point composite (weight × sub-score).
- Cash flow +30.0/30.0
- 1% rule +10.0/10.0
- DSCR +10.0/10.0
- ARV discount +7.5/15.0
- Livability +3.6/5.0
- Schools +2.6/10.0
- Rent growth +2.5/5.0
- Condition / age +2.5/5.0
- Appreciation +0.0/10.0
$49,900
🖨 Deal sheet 📄 Offer letter ✓ Due diligence
Listing remarks
Come see this home on a spacious lot in the friendly, well-established Shady Glen Estates 55+ community. The open living and dining area offers great potential for relaxing or entertaining, and the bright kitchen connects to a cozy breakfast nook. Just off the side entry is a versatile bonus roomperfect for a home office, reading space, or hobby area. The enclosed patio provides a year-round space to unwind or work on projects. The property also features a rare extended driveway with partial cover for up to three vehicles, a storage shed, and a backyard with room for pets, gardening, or enjoying the outdoors. An automatic backup generator is included, along with beautiful rose bushes that a
Key facts
- Cozy breakfast nook
- Private backyard
- Fully enclosed patio
Tags
Property features AI
Finance
- Other: Located in a park community (Shady Glen Park); Directions: At entrance of park, follow to pool area; home is straight in from the road.
- Financial info: Land lease: No (land lease amount listed separately)
- HOA & community: No homeowners association; Senior community
Exterior
- Parking: Off-street parking; Covered parking (carport awning); No garage
- Utilities: Public water; Public sewer; Cable available; Generator available / electric service; 220 volts in laundry
- Home design: Manufactured in park (double wide); Fixer and updated/remodeled elements; Built in 1970; Located in a senior community
- Construction: Metal roof; Wood skirting; Manufactured home construction
- Exterior features: Carport awning; Storage area / additional storage structure; Close to clubhouse; Garden
Interior
- Kitchen: Breakfast area; Built-in gas oven; Built-in gas range; Microwave; Garbage disposal
- Bedrooms: 2 bedrooms (including master bedroom)
- Flooring: Carpet; Laminate; Tile; Wood
- Bathrooms: 2 full bathrooms; Double sinks; Tile finishes; Bathtub
- Heating & cooling: Central cooling; Central heating; Pellet stove
- Interior features: Built-in gas oven and built-in gas range; Garbage disposal; Microwave; Insulation and energy-efficient windows; Dual-pane full windows; Enclosed porch/patio with porch steps; Carpeted porch area; Screened room; Office and family room; Dining/living combo
- Laundry & utility: Indoor laundry (laundry closet/inside room); 220-volt outlet in laundry area
Neighborhood map
What this means for you Summary
Snapshot
- This is a 2-bed/2.0-bath manufactured listed at $50k.
Deal economics
- At list price, monthly cash flow is $1k ($14k/yr) — positive.
- The deal already cash-flows at list — no discount required.
- Meets the 1% rule at list price ($2k rent vs $50k).
- Recommended offer: $44k (12.0% below list) — sets the bar for market timing.
- Cap rate 33.4% vs local median 2.5% in Colfax — top-decile yield for the area; either an underpriced asset or a hidden risk that comps aren't pricing in. Stress-test before assuming the spread holds.
Location & tenants
- Location reads 71/100 on livability (#216 in CA) — a middle-class / working-renter tenant base. Strengths: housing A+, health & safety A+, crime B+; Watch: amenities F, commute F, cost of living F.
- Colfax Elementary (rural): math 24% / reading 33% proficiency, ranked #348 of 517 in CA (top 67%) — low school quality limits family demand, transient renter base, plan for 1-2y turnover.
- Market conditions: 105 active listings in the ZIP; solid renter incomes; 3,535 units permitted in Placer County in 2024 (689 in 5+ unit buildings).
Forward outlook
- Local home prices are declining (-3.0%/yr); year-one equity from $345 of loan paydown is wiped out by about $1k of value loss. Plan a longer hold.
- Placer County population projected at +20% by 2050 — long-run rental-demand tailwind backs the buy-and-hold thesis.
- At projected returns (-3.0% appreciation + 3.0% rent growth), your $14k cash investment doubles in ~2 years — after that, you're playing with house money.
Negotiation context
- It's been on market 261 days — a 12% lower offer ($44k) is reasonable based on typical stale-listing flexibility.
Risks & watch-outs
- Climate carrying-cost: severe wildfire risk; extreme-heat days projected 7→15/yr by 2055 (HVAC capex compounding) — expect insurance premiums to compound above CPI over the hold.
Questions for the listing agent
- It's been on market 261 days. Have you received any prior offers? Is the seller open to a 12% concession, seller financing, or rate buy-down credit?
- Built in 1970 — when were the roof, HVAC, electrical panel, plumbing, and water heater last replaced?
- Why hasn't it sold? Are there any deal-killer items the seller is aware of (foundation, flood, title, zoning, code violations)?
- Is there a deadline driving the sale (1031 exchange, divorce, estate, relocation)? That informs how much negotiation room exists.
- What's the average days-on-market for RENTAL listings here right now (not sales)? A rising rental-DOM trend means longer vacancies and softer asking-rent achievability than the comps imply.
- What's the recent tenant-quality profile in this submarket — average credit score on applications, eviction rate, late-payment / NSF rate, and stable-employment percentage? A property-management company in the area should have these aggregated.
- How much new for-sale + rental construction is in the pipeline within 1–3 miles? Heavy new supply typically softens prices + rents 12–24 months out; constrained supply supports both.
Investment metrics
- 1% rule
- 3.73% ✓
- Cap rate
- 33.35%
- Cash-on-cash
- 96.64%
- DSCR
- 5.30
- GRM
- 2.2
CMA / ARV
- ARV (on-the-fly)
- $160,704
- Comps found
- 2
Show comp detail 2 sales within ~0.75 mi
| Address | Dist | Beds/Ba | Sqft | Sold | Price | $/sf | Match |
|---|---|---|---|---|---|---|---|
| 450 Gladycon #87 | 0.01mi | 3/2.0 (+1) | 1,360 (+5%) | 8mo | $160,000 | $118 | 80 |
| 450 Gladycon Rd #98 | 0.01mi | 2/2.0 | 1,248 (-4%) | 22mo | $155,000 | $124 | 75 |
Match score weights: distance 35% · size 25% · config 20% · recency 20%. Top-matched comps best support the ARV.
Projected returns pro-forma
-3.0% appreciation · 3.0% rent growth · sell at horizon
- IRR
- 97.6%
- Equity multiple
- 5.55×
- Total profit
- $63,606
- Equity at exit
- $7,440
- IRR
- —
- Equity multiple
- 11.58×
- Total profit
- $147,779
- Equity at exit
- $4,314
Cash invested: $13,972 (down + closing). Projections, not guarantees.
Landlord ↔ Tenant lean methodology
- Overall (STATE)
- 18 Strongly Tenant-Friendly
- State California
- 18 Strongly Tenant-Friendly · D+13
- County
- — inherits STATE
- City
- — inherits STATE
ZIP-level market 95713
- Active inventory
- 105
- Price-to-rent
- 2.2×
Monthly cashflow live
- Estimated rent
- $1,861 medium interval (Pro) →
- Mortgage (P&I)
- −$262
- Tax est. 1.5%
- −$62 /mo · $748/yr
- Insurance
- −$21
- HOA
- −$0
- Vacancy / Maint / Mgmt
- −$391
- Net cashflow
- $1,125
Break-even live
UW: 25.0% down · 7.5% · 30yr · 1.5% tax · 5.0% vac · 8.0% maint · 8.0% mgmt
Financing live
Cash to close
- Down payment
- $12,475
- Closing costs
- $1,497
- Reserves months
- —
- Total cash needed
- —
Loan-product check · same deal, 3 products live
Conventional
25% down · 7.5% · 30yr
- Down + closing
- —
- Monthly P&I
- —
- Monthly cashflow
- —
- DSCR
- —
- Eligible?
- —
Personal DTI + credit; lowest rate.
DSCR
20% down · 8.5% · 30yr
- Down + closing
- —
- Monthly P&I
- —
- Monthly cashflow
- —
- DSCR
- —
- Eligible?
- —
No personal income docs; deal must DSCR.
Hard money
10% down · 12.0% · 12mo
- Down + closing
- —
- Monthly P&I
- —
- Monthly cashflow
- —
- DSCR
- —
- Eligible?
- —
Short-term bridge; refi at stabilization.
Listing history 16 events
-
2026-06-19days on market $49,900 Active 261 DOM
-
2026-06-18days on market $49,900 Active 260 DOM
-
2026-06-17days on market $49,900 Active 259 DOM
-
2026-06-16pricedays on market $49,900 Active 258 DOM
-
2026-06-15days on market $75,000 Active 257 DOM
-
2026-06-13days on market $75,000 Active 255 DOM
-
2026-06-13days on market $75,000 Active 254 DOM
-
2026-06-10days on market $75,000 Active 252 DOM
-
2026-06-09days on market $75,000 Active 251 DOM
-
2026-06-08days on market $75,000 Active 250 DOM
-
2026-06-07days on market $75,000 Active 249 DOM
-
2026-06-05days on market $75,000 Active 246 DOM
-
2026-06-03days on market $75,000 Active 245 DOM
-
2026-06-02days on market $75,000 Active 244 DOM
-
2026-06-01days on market $75,000 Active 243 DOM
-
2026-05-31days on market $75,000 Active 242 DOM
ⓘ Source: listings_history table (triggers on properties + properties_extension) + one-shot
backfill from property_details.listing_events for pre-trigger history.
Climate risk First Street
- Flood 1/10 Low FEMA zone X (unshaded) · 0% chance over 30 yrs
- Wildfire 8/10 Severe
- Heat 5/10 Major 7 d/yr ≥98°F today · 15 d/yr by 30 yrs out
- Wind 1/10 Low
- Air quality 10/10 Extreme 37 unhealthy d/yr today · 39 by 30 yrs out
Nearby sold comps map
Loading sold comps map…
Walkable amenities ~0.75 mi
Loading nearby amenities…
Taxation est. · year 1
- Rental income
- $22,330
- − Mortgage interest
- −$2,795
- − Property taxes
- −$748
- − Insurance
- −$250
- − Repairs & maintenance
- −$1,786
- − Management
- −$1,786
- − Depreciation
- −$1,452
- Taxable income
- $13,512
- Est. tax owed @ 24.0%
- −$3,243
- After-tax cash flow
- $10,259/yr
For passive investors: Depreciation is non-cash, so a rental often shows a tax loss while cash-flowing — sheltering income. Rental losses are passive: they offset passive income freely, and up to $25,000/yr can offset ordinary (W-2) income if you actively participate and your MAGI is under $100k (phasing out to $0 by $150k); unused losses carry forward. On sale, claimed depreciation is recaptured at up to 25%, and gains may owe capital-gains tax (a 1031 exchange can defer both). Figures are a year-1 estimate at your 24.0% rate — not tax advice; consult a CPA.
Schools (NCES district)
- District
- Colfax Elementary
- NCES district ID
- 0609300
- Math proficiency
- 24% ▼ -18.00%
- Reading proficiency
- 33% ▼ -12.00%
- Median HH income
- $59,844
- Composite
- 25.87/100
- National rank
- #7345
- State rank
- #348 of 517 in CA
Livability — Colfax
- Score
- 71/100
- State rank
- #216
- US rank
- #6827
Category grades
Schools grade is shown separately in the Schools card above.
Census & demographics
- County
- Placer County · 390,510 people
- City population
- 9,448
- Metro
- Sacramento-Roseville-Folsom, CA
- Population (ZIP)
- 9,448
- Household income
- $87,839
- Rent vs Own
- Severe rent burden
- 209.0
Population outlook (Placer County) Hauer SSP2
- Today (2025)
- 422,709 people
- By 2030
- 444,249 · +5.1%
- By 2040
- 480,192 · +13.6%
- By 2050
- 506,390 · +19.8%
- By 2075
- 550,219 · +30.2%
- By 2100
- 547,760 · +29.6%
Race, ethnicity, and origin ACS 2023
- Neighborhood character
- Predominantly White (79%)
- Race & ethnicity
- White 79% Hispanic / Latino 12% Two or more races 9% Asian 2%
- Hispanic origin (detail)
- Mexican 7%
- Common ancestry
- Italian 5% Slovak 3% Portuguese 3%
- Foreign-born
- 7% · Canada, China
- Languages at home
- 93% English-only · Spanish 4% Other Indo-European 3%
Political lean MEDSL · Placer
- 2024 margin
- Lean R (+8.5) · D 44.3% · R 52.8% · Other 2.9%
- 2008→2024 swing
- +2.8pp toward D · 2008: -11.3pp · 2024: -8.5pp
- All cycles
- 2024: R+8.5 2020: R+6.7 2016: R+11.3 2012: R+20.1 2008: R+11.3
Not yet ingested
- Civics
- —
Market trends
- HPI YoY
- ▼ -142.00%
- Current HPI
- 238.8248
- Rent YoY
- —
- Metro
- Sacramento-Roseville-Folsom, CA
- State GDP YoY
- ▲ 3.21%
- F500 in state
- 116
Industry mix (Fortune 500 HQ in CA)
| Industry | F500 HQs | Revenue |
|---|---|---|
| Technology | 27 | $1,492B |
|
||
| Financial Services | 3 | $174B |
|
||
| Retail | 3 | $44B |
|
||
| Insurance | 3 | $26B |
|
||
| Media / Entertainment | 2 | $115B |
|
||
| Pharmaceuticals / Biotech | 2 | $62B |
|
||
Cash-flow waterfall
monthlySold comps — $/sqft
last 12 mo · ≤1 miLoading sold comps…