17 S Back Ct · Monticello, FL
Flood risk 1/10 · Minimal
- FEMA flood zone
- X (unshaded)
- Chance of flooding over 30 yrs
- 0.0%
- Est. flood insurance / yr
- $507 – $1,088
Fire risk 6/10 · Moderate
- Est. fire insurance / yr
- $947 – $1,759
Heat risk 8/10 · Major
- Hot days now (above 107°F)
- 7 days/yr
- Hot days in 30 yrs
- 20 days/yr
Wind risk 9/10 · Severe
- Chance of severe wind over 30 yrs
- 99.0%
Air-quality risk 4/10 · Minor
- Unhealthy air days now
- 6 days/yr
- Unhealthy air days in 30 yrs
- 7 days/yr
Risk factors via First Street. Map © Google.
Why this score? — see what drove the B- grade
The composite is a weighted blend of 9 inputs, each scored 0–100. Each bar is that input's sub-score; the figure is the points it added to the 100-point composite (weight × sub-score).
- Cash flow +27.8/30.0
- DSCR +9.8/10.0
- 1% rule +7.6/10.0
- ARV discount +7.5/15.0
- Condition / age +4.0/5.0
- Livability +3.6/5.0
- Rent growth +2.5/5.0
- Schools +2.5/10.0
- Appreciation +0.0/10.0
$80,000
🖨 Deal sheet (PDF) 📄 Offer letter ✓ Due diligence
Listing remarks
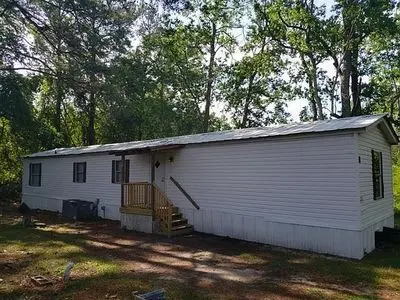
This is a fully remodeled move in ready 1995 16 ft. wide x 66 ft. Genesis 900 sq ft. mobile home 3 bed / 2 bath with a very open living room and kitchen, which have all brand new cabinets and all new modern lighting. The interior walls are all drywall newly painted. It has a relatively new roof which has just been sealed and coated and central heat/air unit. Every room has brand new vinyl flooring. The bathrooms have new vanities installed with moan faucets. One bathroom has a new tub, toilet, sink and shower the other bathroom has a new toilet, sink and a standup shower. The mobile home& apos; s exterior is in great condition with an attached screened-in back deck with new stairs an
Key facts
- Fully remodeled
- Open living room
- New modern lighting
Tags
Neighborhood map
What this means for you Summary
Snapshot
- This is a 3-bed/2.0-bath manufactured listed at $80k. Condition is rated good.
Deal economics
- At list price, monthly cash flow is $243 ($3k/yr) — positive.
- The deal already cash-flows at list — no discount required.
- Meets the 1% rule at list price ($1k rent vs $80k).
- Recommended offer: $75k (6.0% below list) — sets the bar for market timing.
- Cap rate 9.9% vs local median 2.6% in Monticello — top-decile yield for the area; either an underpriced asset or a hidden risk that comps aren't pricing in. Stress-test before assuming the spread holds.
Location & tenants
- Location reads 72/100 on livability (#356 in FL) — a middle-class / working-renter tenant base. Strengths: crime A+, cost of living A+, health & safety A+; Watch: amenities D-, commute F, employment D-.
- Jefferson (rural): math 28% / reading 30% proficiency, ranked #71 of 73 in FL (top 97%) — low school quality limits family demand, transient renter base, plan for 1-2y turnover; 74% free/reduced lunch — lower-income household profile, screen leases tightly.
- Zoned schools: Jefferson Schools K-12 (math 32% / reading 32%, 715 students, 58% FRL) — zoned schools average 58% FRL vs 74% district-wide (16 pts lower); this property's tenant base skews higher-income than the district average.
- Market conditions: 65 active listings in the ZIP; 1 comparable units currently listed for rent nearby; 64 units permitted in Jefferson County in 2024 (0 in 5+ unit buildings).
Forward outlook
- Local home prices are declining (-3.0%/yr); year-one equity from $553 of loan paydown is wiped out by about $2k of value loss. Plan a longer hold.
- Jefferson County population projected at -34% by 2050 — secular population decline; favor cash flow + early exit over multi-decade hold.
- At projected returns (-3.0% appreciation + 3.0% rent growth), your $22k cash investment doubles in ~9 years — after that, you're playing with house money.
Negotiation context
- It's been on market 85 days — a 6% lower offer ($75k) is reasonable based on typical stale-listing flexibility.
Risks & watch-outs
- Climate carrying-cost: severe wind risk, 99% chance of damaging wind over 30y; major wildfire risk; extreme-heat days projected 7→20/yr by 2055 (HVAC capex compounding) — expect insurance premiums to compound above CPI over the hold.
Questions for the listing agent
- It's been on market 85 days. Have you received any prior offers? Is the seller open to a 6% concession, seller financing, or rate buy-down credit?
- Why hasn't it sold? Are there any deal-killer items the seller is aware of (foundation, flood, title, zoning, code violations)?
- Is there a deadline driving the sale (1031 exchange, divorce, estate, relocation)? That informs how much negotiation room exists.
- Schools are D-rated, which usually means shorter tenancies and higher turnover. Who's the typical renter profile here, and what's been the actual vacancy rate?
- What's the average days-on-market for RENTAL listings here right now (not sales)? A rising rental-DOM trend means longer vacancies and softer asking-rent achievability than the comps imply.
- What's the recent tenant-quality profile in this submarket — average credit score on applications, eviction rate, late-payment / NSF rate, and stable-employment percentage? A property-management company in the area should have these aggregated.
- How much new for-sale + rental construction is in the pipeline within 1–3 miles? Heavy new supply typically softens prices + rents 12–24 months out; constrained supply supports both.
Investment metrics
- 1% rule
- 1.26% ✓
- Cap rate
- 9.94%
- Cash-on-cash
- 13.04%
- DSCR
- 1.58
- GRM
- 6.6
CMA / ARV
No comps found within radius.
Projected returns pro-forma
-3.0% appreciation · 3.0% rent growth · sell at horizon
- IRR
- 3.0%
- Equity multiple
- 1.11×
- Total profit
- $2,554
- Equity at exit
- $11,928
- IRR
- 12.5%
- Equity multiple
- 1.99×
- Total profit
- $22,248
- Equity at exit
- $6,917
Cash invested: $22,400 (down + closing). Projections, not guarantees.
Landlord ↔ Tenant lean methodology
- Overall (STATE)
- 87 Strongly Landlord-Friendly
- State Florida
- 87 Strongly Landlord-Friendly · R+3
- County
- — inherits STATE
- City
- — inherits STATE
ZIP-level market 32344
- Home prices YoY
- -18.6%
- Active inventory
- 65
- Price-to-rent
- 6.6×
Monthly cashflow live
- Estimated rent
- $1,008 medium interval (Pro) →
- Mortgage (P&I)
- −$420
- Tax est. 1.5%
- −$100 /mo · $1,200/yr
- Insurance
- −$33
- HOA
- −$0
- Lot rent leased land?
- −$0
- Vacancy / Maint / Mgmt
- −$212
- Net cashflow
- $243
Break-even live
Sensitivity live
| Price | -10% $299 | -5% $271 | +0% $243 | +5% $216 | +10% $188 |
|---|---|---|---|---|---|
| Rent | -10% $164 | -5% $204 | +0% $243 | +5% $283 | +10% $323 |
| Rate | -1.0pp $284 | -0.5pp $264 | base $243 | +0.5pp $223 | +1.0pp $202 |
UW: 25.0% down · 7.5% · 30yr · 1.5% tax · 5.0% vac · 8.0% maint · 8.0% mgmt
Financing live
Cash to close
- Down payment
- $20,000
- Closing costs
- $2,400
- Reserves months
- —
- Total cash needed
- —
Loan-product check · same deal, 3 products live
Conventional
25% down · 7.5% · 30yr
- Down + closing
- —
- Monthly P&I
- —
- Monthly cashflow
- —
- DSCR
- —
- Eligible?
- —
Personal DTI + credit; lowest rate.
DSCR
20% down · 8.5% · 30yr
- Down + closing
- —
- Monthly P&I
- —
- Monthly cashflow
- —
- DSCR
- —
- Eligible?
- —
No personal income docs; deal must DSCR.
Hard money
10% down · 12.0% · 12mo
- Down + closing
- —
- Monthly P&I
- —
- Monthly cashflow
- —
- DSCR
- —
- Eligible?
- —
Short-term bridge; refi at stabilization.
Rent comps 1 comps
| Address | Beds | Baths | Sqft | Rent | $/sqft | DOM | Units | Dist |
|---|---|---|---|---|---|---|---|---|
| 24 Parkway Pines Ct Monticello, FL | 3.0 | 2.0 | 1152 | $1,309 | $1.14 | 16d | 1 | 0.06mi |
Listing history 17 events
-
2026-06-21days on market $80,000 Active 85 DOM
-
2026-06-18days on market $80,000 Active 82 DOM
-
2026-06-17days on market $80,000 Active 81 DOM
-
2026-06-16days on market $80,000 Active 80 DOM
-
2026-06-15days on market $80,000 Active 79 DOM
-
2026-06-14days on market $80,000 Active 77 DOM
-
2026-06-13days on market $80,000 Active 76 DOM
-
2026-06-10days on market $80,000 Active 74 DOM
-
2026-06-09days on market $80,000 Active 73 DOM
-
2026-06-08days on market $80,000 Active 72 DOM
-
2026-06-07days on market $80,000 Active 71 DOM
-
2026-06-03days on market $80,000 Active 67 DOM
-
2026-06-02days on market $80,000 Active 66 DOM
-
2026-06-01days on market $80,000 Active 65 DOM
-
2026-05-31days on market $80,000 Active 64 DOM
-
2026-05-30days on market $80,000 Active 63 DOM
-
2026-03-27$80,000 Active
ⓘ Source: listings_history table (triggers on properties + properties_extension) + one-shot
backfill from property_details.listing_events for pre-trigger history.
Climate risk First Street
- Flood 1/10 Low FEMA zone X (unshaded) · 0% chance over 30 yrs
- Wildfire 6/10 Major
- Heat 8/10 Severe 7 d/yr ≥107°F today · 20 d/yr by 30 yrs out
- Wind 9/10 Extreme 99% chance of damaging wind over 30 yrs
- Air quality 4/10 Moderate 6 unhealthy d/yr today · 7 by 30 yrs out
Nearby sold comps map
Loading sold comps map…
Walkable amenities ~0.75 mi
Loading nearby amenities…
Taxation est. · year 1
- Rental income
- $12,095
- − Mortgage interest
- −$4,481
- − Property taxes
- −$1,200
- − Insurance
- −$400
- − Repairs & maintenance
- −$968
- − Management
- −$968
- − Depreciation
- −$2,327
- Taxable income
- $1,751
- Est. tax owed @ 24.0%
- −$420
- After-tax cash flow
- $2,500/yr
For passive investors: Depreciation is non-cash, so a rental often shows a tax loss while cash-flowing — sheltering income. Rental losses are passive: they offset passive income freely, and up to $25,000/yr can offset ordinary (W-2) income if you actively participate and your MAGI is under $100k (phasing out to $0 by $150k); unused losses carry forward. On sale, claimed depreciation is recaptured at up to 25%, and gains may owe capital-gains tax (a 1031 exchange can defer both). Figures are a year-1 estimate at your 24.0% rate — not tax advice; consult a CPA.
Condition & rehab AI · 1 photo
This fully remodeled mobile home is in excellent condition with new finishes and systems, making it move-in ready. Minor exterior painting and landscaping improvements can further enhance its value.
Value-add opportunities
- Both Painting the exterior — Fresh paint can enhance curb appeal and property value.
- Both Landscaping improvements — Well-maintained landscaping can increase both resale and rental value.
- Both Reassessing the fencing — The fencing is not visible in the photos, but it is implied to be present. Ensuring it is in good condition can improve safety and property value.
- Resale Interior updates — Fresh updates to the interior can make the home more appealing to potential buyers.
- Rental Exterior updates — Well-maintained exteriors can attract renters and improve rental value.
- Both HVAC maintenance — Regular maintenance can improve energy efficiency and reduce utility costs, benefiting both resale and rental value.
Renovation cost estimate screening
Value-add ROI direction
- Both Painting the exterior — Fresh paint can enhance curb appeal and property value. ↑
- Both Landscaping improvements — Well-maintained landscaping can increase both resale and rental value. ↑
- Both Reassessing the fencing — The fencing is not visible in the photos, but it is implied to be present. Ensuring it is in good condition can improve safety and property value. ↑
- Resale Interior updates — Fresh updates to the interior can make the home more appealing to potential buyers. ↑
- Rental Exterior updates — Well-maintained exteriors can attract renters and improve rental value. ↑
- Both HVAC maintenance — Regular maintenance can improve energy efficiency and reduce utility costs, benefiting both resale and rental value. ↑
ⓘ Cost ranges are severity-bucket heuristics (US national rule-of-thumb). Get contractor quotes + a written scope before underwriting a rehab budget.
Schools (NCES district)
- District
- Jefferson
- NCES district ID
- 1200990
- Math proficiency
- 28% ▼ -10.00%
- Reading proficiency
- 30% ▼ -3.00%
- Median HH income
- $43,356
- Composite
- 24.74/100
- National rank
- #7605
- State rank
- #71 of 73 in FL
Livability — Monticello
- Score
- 72/100
- State rank
- #356
- US rank
- #6199
Category grades
Schools grade is shown separately in the Schools card above.
Census & demographics
- Population (ZIP)
- 12,879
Population outlook (Jefferson County) Hauer SSP2
- Today (2025)
- 12,681 people
- By 2030
- 11,811 · -6.9%
- By 2040
- 9,968 · -21.4%
- By 2050
- 8,319 · -34.4%
- By 2075
- 5,406 · -57.4%
- By 2100
- 3,278 · -74.2%
Race, ethnicity, and origin ACS 2023
- Neighborhood character
- Diverse neighborhood (Simpson 0.56)
- Race & ethnicity
- White 59% Black 30% Hispanic / Latino 5% Two or more races 5%
- Hispanic origin (detail)
- Mexican 3%
- Common ancestry
- Slovak 2% Lithuanian 1% Portuguese 1%
- Foreign-born
- 3% · Canada
- Languages at home
- 95% English-only · Spanish 3% Tagalog/Filipino 1%
Political lean MEDSL · Jefferson
- 2024 margin
- R (+18.6) · D 40.3% · R 58.9%
- 2008→2024 swing
- -22.3pp toward R · 2008: 3.7pp · 2024: -18.6pp
- All cycles
- 2024: R+18.6 2020: R+6.9 2016: R+5.1 2012: D+1.8 2008: D+3.7
Not yet ingested
- Civics
- —
Market trends
- HPI YoY
- ▼ -41.71%
- Current HPI
- 182.5741
- Rent YoY
- —
- Metro
- —
- State GDP YoY
- ▲ 3.28%
- F500 in state
- 36
Industry mix (Fortune 500 HQ in FL)
| Industry | F500 HQs | Revenue |
|---|---|---|
| Industrial Technology | 2 | $29B |
|
||
| Insurance | 2 | $17B |
|
||
| Retail | 1 | $60B |
|
||
| Technology Distribution | 1 | $58B |
|
||
| Homebuilding | 1 | $35B |
|
||
| Technology Manufacturing | 1 | $35B |
|
||
Price history
1 event — show timeline
- 2026-03-27 Listed $80,000 Fizber.com
Cash-flow waterfall
monthlySold comps — $/sqft
last 12 mo · ≤1 miLoading sold comps…