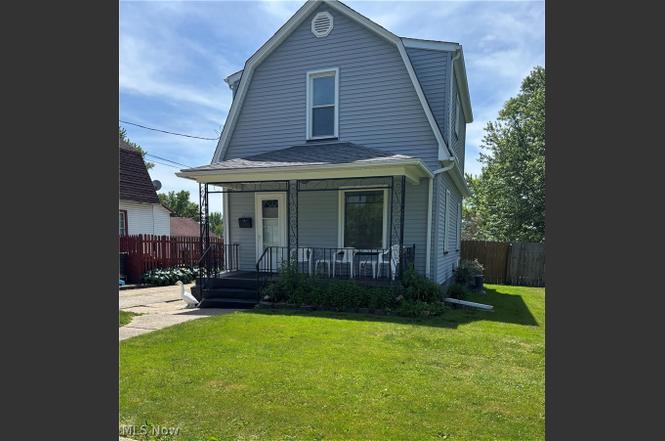
220 Baldwin Ave · Niles, OH
Flood risk 1/10 · Minimal
- FEMA flood zone
- X (unshaded)
- Chance of flooding over 30 yrs
- 0.0%
- Est. flood insurance / yr
- $473 – $860
Fire risk 1/10 · Minimal
- Est. fire insurance / yr
- $713 – $1,323
Heat risk 3/10 · Minor
- Hot days now (above 97°F)
- 7 days/yr
- Hot days in 30 yrs
- 18 days/yr
Wind risk 1/10 · Minimal
- Chance of severe wind over 30 yrs
- —
Air-quality risk 3/10 · Minor
- Unhealthy air days now
- 1 days/yr
- Unhealthy air days in 30 yrs
- 4 days/yr
Risk factors via First Street. Map © Google.
Why this score? — see what drove the C grade
The composite is a weighted blend of 9 inputs, each scored 0–100. Each bar is that input's sub-score; the figure is the points it added to the 100-point composite (weight × sub-score).
- Cash flow +21.1/30.0
- ARV discount +14.3/15.0
- DSCR +6.7/10.0
- 1% rule +4.8/10.0
- Schools +3.7/10.0
- Livability +3.4/5.0
- Rent growth +2.5/5.0
- Condition / age +2.5/5.0
- Appreciation +0.0/10.0
$119,900
🖨 Deal sheet 📄 Offer letter ✓ Due diligence
Listing remarks MLS
Visit this adorable 2 Bedroom, 2 ½ bath cape cod, nestled in a quiet neighborhood. The property boasts a charming foyer leading to a kitchen with plentiful cabinet space and nearby eating area. The living room offers ample space for entertaining, while the first floor office can easily be converted back to original bedroom. (making it a 3 bedroom home). Upstairs, two spacious bedrooms feature generous closet storage and share a full bath. Additional highlights include an immaculate cozy basement with a full bath, an oversized 2 car garage, fenced yard and front porch, ideal for outdoor relaxation. Recent updates within the past decade include tilt windows, roofing, glass block windows, H20 and more.
Key facts
- 8,712 sq ft lot
- 2 garage spots
- Built 1910
Property features AI
Exterior
- Parking: Attached garage facing front; Two garage spaces; Concrete driveway; Garage door opener
- Utilities: Public water; Public sewer
- Home design: Two-story home; Block foundation; Block and vinyl siding construction; Asphalt roof
- Construction: Built (year per public records); Block foundation; Block and vinyl siding exterior; Asphalt roof
- Exterior features: Awning(s); Front porch; Wood fencing in backyard; City lot with front yard
Interior
- Kitchen: Dishwasher; Range; Refrigerator
- Bedrooms: One main-level bedroom
- Bathrooms: Two full bathrooms; One half bathroom; One main-level bathroom
- Heating & cooling: Forced-air gas heating; Central air; Ceiling fans
- Interior features: Entrance foyer; Eat-in kitchen; His and hers closets; Multiple closets; Blinds and window treatments; Laminate counters
- Laundry & utility: Washer and dryer in basement; Full basement
Neighborhood map
What this means for you Summary
Snapshot
- This is a 3-bed/1.0-bath single-family listed at $120k.
Deal economics
- At list price, monthly cash flow is $171 ($2k/yr) — positive.
- The deal already cash-flows at list — no discount required.
- To meet the 1% rule (rent ≥ 1% of price), the offer needs to be $117k (2.0% below list).
- Recommended offer: $117k (2.0% below list) — sets the bar for 1% rule.
- Cap rate 8.0% vs local median 5.8% in Niles — top-decile yield for the area; either an underpriced asset or a hidden risk that comps aren't pricing in. Stress-test before assuming the spread holds.
Location & tenants
- Location reads 67/100 on livability (#628 in OH) — a middle-class / working-renter tenant base. Strengths: cost of living A+, housing A+; Watch: crime D+, employment D, amenities F.
- Niles City (suburban): math 37% / reading 52% proficiency, ranked #507 of 656 in OH (top 77%) — families likely to look elsewhere, expect single-tenant / working-renter base with shorter leases.
- Market conditions: 65 active listings in the ZIP; 5 comparable units currently listed for rent nearby; rentals leasing fast (median 13d on market — plan ~1-2 weeks tenant-placement turnaround); 129 units permitted in Trumbull County in 2024 (0 in 5+ unit buildings).
Forward outlook
- Local home prices are declining (-3.0%/yr); year-one equity from $829 of loan paydown is wiped out by about $4k of value loss. Plan a longer hold.
- Trumbull County population projected at -22% by 2050 — secular population decline; favor cash flow + early exit over multi-decade hold.
Negotiation context
- Only 9 days on market — expect competitive offers; lowballing is unlikely to land.
- 5 sale attempts since 29y ago with the ask held roughly flat each time — persistent listings suggest the price (not the market) is what's stuck; bring a comps-based counter.
- Current owner paid $90k; 33% above their basis — modest negotiation headroom, anchor on the comps not their cost.
Risks & watch-outs
- Watch-outs: built in 1910 — expect roof / HVAC / electrical / plumbing capex.
Questions for the listing agent
- Built in 1910 — when were the roof, HVAC, electrical panel, plumbing, and water heater last replaced?
- Is there a deadline driving the sale (1031 exchange, divorce, estate, relocation)? That informs how much negotiation room exists.
- Schools are B-rated — typically a magnet for longer-tenancy family renters. What's the average tenant stay here, and is there a school-zone premium baked into asking?
- Crime grade is D in this area — have there been break-ins, vandalism, or insurance claims at this property in the last 3 years? What carrier currently insures it and at what premium?
- What's the average days-on-market for RENTAL listings here right now (not sales)? A rising rental-DOM trend means longer vacancies and softer asking-rent achievability than the comps imply.
- What's the recent tenant-quality profile in this submarket — average credit score on applications, eviction rate, late-payment / NSF rate, and stable-employment percentage? A property-management company in the area should have these aggregated.
- How much new for-sale + rental construction is in the pipeline within 1–3 miles? Heavy new supply typically softens prices + rents 12–24 months out; constrained supply supports both.
Investment metrics
- 1% rule
- 0.98% ✗
- Cap rate
- 8.00%
- Cash-on-cash
- 6.11%
- DSCR
- 1.27
- GRM
- 8.5
CMA / ARV
- ARV (on-the-fly)
- $141,384
- Comps found
- 12
Show comp detail 12 sales within ~0.75 mi
| Address | Dist | Beds/Ba | Sqft | Sold | Price | $/sf | Match |
|---|---|---|---|---|---|---|---|
| 114 Russell Ave | 0.16mi | 3/1.0 | 1,140 (+4%) | 4mo | $147,500 | $129 | 83 |
| 213 N Bentley Ave | 0.48mi | 3/1.0 | 1,088 (-1%) | 6mo | $40,000 | $37 | 71 |
| 723 High Ave | 0.36mi | 4/1.0 (+1) | 1,102 (+0%) | 11mo | $135,000 | $123 | 68 |
| 304 Baldwin Ave | 0.04mi | 2/1.0 (-1) | 946 (-14%) | 3mo | $120,000 | $127 | 68 |
| 1476 Stepney St | 0.34mi | 3/2.0 | 1,055 (-4%) | 9mo | $186,850 | $177 | 66 |
| 527 Belmont Ave | 0.38mi | 2/1.5 (-1) | 1,150 (+5%) | 11mo | $106,000 | $92 | 58 |
| 14 Olive St | 0.52mi | 3/1.0 | 1,176 (+7%) | 7mo | $95,000 | $81 | 58 |
| 1442 Youll St | 0.53mi | 3/3.0 | 1,184 (+8%) | 1mo | $168,000 | $142 | 54 |
| 1422 Youll St | 0.51mi | 3/1.0 | 1,198 (+9%) | 10mo | $121,400 | $101 | 52 |
| 1115 Estelle Ct | 0.31mi | 2/1.0 (-1) | 944 (-14%) | 8mo | $136,000 | $144 | 51 |
| 504 Lincoln Ave | 0.65mi | 3/2.0 | 1,175 (+7%) | 4mo | $165,000 | $140 | 51 |
| 220 N Cleveland Ave | 0.45mi | 3/1.5 | 1,235 (+13%) | 10mo | $164,000 | $133 | 48 |
Match score weights: distance 35% · size 25% · config 20% · recency 20%. Top-matched comps best support the ARV.
Projected returns pro-forma
-3.0% appreciation · 3.0% rent growth · sell at horizon
- IRR
- -6.9%
- Equity multiple
- 0.74×
- Total profit
- $-8,574
- Equity at exit
- $17,877
- IRR
- 2.7%
- Equity multiple
- 1.19×
- Total profit
- $6,438
- Equity at exit
- $10,367
Cash invested: $33,572 (down + closing). Projections, not guarantees.
Landlord ↔ Tenant lean methodology
- Overall (STATE)
- 73 Landlord-Friendly
- State Ohio
- 73 Landlord-Friendly · R+6
- County
- — inherits STATE
- City
- — inherits STATE
ZIP-level market 44446
- Home prices YoY
- -19.9%
- Active inventory
- 65
- Price-to-rent
- 8.5×
Monthly cashflow live
- Estimated rent
- $1,175 high interval (Pro) →
- Mortgage (P&I)
- −$629
- Tax from tax record
- −$78 /mo · $942/yr
- Insurance
- −$50
- HOA
- −$0
- Vacancy / Maint / Mgmt
- −$247
- Net cashflow
- $171
Break-even live
UW: 25.0% down · 7.5% · 30yr · 1.5% tax · 5.0% vac · 8.0% maint · 8.0% mgmt
Financing live
Cash to close
- Down payment
- $29,975
- Closing costs
- $3,597
- Reserves months
- —
- Total cash needed
- —
Loan-product check · same deal, 3 products live
Conventional
25% down · 7.5% · 30yr
- Down + closing
- —
- Monthly P&I
- —
- Monthly cashflow
- —
- DSCR
- —
- Eligible?
- —
Personal DTI + credit; lowest rate.
DSCR
20% down · 8.5% · 30yr
- Down + closing
- —
- Monthly P&I
- —
- Monthly cashflow
- —
- DSCR
- —
- Eligible?
- —
No personal income docs; deal must DSCR.
Hard money
10% down · 12.0% · 12mo
- Down + closing
- —
- Monthly P&I
- —
- Monthly cashflow
- —
- DSCR
- —
- Eligible?
- —
Short-term bridge; refi at stabilization.
Rent comps 5 comps
| Address | Beds | Baths | Sqft | Rent | $/sqft | DOM | Units | Dist |
|---|---|---|---|---|---|---|---|---|
| 701 Summit Ave Niles, OH | 2.0 | 1.0–2.0 | 963 | $1,220 | $1.27 | 13d | 1 | 0.32mi |
| 1916 Youll St Niles, OH | 1.0–3.0 | 1.0–1.5 | 1216 | $1,130 | $0.93 | 13d | 1 | 0.85mi |
| 5 Circle St Unit 5 Niles, OH | 2.0 | 1.0 | 1200 | $850 | $0.71 | 13d | 1 | 0.86mi |
| 2122 Robbins Ave Niles, OH | 2.0 | 1.0 | 593 | $905 | $1.52 | 13d | 1 | 0.93mi |
| 35 Neil St #1 Niles, OH | 2.0 | 1.0 | 1264 | $950 | $0.75 | 13d | 1 | 1.26mi |
Listing history 8 events
-
2026-06-19days on market $119,900 Active 9 DOM
-
2026-06-18days on market $119,900 Active 8 DOM
-
2026-06-17days on market $119,900 Active 7 DOM
-
2026-06-16days on market $119,900 Active 6 DOM
-
2026-06-15days on market $119,900 Active 5 DOM
-
2026-06-14days on market $119,900 Active 3 DOM
-
2026-06-13remarks 693-char remark
-
2026-06-13$119,900 Active 2 DOM
ⓘ Source: listings_history table (triggers on properties + properties_extension) + one-shot
backfill from property_details.listing_events for pre-trigger history.
Tax reassessment forecast OH · Partial reset (capped growth)
- Current annual tax
- $942 · $78/mo
- Projected year-2 tax
- $1,406 · $117/mo
- Expected delta
- +$464/yr (+$39/mo · 49.3%)
ⓘ Screening estimate from a state-policy table — verify with the county assessor before closing.
Climate risk First Street
- Flood 1/10 Low FEMA zone X (unshaded) · 0% chance over 30 yrs
- Wildfire 1/10 Low
- Heat 3/10 Moderate 7 d/yr ≥97°F today · 18 d/yr by 30 yrs out
- Wind 1/10 Low
- Air quality 3/10 Moderate 1 unhealthy d/yr today · 4 by 30 yrs out
Nearby sold comps map
Loading sold comps map…
Walkable amenities ~0.75 mi
Loading nearby amenities…
Taxation est. · year 1
- Rental income
- $14,097
- − Mortgage interest
- −$6,716
- − Property taxes
- −$942
- − Insurance
- −$600
- − Repairs & maintenance
- −$1,128
- − Management
- −$1,128
- − Depreciation
- −$3,488
- Taxable income
- $96
- Est. tax owed @ 24.0%
- −$23
- After-tax cash flow
- $2,027/yr
For passive investors: Depreciation is non-cash, so a rental often shows a tax loss while cash-flowing — sheltering income. Rental losses are passive: they offset passive income freely, and up to $25,000/yr can offset ordinary (W-2) income if you actively participate and your MAGI is under $100k (phasing out to $0 by $150k); unused losses carry forward. On sale, claimed depreciation is recaptured at up to 25%, and gains may owe capital-gains tax (a 1031 exchange can defer both). Figures are a year-1 estimate at your 24.0% rate — not tax advice; consult a CPA.
Schools (NCES district)
- District
- Niles City
- NCES district ID
- 3904449
- Math proficiency
- 37% ▼ -22.00%
- Reading proficiency
- 52% ▼ -11.00%
- Median HH income
- $37,965
- Composite
- 37.02/100
- National rank
- #4517
- State rank
- #507 of 656 in OH
Livability — Niles
- Score
- 67/100
- State rank
- #628
- US rank
- #11037
Category grades
Schools grade is shown separately in the Schools card above.
Census & demographics
- Census place
- Niles, OH
- County
- Trumbull County · 61,158 people
- City population
- 20,060
- Metro
- Youngstown-Warren-Boardman, OH-PA
- Population (ZIP)
- 20,060
- Household income
- $50,468
- Rent vs Own
- Severe rent burden
- 820.0
Population outlook (Trumbull County) Hauer SSP2
- Today (2025)
- 191,696 people
- By 2030
- 184,015 · -4.0%
- By 2040
- 166,810 · -13.0%
- By 2050
- 149,857 · -21.8%
- By 2075
- 115,769 · -39.6%
- By 2100
- 83,617 · -56.4%
Race, ethnicity, and origin ACS 2023
- Neighborhood character
- Predominantly White (88%)
- Race & ethnicity
- White 88% Two or more races 6% Black 4% Hispanic / Latino 3%
- Common ancestry
- Romanian 2% Slovak 1% Subsaharan African 1%
- Foreign-born
- 1%
- Languages at home
- 98% English-only · Spanish 1%
Political lean MEDSL · Trumbull
- 2024 margin
- R (+16.8) · D 41.2% · R 58.0%
- 2008→2024 swing
- -39.2pp toward R · 2008: 22.4pp · 2024: -16.8pp
- All cycles
- 2024: R+16.8 2020: R+10.6 2016: R+6.4 2012: D+22.2 2008: D+22.4
Not yet ingested
- Civics
- —
Market trends
- HPI YoY
- ▼ -49.52%
- Current HPI
- 198.7738
- Rent YoY
- —
- Metro
- Youngstown-Warren-Boardman, OH-PA
- State GDP YoY
- ▲ 1.98%
- F500 in state
- 48
Industry mix (Fortune 500 HQ in OH)
| Industry | F500 HQs | Revenue |
|---|---|---|
| Insurance | 3 | $145B |
|
||
| Industrial Machinery | 3 | $49B |
|
||
| Financial Services | 3 | $24B |
|
||
| Consumer Goods | 2 | $93B |
|
||
| Aerospace / Defense | 2 | $47B |
|
||
| Utilities | 2 | $33B |
|
||
Price history
+185.5% since first listed21 events — show timeline
- 2026-06-09 Listed $119,900 MLSNOW
- 2024-12-23 Sold (Public Records) $90,000 Public Records
- 2024-12-20 Sold (MLS) $90,000 MLSNOW
- 2024-11-22 Pending — MLSNOW
- 2024-11-18 Listed $103,900 MLSNOW
- 2023-08-26 Price Changed $59,900 MLSNOW
- 2020-11-04 Price Changed $59,900 MLSNOW
- 2020-08-25 Price Changed $59,900 MLSNOW
- 2015-05-16 Price Changed $65,000 MLSNOW
- 2014-02-12 Price Changed $59,900 MLSNOW
- 2004-03-30 Listing Removed — MLSNOW
- 2003-08-30 Listed $59,900 MLSNOW
- 2001-10-01 Sold (Public Records) $42,000 Public Records
- 2000-06-01 Listing Removed — MLSNOW
- 2000-06-01 Price Changed $65,000 MLSNOW
- 2000-06-01 Price Changed $65,000 MLSNOW
- 2000-06-01 Price Changed $65,000 MLSNOW
- 1997-10-19 Listed $59,900 MLSNOW
- 1997-06-18 Listing Removed — MLSNOW
- 1997-01-18 Listed $58,000 MLSNOW
- 1995-11-02 Sold (Public Records) $42,000 Public Records
Property tax history
+0.5%/yrLatest (2025): $942 · +79.7% YoY. Source: county tax records.
Cash-flow waterfall
monthlySold comps — $/sqft
last 12 mo · ≤1 miLoading sold comps…