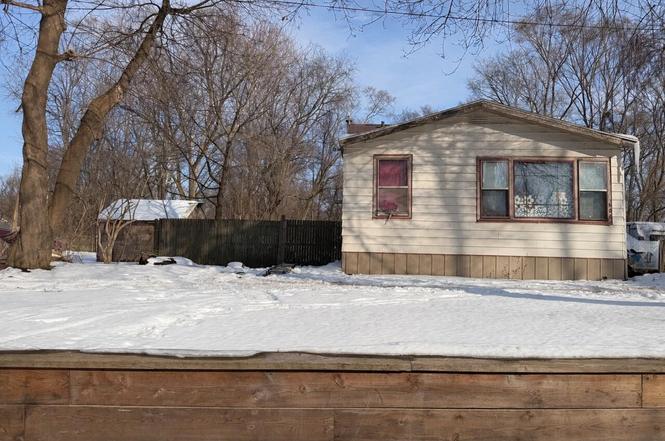
608 Pickard St · Eastwood, MI
Flood risk 1/10 · Minimal
- FEMA flood zone
- X (unshaded)
- Chance of flooding over 30 yrs
- 0.0%
- Est. flood insurance / yr
- $473 – $860
Fire risk 1/10 · Minimal
- Est. fire insurance / yr
- $784 – $1,456
Heat risk 2/10 · Minimal
- Hot days now (above 98°F)
- 7 days/yr
- Hot days in 30 yrs
- 16 days/yr
Wind risk 2/10 · Minimal
- Chance of severe wind over 30 yrs
- —
Air-quality risk 2/10 · Minimal
- Unhealthy air days now
- 1 days/yr
- Unhealthy air days in 30 yrs
- 2 days/yr
Risk factors via First Street. Map © Google.
Why this score? — see what drove the B- grade
The composite is a weighted blend of 9 inputs, each scored 0–100. Each bar is that input's sub-score; the figure is the points it added to the 100-point composite (weight × sub-score).
- Cash flow +30.0/30.0
- DSCR +10.0/10.0
- 1% rule +8.9/10.0
- ARV discount +7.5/15.0
- Rent growth +4.5/5.0
- Livability +3.7/5.0
- Condition / age +2.5/5.0
- Schools +2.1/10.0
- Appreciation +0.0/10.0
$79,900
🖨 Deal sheet (PDF) 📄 Offer letter ✓ Due diligence
Listing remarks MLS
2 bed / 1 bath, 804 sq ft home on a . 22-acre lot in Comstock Township. Features a full basement and pole barn -- perfect for storage or a workshop. Great value-add opportunity for investors or flippers, with strong rental or resale potential.
Key facts
- Pole barn
- Full basement
- Storage or workshop
Tags
Neighborhood map
What this means for you Summary
Snapshot
- This is a 2-bed/1.0-bath single-family listed at $80k.
Deal economics
- At list price, monthly cash flow is $333 ($4k/yr) — positive.
- The deal already cash-flows at list — no discount required.
- Meets the 1% rule at list price ($1k rent vs $80k).
- Cap rate 11.3% vs local median 5.4% in Eastwood — top-decile yield for the area; either an underpriced asset or a hidden risk that comps aren't pricing in. Stress-test before assuming the spread holds.
Location & tenants
- Location reads 74/100 on livability (#187 in MI, #4,713 nationally) — a middle-class / working-renter tenant base. Strengths: cost of living A+, housing A+, health & safety A+; Watch: schools C-, crime C-, employment D+.
- Comstock Public Schools (suburban): math 18% / reading 32% proficiency, ranked #428 of 540 in MI (top 79%) — low school quality limits family demand, transient renter base, plan for 1-2y turnover; 65% free/reduced lunch — lower-income household profile, screen leases tightly.
- Market conditions: Rents rising fast (+7.9%/yr); 155 active listings in the ZIP; 7 comparable units currently listed for rent nearby; rentals at typical pace (median 22d on market — plan ~3-4 weeks tenant-placement turnaround); 339 units permitted in Kalamazoo County in 2024 (22 in 5+ unit buildings).
Forward outlook
- Local home prices are declining (-3.0%/yr); year-one equity from $552 of loan paydown is wiped out by about $2k of value loss. Plan a longer hold.
- Kalamazoo County population projected at +18% by 2050 — long-run rental-demand tailwind backs the buy-and-hold thesis.
- At projected returns (-3.0% appreciation + 7.9% rent growth), your $22k cash investment doubles in ~6 years — after that, you're playing with house money.
Negotiation context
- Only 6 days on market — expect competitive offers; lowballing is unlikely to land.
- 7 sale attempts since 13y ago with the ask held roughly flat each time — persistent listings suggest the price (not the market) is what's stuck; bring a comps-based counter.
- Current owner paid $15k; list at $80k implies a 433% gain — meaningful room to come down on a strong offer.
Risks & watch-outs
- Watch-outs: built in 1948 — expect roof / HVAC / electrical / plumbing capex.
Questions for the listing agent
- Built in 1948 — when were the roof, HVAC, electrical panel, plumbing, and water heater last replaced?
- Is there a deadline driving the sale (1031 exchange, divorce, estate, relocation)? That informs how much negotiation room exists.
- What's the average days-on-market for RENTAL listings here right now (not sales)? A rising rental-DOM trend means longer vacancies and softer asking-rent achievability than the comps imply.
- What's the recent tenant-quality profile in this submarket — average credit score on applications, eviction rate, late-payment / NSF rate, and stable-employment percentage? A property-management company in the area should have these aggregated.
- How much new for-sale + rental construction is in the pipeline within 1–3 miles? Heavy new supply typically softens prices + rents 12–24 months out; constrained supply supports both.
Investment metrics
- 1% rule
- 1.39% ✓
- Cap rate
- 11.29%
- Cash-on-cash
- 17.86%
- DSCR
- 1.79
- GRM
- 6.0
CMA / ARV
- ARV (on-the-fly)
- $173,664
- Comps found
- 3
Show comp detail 3 sales within ~0.75 mi
| Address | Dist | Beds/Ba | Sqft | Sold | Price | $/sf | Match |
|---|---|---|---|---|---|---|---|
| 5503 Comstock Ave | 0.70mi | 2/1.0 | 816 (+2%) | 7mo | $185,000 | $227 | 59 |
| 330 Rystock St | 0.69mi | 2/1.0 | 840 (+4%) | 17mo | $155,000 | $185 | 46 |
| 100 Packard St | 0.66mi | 2/1.0 | 751 (-7%) | 15mo | $162,000 | $216 | 45 |
Match score weights: distance 35% · size 25% · config 20% · recency 20%. Top-matched comps best support the ARV.
Projected returns pro-forma
-3.0% appreciation · 7.88% rent growth · sell at horizon
- IRR
- 14.8%
- Equity multiple
- 1.63×
- Total profit
- $14,015
- Equity at exit
- $11,913
- IRR
- 26.9%
- Equity multiple
- 3.93×
- Total profit
- $65,626
- Equity at exit
- $6,908
Cash invested: $22,372 (down + closing). Projections, not guarantees.
Landlord ↔ Tenant lean methodology
- Overall (STATE)
- 62 Landlord-Friendly
- State Michigan
- 62 Landlord-Friendly · EVEN
- County
- — inherits STATE
- City
- — inherits STATE
ZIP-level market 49048
- Rents YoY
- 7.9%
- Active inventory
- 155
- Price-to-rent
- 6.0×
Monthly cashflow live
- Estimated rent
- $1,114 high interval (Pro) →
- Mortgage (P&I)
- −$419
- Tax from tax record
- −$95 /mo · $1,137/yr
- Insurance
- −$33
- HOA
- −$0
- Vacancy / Maint / Mgmt
- −$234
- Net cashflow
- $333
Break-even live
Sensitivity live
| Price | -10% $378 | -5% $356 | +0% $333 | +5% $310 | +10% $288 |
|---|---|---|---|---|---|
| Rent | -10% $245 | -5% $289 | +0% $333 | +5% $377 | +10% $421 |
| Rate | -1.0pp $373 | -0.5pp $353 | base $333 | +0.5pp $312 | +1.0pp $291 |
UW: 25.0% down · 7.5% · 30yr · 1.5% tax · 5.0% vac · 8.0% maint · 8.0% mgmt
Financing live
Cash to close
- Down payment
- $19,975
- Closing costs
- $2,397
- Reserves months
- —
- Total cash needed
- —
Loan-product check · same deal, 3 products live
Conventional
25% down · 7.5% · 30yr
- Down + closing
- —
- Monthly P&I
- —
- Monthly cashflow
- —
- DSCR
- —
- Eligible?
- —
Personal DTI + credit; lowest rate.
DSCR
20% down · 8.5% · 30yr
- Down + closing
- —
- Monthly P&I
- —
- Monthly cashflow
- —
- DSCR
- —
- Eligible?
- —
No personal income docs; deal must DSCR.
Hard money
10% down · 12.0% · 12mo
- Down + closing
- —
- Monthly P&I
- —
- Monthly cashflow
- —
- DSCR
- —
- Eligible?
- —
Short-term bridge; refi at stabilization.
Rent comps 7 comps
| Address | Beds | Baths | Sqft | Rent | $/sqft | DOM | Units | Dist |
|---|---|---|---|---|---|---|---|---|
| 6133 King Hwy Unit B Kalamazoo, MI | 2.0 | 1.0 | 650 | $999 | $1.54 | 14d | 1 | 0.89mi |
| 6314 E Jk Ave Kalamazoo, MI | 2.0 | 1.0 | 760 | $950 | $1.25 | 22d | 1 | 0.94mi |
| 6225 Copeland Ave Unit b Kalamazoo, MI | 1.0 | 1.0 | 580 | $899 | $1.55 | 22d | 1 | 0.95mi |
| 6225 Copeland Ave Unit 1 Kalamazoo, MI | 1.0 | 1.0 | 580 | $875 | $1.51 | 14d | 1 | 0.95mi |
| 621 Washburn Ave Kalamazoo, MI | 2.0 | 1.0 | 720 | $1,300 | $1.81 | 22d | 1 | 1.38mi |
| 2024 Sunnyside Dr Kalamazoo, MI | 1.0–2.0 | 1.0 | 740 | $1,000 | $1.35 | 14d | 1 | 1.48mi |
| 1926 Sunnyside Dr Kalamazoo, MI | 2.0 | 1.5 | 1020 | $1,200 | $1.18 | 22d | 1 | 1.49mi |
Listing history 14 events
-
2026-02-25status Pending 243-char remark
Show marketing remark (243 chars)
2 bed / 1 bath, 804 sq ft home on a . 22-acre lot in Comstock Township. Features a full basement and pole barn -- perfect for storage or a workshop. Great value-add opportunity for investors or flippers, with strong rental or resale potential.
-
2026-02-25status Pending
Show marketing remark (243 chars)
2 bed / 1 bath, 804 sq ft home on a . 22-acre lot in Comstock Township. Features a full basement and pole barn -- perfect for storage or a workshop. Great value-add opportunity for investors or flippers, with strong rental or resale potential.
-
2026-02-19$79,900 Active 243-char remark
Show marketing remark (243 chars)
2 bed / 1 bath, 804 sq ft home on a . 22-acre lot in Comstock Township. Features a full basement and pole barn -- perfect for storage or a workshop. Great value-add opportunity for investors or flippers, with strong rental or resale potential.
-
2026-02-19$79,900 Active
Show marketing remark (243 chars)
2 bed / 1 bath, 804 sq ft home on a . 22-acre lot in Comstock Township. Features a full basement and pole barn -- perfect for storage or a workshop. Great value-add opportunity for investors or flippers, with strong rental or resale potential.
-
2014-01-07soldstatus $15,000
-
2014-01-07soldstatus $15,000
-
2013-10-15$18,400
-
2013-10-15$18,400
-
2013-10-15$21,400
-
2013-10-15historical
-
2013-10-15historical
-
2013-10-15$21,400
ⓘ Source: listings_history table (triggers on properties + properties_extension) + one-shot
backfill from property_details.listing_events for pre-trigger history.
Tax reassessment forecast MI · Partial reset (capped growth)
- Current annual tax
- $1,137 · $95/mo
- Projected year-2 tax
- $1,184 · $99/mo
- Expected delta
- +$47/yr (+$4/mo · 4.1%)
ⓘ Screening estimate from a state-policy table — verify with the county assessor before closing.
Climate risk First Street
- Flood 1/10 Low FEMA zone X (unshaded) · 0% chance over 30 yrs
- Wildfire 1/10 Low
- Heat 2/10 Low 7 d/yr ≥98°F today · 16 d/yr by 30 yrs out
- Wind 2/10 Low
- Air quality 2/10 Low 1 unhealthy d/yr today · 2 by 30 yrs out
Nearby sold comps map
Loading sold comps map…
Walkable amenities ~0.75 mi
Loading nearby amenities…
Taxation est. · year 1
- Rental income
- $13,368
- − Mortgage interest
- −$4,476
- − Property taxes
- −$1,137
- − Insurance
- −$400
- − Repairs & maintenance
- −$1,069
- − Management
- −$1,069
- − Depreciation
- −$2,324
- Taxable income
- $2,893
- Est. tax owed @ 24.0%
- −$694
- After-tax cash flow
- $3,302/yr
For passive investors: Depreciation is non-cash, so a rental often shows a tax loss while cash-flowing — sheltering income. Rental losses are passive: they offset passive income freely, and up to $25,000/yr can offset ordinary (W-2) income if you actively participate and your MAGI is under $100k (phasing out to $0 by $150k); unused losses carry forward. On sale, claimed depreciation is recaptured at up to 25%, and gains may owe capital-gains tax (a 1031 exchange can defer both). Figures are a year-1 estimate at your 24.0% rate — not tax advice; consult a CPA.
Schools (NCES district)
- District
- Comstock Public Schools
- NCES district ID
- 2610590
- Math proficiency
- 18% ▼ -2.00%
- Reading proficiency
- 32% ▼ -1.00%
- Median HH income
- $41,293
- Composite
- 21.17/100
- National rank
- #8423
- State rank
- #428 of 540 in MI
Livability — Eastwood
- Score
- 74/100
- State rank
- #187
- US rank
- #4713
Category grades
Schools grade is shown separately in the Schools card above.
Census & demographics
- County
- Kalamazoo County · 224,317 people
- Metro
- Kalamazoo-Portage, MI
- Population (ZIP)
- 22,791
- Household income
- $60,454
- Rent vs Own
- Severe rent burden
- 835.0
Population outlook (Kalamazoo County) Hauer SSP2
- Today (2025)
- 280,982 people
- By 2030
- 292,068 · +3.9%
- By 2040
- 312,191 · +11.1%
- By 2050
- 331,196 · +17.9%
- By 2075
- 379,021 · +34.9%
- By 2100
- 396,579 · +41.1%
Race, ethnicity, and origin ACS 2023
- Neighborhood character
- Predominantly White (67%)
- Race & ethnicity
- White 67% Black 20% Hispanic / Latino 7% Two or more races 7% Asian 2%
- Hispanic origin (detail)
- Mexican 4%
- Common ancestry
- Iranian 6% Romanian 4% Lithuanian 2%
- Foreign-born
- 4% · Canada
- Languages at home
- 94% English-only · Spanish 3% Other Indo-European 1%
Political lean MEDSL · Kalamazoo
- 2024 margin
- D (+17.7) · D 58.0% · R 40.3% · Other 1.7%
- 2008→2024 swing
- -1.8pp toward R · 2008: 19.5pp · 2024: 17.7pp
- All cycles
- 2024: D+17.7 2020: D+18.7 2016: D+12.8 2012: D+13.3 2008: D+19.5
Not yet ingested
- Civics
- —
Market trends
- HPI YoY
- ▼ -205.26%
- Current HPI
- 180.4766
- Rent YoY
- ▲ 7.88%
- Metro
- Kalamazoo-Portage, MI
- State GDP YoY
- ▲ 1.37%
- F500 in state
- 28
Industry mix (Fortune 500 HQ in MI)
| Industry | F500 HQs | Revenue |
|---|---|---|
| Automotive Parts | 3 | $48B |
|
||
| Automotive | 2 | $372B |
|
||
| Chemicals | 1 | $45B |
|
||
| Automotive Retail | 1 | $29B |
|
||
| Healthcare / Medical Devices | 1 | $23B |
|
||
| Automotive Technology | 1 | $20B |
|
||
Price history
+334.2% since first listed14 events — show timeline
- 2026-02-25 Pending — REALCOMP
- 2026-02-25 Pending — MiRealSource-MiMLS
- 2026-02-25 Pending — SW Michigan MLS
- 2026-02-19 Listed $79,900 SW Michigan MLS
- 2026-02-19 Listed $79,900 MiRealSource-MiMLS
- 2026-02-19 Listed $79,900 REALCOMP
- 2014-01-07 Sold (MLS) $15,000 REALCOMP
- 2014-01-07 Sold (MLS) $15,000 SW Michigan MLS
- 2013-10-15 Listed $21,400 SW Michigan MLS
- 2013-10-15 Listing Removed — SW Michigan MLS
- 2013-10-15 Listing Removed — REALCOMP
- 2013-10-15 Listed $21,400 REALCOMP
- 2013-10-15 Listed $18,400 REALCOMP
- 2013-10-15 Listed $18,400 SW Michigan MLS
Property tax history
+7.1%/yrLatest (2025): $1,137 · +5.3% YoY. Source: county tax records.
Cash-flow waterfall
monthlySold comps — $/sqft
last 12 mo · ≤1 miLoading sold comps…