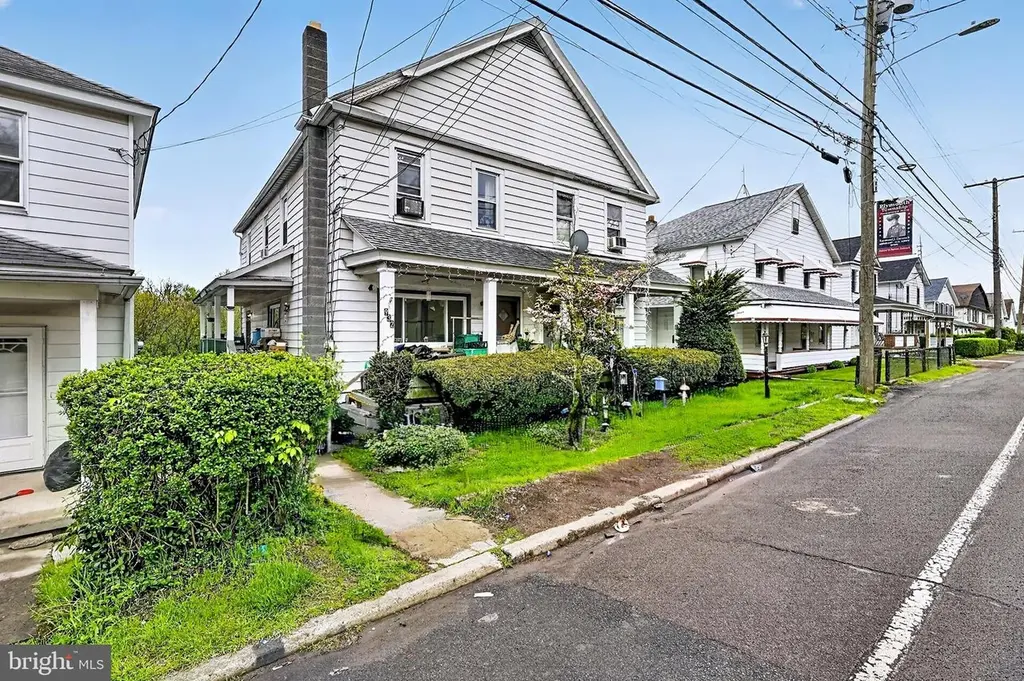
932 Main · Plymouth, PA
Flood risk 1/10 · Minimal
- FEMA flood zone
- X (unshaded)
- Chance of flooding over 30 yrs
- 0.0%
- Est. flood insurance / yr
- $507 – $1,088
Fire risk 4/10 · Minor
- Est. fire insurance / yr
- $511 – $949
Heat risk 4/10 · Minor
- Hot days now (above 96°F)
- 7 days/yr
- Hot days in 30 yrs
- 17 days/yr
Wind risk 3/10 · Minor
- Chance of severe wind over 30 yrs
- 5.0%
Air-quality risk 1/10 · Minimal
- Unhealthy air days now
- 0 days/yr
- Unhealthy air days in 30 yrs
- 0 days/yr
Risk factors via First Street. Map © Google.
Why this score? — see what drove the B+ grade
The composite is a weighted blend of 9 inputs, each scored 0–100. Each bar is that input's sub-score; the figure is the points it added to the 100-point composite (weight × sub-score).
- Cash flow +30.0/30.0
- ARV discount +15.0/15.0
- 1% rule +10.0/10.0
- DSCR +10.0/10.0
- Livability +3.3/5.0
- Rent growth +2.5/5.0
- Condition / age +2.5/5.0
- Schools +2.0/10.0
- Appreciation +0.0/10.0
$74,990
🖨 Deal sheet 📄 Offer letter ✓ Due diligence
Listing remarks MLS
3 Bedroom 1/2 double close to the highway and stores. Room to make off-street parking in the back and still have a decent size yard. House is being sold AS IS.
Key facts
- Pool
- Built 1900
- Listed 10 days
Property features AI
Exterior
- Parking: Alley access; Off-street parking
- Utilities: Public water; Public sewer; Natural gas hot water
- Home design: Semi-detached home; Frame construction with vinyl siding; Built year estimated; Excellent condition; Fee simple ownership; Not winterized
- Construction: Block foundation
- Exterior features: Above-ground personal pool
Interior
- Bedrooms: Three bedrooms on the main level
- Flooring: Carpet; Laminate plank
- Bathrooms: One full bathroom (one full bath on main level)
- Heating & cooling: Natural gas heating; 90% efficient forced air heating; Central heating; Window air conditioning units
- Interior features: Doors swing inward (standard doors); Partially finished basement; Basement present
- Laundry & utility: Laundry in the basement
Neighborhood map
What this means for you Summary
Snapshot
- This is a 3-bed/1.0-bath townhouse listed at $75k.
Deal economics
- At list price, monthly cash flow is $642 ($8k/yr) — positive.
- The deal already cash-flows at list — no discount required.
- Meets the 1% rule at list price ($1k rent vs $75k).
- Cap rate 16.6% vs local median 8.3% in Plymouth — top-decile yield for the area; either an underpriced asset or a hidden risk that comps aren't pricing in. Stress-test before assuming the spread holds.
Location & tenants
- Location reads 66/100 on livability (#1,068 in PA) — a middle-class / working-renter tenant base. Strengths: cost of living A+, health & safety A+, housing B+; Watch: employment D, crime F, amenities F.
- Greater Nanticoke Area SD (suburban): math 14% / reading 34% proficiency, ranked #479 of 539 in PA (top 89%) — low school quality limits family demand, transient renter base, plan for 1-2y turnover.
- Zoned schools: Greater Nanticoke Area Ed Ctr (math 4% / reading 32%, grade F, #453 of 512 statewide, top 89%, 539 students, 100% FRL); Greater Nanticoke Area Shs (math 52%, 714 students, 89% FRL) — zoned schools average 94% FRL vs 52% district-wide (42 pts higher); higher-poverty schools than district average — tighter screening recommended.
- Market conditions: 61 active listings in the ZIP; 9 comparable units currently listed for rent nearby; rentals leasing fast (median 14d on market — plan ~1-2 weeks tenant-placement turnaround); 349 units permitted in Luzerne County in 2024 (16 in 5+ unit buildings).
Forward outlook
- Local home prices are declining (-3.0%/yr); year-one equity from $518 of loan paydown is wiped out by about $2k of value loss. Plan a longer hold.
- Luzerne County population projected at +4% by 2050 — modest demand growth; plan on rents tracking national, not racing it.
- At projected returns (-3.0% appreciation + 3.0% rent growth), your $21k cash investment doubles in ~4 years — after that, you're playing with house money.
Negotiation context
- Only 10 days on market — expect competitive offers; lowballing is unlikely to land.
Risks & watch-outs
- Watch-outs: built in 1900 — expect roof / HVAC / electrical / plumbing capex.
Questions for the listing agent
- Built in 1900 — when were the roof, HVAC, electrical panel, plumbing, and water heater last replaced?
- Is there a deadline driving the sale (1031 exchange, divorce, estate, relocation)? That informs how much negotiation room exists.
- Crime grade is F in this area — have there been break-ins, vandalism, or insurance claims at this property in the last 3 years? What carrier currently insures it and at what premium?
- What's the average days-on-market for RENTAL listings here right now (not sales)? A rising rental-DOM trend means longer vacancies and softer asking-rent achievability than the comps imply.
- What's the recent tenant-quality profile in this submarket — average credit score on applications, eviction rate, late-payment / NSF rate, and stable-employment percentage? A property-management company in the area should have these aggregated.
- How much new for-sale + rental construction is in the pipeline within 1–3 miles? Heavy new supply typically softens prices + rents 12–24 months out; constrained supply supports both.
Investment metrics
- 1% rule
- 1.95% ✓
- Cap rate
- 16.57%
- Cash-on-cash
- 36.72%
- DSCR
- 2.63
- GRM
- 4.3
CMA / ARV
- ARV (on-the-fly)
- $99,456
- Comps found
- 1
Show comp detail 1 sale within ~0.75 mi
| Address | Dist | Beds/Ba | Sqft | Sold | Price | $/sf | Match |
|---|---|---|---|---|---|---|---|
| 18 Blair St | 0.60mi | 2/1.5 (-1) | 1,218 (-9%) | 21mo | $90,000 | $74 | 32 |
Match score weights: distance 35% · size 25% · config 20% · recency 20%. Top-matched comps best support the ARV.
Projected returns pro-forma
-3.0% appreciation · 3.0% rent growth · sell at horizon
- IRR
- 32.6%
- Equity multiple
- 2.37×
- Total profit
- $28,786
- Equity at exit
- $11,181
- IRR
- 39.6%
- Equity multiple
- 4.71×
- Total profit
- $77,833
- Equity at exit
- $6,484
Cash invested: $20,997 (down + closing). Projections, not guarantees.
Landlord ↔ Tenant lean methodology
- Overall (STATE)
- 62 Landlord-Friendly
- State Pennsylvania
- 62 Landlord-Friendly · EVEN
- County
- — inherits STATE
- City
- — inherits STATE
ZIP-level market 18651
- Home prices YoY
- -11.5%
- Active inventory
- 61
- Price-to-rent
- 4.3×
Monthly cashflow live
- Estimated rent
- $1,463 high interval (Pro) →
- Mortgage (P&I)
- −$393
- Tax from tax record
- −$89 /mo · $1,063/yr
- Insurance
- −$31
- HOA
- −$0
- Vacancy / Maint / Mgmt
- −$307
- Net cashflow
- $642
Break-even live
UW: 25.0% down · 7.5% · 30yr · 1.5% tax · 5.0% vac · 8.0% maint · 8.0% mgmt
Financing live
Cash to close
- Down payment
- $18,748
- Closing costs
- $2,250
- Reserves months
- —
- Total cash needed
- —
Loan-product check · same deal, 3 products live
Conventional
25% down · 7.5% · 30yr
- Down + closing
- —
- Monthly P&I
- —
- Monthly cashflow
- —
- DSCR
- —
- Eligible?
- —
Personal DTI + credit; lowest rate.
DSCR
20% down · 8.5% · 30yr
- Down + closing
- —
- Monthly P&I
- —
- Monthly cashflow
- —
- DSCR
- —
- Eligible?
- —
No personal income docs; deal must DSCR.
Hard money
10% down · 12.0% · 12mo
- Down + closing
- —
- Monthly P&I
- —
- Monthly cashflow
- —
- DSCR
- —
- Eligible?
- —
Short-term bridge; refi at stabilization.
Rent comps 9 comps
| Address | Beds | Baths | Sqft | Rent | $/sqft | DOM | Units | Dist |
|---|---|---|---|---|---|---|---|---|
| 18 North St Plymouth, PA | 2.0 | 1.0 | 1200 | $1,300 | $1.08 | 13d | 1 | 0.27mi |
| 657 W Main St Plymouth, PA | 3.0 | 1.0 | 1600 | $1,700 | $1.06 | 13d | 1 | 0.44mi |
| 29 Franklin St Plymouth, PA | 3.0 | 1.0 | 1426 | $1,800 | $1.26 | 13d | 1 | 0.52mi |
| 134 Blair St Plymouth, PA | 3.0 | 1.0 | 1300 | $1,300 | $1.00 | 20d | 1 | 0.63mi |
| 463 2nd St Plymouth, PA | 3.0 | 1.0 | 1250 | $1,500 | $1.20 | 43d | 1 | 0.84mi |
| 338 W Shawnee Ave Plymouth, PA | 2.0 | 1.5 | 945 | $1,550 | $1.64 | 13d | 1 | 0.92mi |
| 210-212 Center Ave Plymouth, PA | 3.0 | 1.0 | 1300 | $1,200 | $0.92 | 43d | 1 | 1.28mi |
| 48 E Shawnee Ave Plymouth, PA | 3.0 | 1.0 | 1500 | $1,250 | $0.83 | 13d | 1 | 1.34mi |
| 92 Diamond Ave Hanover Township, PA | 3.0 | 1.0 | 1150 | $1,400 | $1.22 | 44d | 1 | 1.43mi |
Listing history 12 events
-
2026-06-18days on market $74,990 Active 10 DOM
-
2026-06-17days on market $74,990 Active 9 DOM
-
2026-06-16days on market $74,990 Active 8 DOM
-
2026-06-15days on market $74,990 Active 7 DOM
-
2026-06-14days on market $74,990 Active 5 DOM
-
2026-06-13days on market $74,990 Active 4 DOM
-
2026-06-10days on market $74,990 Active 2 DOM
-
2026-06-09statusdays on market $74,990 Active 1 DOM
-
2026-06-08days on market $74,990 Coming Soon 4 DOM
-
2026-06-07days on market $74,990 Coming Soon 3 DOM
-
2026-06-05remarks 693-char remark
-
2026-06-05$74,990 Coming Soon 1 DOM
ⓘ Source: listings_history table (triggers on properties + properties_extension) + one-shot
backfill from property_details.listing_events for pre-trigger history.
Tax reassessment forecast PA · Partial reset (capped growth)
- Current annual tax
- $1,063 · $89/mo
- Projected year-2 tax
- $1,124 · $94/mo
- Expected delta
- +$61/yr (+$5/mo · 5.7%)
ⓘ Screening estimate from a state-policy table — verify with the county assessor before closing.
Climate risk First Street
- Flood 1/10 Low FEMA zone X (unshaded) · 0% chance over 30 yrs
- Wildfire 4/10 Moderate
- Heat 4/10 Moderate 7 d/yr ≥96°F today · 17 d/yr by 30 yrs out
- Wind 3/10 Moderate 5% chance of damaging wind over 30 yrs
- Air quality 1/10 Low 0 unhealthy d/yr today · 0 by 30 yrs out
Nearby sold comps map
Loading sold comps map…
Walkable amenities ~0.75 mi
Loading nearby amenities…
Taxation est. · year 1
- Rental income
- $17,553
- − Mortgage interest
- −$4,201
- − Property taxes
- −$1,063
- − Insurance
- −$375
- − Repairs & maintenance
- −$1,404
- − Management
- −$1,404
- − Depreciation
- −$2,182
- Taxable income
- $6,924
- Est. tax owed @ 24.0%
- −$1,662
- After-tax cash flow
- $6,048/yr
For passive investors: Depreciation is non-cash, so a rental often shows a tax loss while cash-flowing — sheltering income. Rental losses are passive: they offset passive income freely, and up to $25,000/yr can offset ordinary (W-2) income if you actively participate and your MAGI is under $100k (phasing out to $0 by $150k); unused losses carry forward. On sale, claimed depreciation is recaptured at up to 25%, and gains may owe capital-gains tax (a 1031 exchange can defer both). Figures are a year-1 estimate at your 24.0% rate — not tax advice; consult a CPA.
Schools (NCES district)
- District
- Greater Nanticoke Area SD
- NCES district ID
- 4216290
- Math proficiency
- 14% ▼ -8.00%
- Reading proficiency
- 34% ▼ -14.00%
- Median HH income
- $38,990
- Composite
- 20.1/100
- National rank
- #8647
- State rank
- #479 of 539 in PA
Livability — Plymouth
- Score
- 66/100
- State rank
- #1068
- US rank
- #12056
Category grades
Schools grade is shown separately in the Schools card above.
Census & demographics
- Population (ZIP)
- 8,672
Population outlook (Luzerne County) Hauer SSP2
- Today (2025)
- 319,505 people
- By 2030
- 319,943 · +0.1%
- By 2040
- 322,643 · +1.0%
- By 2050
- 330,817 · +3.5%
- By 2075
- 379,145 · +18.7%
- By 2100
- 431,908 · +35.2%
Race, ethnicity, and origin ACS 2023
- Neighborhood character
- Predominantly White (82%)
- Race & ethnicity
- White 82% Hispanic / Latino 10% Black 5% Two or more races 4%
- Hispanic origin (detail)
- Mexican 3% Dominican 5%
- Common ancestry
- Romanian 19% Scotch-Irish 2% Iranian 2%
- Foreign-born
- 5% · Canada
- Languages at home
- 91% English-only · Spanish 7% Other Indo-European 1%
Political lean MEDSL · Luzerne
- 2024 margin
- R (+19.2) · D 40.0% · R 59.2%
- 2008→2024 swing
- -27.6pp toward R · 2008: 8.4pp · 2024: -19.2pp
- All cycles
- 2024: R+19.2 2020: R+14.4 2016: R+19.6 2012: D+4.8 2008: D+8.4
Not yet ingested
- Civics
- —
Market trends
- HPI YoY
- ▼ -29.78%
- Current HPI
- 229.6791
- Rent YoY
- —
- Metro
- —
- State GDP YoY
- ▲ 1.68%
- F500 in state
- 34
Industry mix (Fortune 500 HQ in PA)
| Industry | F500 HQs | Revenue |
|---|---|---|
| Healthcare | 2 | $309B |
|
||
| Insurance | 2 | $27B |
|
||
| Telecommunications / Media | 1 | $124B |
|
||
| Industrial Distribution | 1 | $22B |
|
||
| Financial Services | 1 | $20B |
|
||
| Chemicals / Materials | 1 | $18B |
|
||
Price history
+7.3% since first listed5 events — show timeline
- 2026-06-04 Coming Soon $74,990 BRIGHT MLS
- 2023-10-12 Sold (Public Records) $65,500 Public Records
- 2023-10-10 Sold (MLS) $65,500 LCAR
- 2023-09-06 Pending — LCAR
- 2023-08-20 Listed $69,900 LCAR
Property tax history
+1.5%/yrLatest (2026): $1,063 · +0.5% YoY. Source: county tax records.
Cash-flow waterfall
monthlySold comps — $/sqft
last 12 mo · ≤1 miLoading sold comps…