 Fourplex
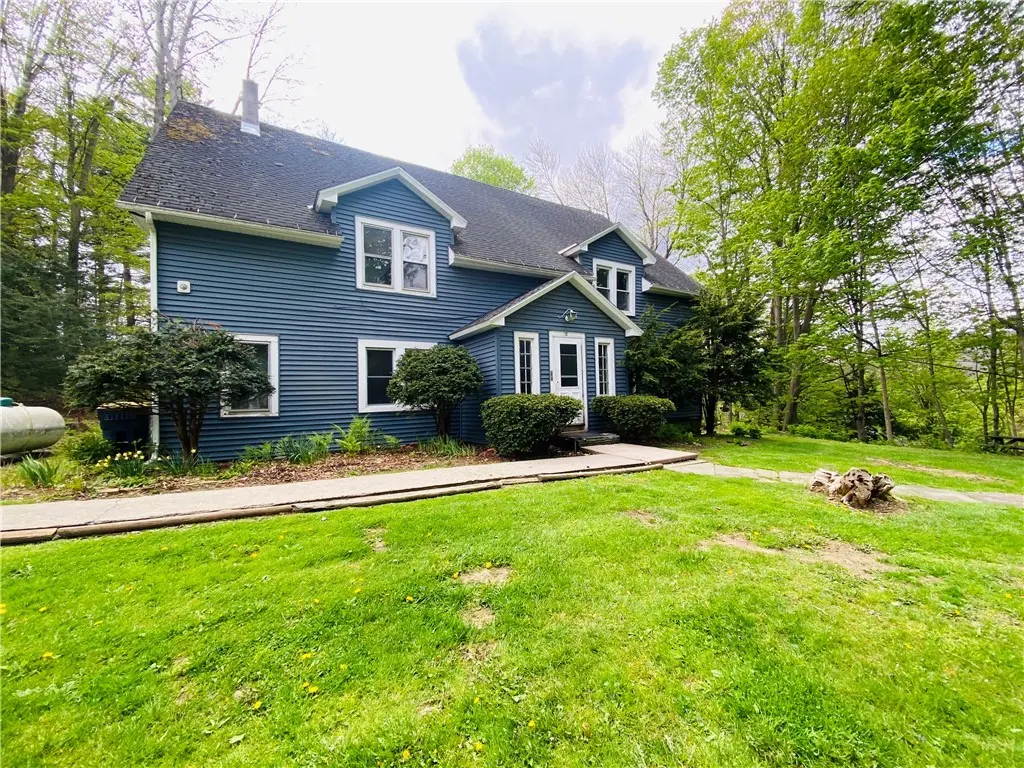
18 E Main St · Sidney, NY
Flood risk 1/10 · Minimal
- FEMA flood zone
- X (unshaded)
- Chance of flooding over 30 yrs
- 0.0%
- Est. flood insurance / yr
- $507 – $1,088
Fire risk 1/10 · Minimal
- Est. fire insurance / yr
- $691 – $1,283
Heat risk 3/10 · Minor
- Hot days now (above 90°F)
- 7 days/yr
- Hot days in 30 yrs
- 17 days/yr
Wind risk 2/10 · Minimal
- Chance of severe wind over 30 yrs
- 1.0%
Air-quality risk 2/10 · Minimal
- Unhealthy air days now
- 0 days/yr
- Unhealthy air days in 30 yrs
- 1 days/yr
Risk factors via First Street. Map © Google.
Why this score? — see what drove the B+ grade
The composite is a weighted blend of 9 inputs, each scored 0–100. Each bar is that input's sub-score; the figure is the points it added to the 100-point composite (weight × sub-score).
- Cash flow +30.0/30.0
- 1% rule +10.0/10.0
- DSCR +10.0/10.0
- ARV discount +7.5/15.0
- Appreciation +6.3/10.0
- Schools +3.8/10.0
- Livability +3.5/5.0
- Rent growth +2.5/5.0
- Condition / age +2.5/5.0
$149,000
🖨 Deal sheet 📄 Offer letter ✓ Due diligence
Multi-family units
County records classify this as Multi-Family (5+ Unit). Listing-text estimate: 4 units. estimate disagrees with records
5+ unit building — per-unit beds/baths from public records are typically unavailable; the breakdown below (if shown) is an estimate from the listing text.
Listing remarks
Investors! This 4 Unit Multi Family could be a great income producing property. Each unit has Two bedrooms, one bath. Three apartments are vacant and one two bedroom is rented Month to Month. Hardwood floors, newer windows, siding and furnace. One apartment will need remodeling. Large piece of property, 0.75 ACRE with nice views and a back deck. There is a Four car garage that is a Tear Down or rehab. Plenty of room to put up a new garage or have extra parking. Private, peaceful, park like setting. Located close to schools, shopping, municipal swimming pool, ball fields and short walk to downtown Sidney. Sold As-Is. Don't miss this chance to have a 4 unit and have a good investment propert
Key facts
- Multi family
- Newer windows
- Siding
Tags
Property features AI
Finance
- Financial info: Owner pays heat and water; Operating expenses include insurance and water/sewer; One unit currently on month-to-month lease (rent listed at $860)
Exterior
- Parking: Two or more off-street parking spaces
- Utilities: Public water connected; Sewer connected
- Home design: 2-story multi-family building; Frame construction; Resale property
- Construction: Frame construction
- Exterior features: Irregular residential lot; City street frontage
Interior
- Kitchen: Each unit includes an oven/range and refrigerator; Dining area open to living room in each unit
- Bedrooms: Four 2-bedroom units
- Flooring: Combination of carpet and hardwood
- Bathrooms: Four full bathrooms (one per unit)
- Heating & cooling: Propane heating; Baseboard heating; Hot water heating
- Interior features: Full basement
- Laundry & utility: Propane water heater
Neighborhood map
What this means for you Summary
Snapshot
- This is a 4 × 2-bed/1.0-bath units multifamily listed at $149k.
Deal economics
- At list price, monthly cash flow is $2k ($28k/yr) — positive. Per door: $575/mo.
- The deal already cash-flows at list — no discount required.
- Meets the 1% rule at list price ($4k rent vs $149k).
- Cap rate 24.8% vs local median 5.9% in Sidney — top-decile yield for the area; either an underpriced asset or a hidden risk that comps aren't pricing in. Stress-test before assuming the spread holds.
Location & tenants
- Location reads 69/100 on livability (#476 in NY) — a middle-class / working-renter tenant base. Strengths: cost of living A+, health & safety A+, housing A; Watch: schools D+, employment D, amenities F.
- Sidney Central School District (town): math 44% / reading 47% proficiency, ranked #462 of 590 in NY (top 78%) — families likely to look elsewhere, expect single-tenant / working-renter base with shorter leases.
- Market conditions: 32 active listings in the ZIP; 66 units permitted in Delaware County in 2024 (0 in 5+ unit buildings).
Forward outlook
- In year one you build about $5k of equity ($1k loan paydown + $4k appreciation (2.6% local appreciation)).
- Delaware County population projected at -27% by 2050 — secular population decline; favor cash flow + early exit over multi-decade hold.
- At projected returns (2.6% appreciation + 3.0% rent growth), your $42k cash investment doubles in ~2 years — after that, you're playing with house money.
- By year 7, paydown + projected appreciation supports a ~$31k cash-out refi (75% LTV) — recoverable capital for the next deal without selling this one.
Negotiation context
- Only 13 days on market — expect competitive offers; lowballing is unlikely to land.
- Current owner paid $81k; list at $149k implies a 84% gain — meaningful room to come down on a strong offer.
Risks & watch-outs
- Watch-outs: property tax is 3.1% of price; built in 1940 — expect roof / HVAC / electrical / plumbing capex.
Questions for the listing agent
- Can we see the unit-by-unit rent roll, current vacancy, and any below-market leases? What's the average tenancy length?
- What capital expenditures (roof, boiler, parking lot, exteriors) have been made in the last 5 years, and what's planned in the next 2?
- Built in 1940 — when were the roof, HVAC, electrical panel, plumbing, and water heater last replaced?
- Property tax is high relative to price — has the assessment been appealed recently, and will the sale trigger a re-assessment?
- Is there a deadline driving the sale (1031 exchange, divorce, estate, relocation)? That informs how much negotiation room exists.
- Schools are D-rated, which usually means shorter tenancies and higher turnover. Who's the typical renter profile here, and what's been the actual vacancy rate?
- What's the average days-on-market for RENTAL listings here right now (not sales)? A rising rental-DOM trend means longer vacancies and softer asking-rent achievability than the comps imply.
- What's the recent tenant-quality profile in this submarket — average credit score on applications, eviction rate, late-payment / NSF rate, and stable-employment percentage? A property-management company in the area should have these aggregated.
- How much new apartment / multifamily construction is in the pipeline within 1–3 miles? Heavy new supply (>2% of stock underway) typically softens rents 12–24 months out; light construction supports rent growth.
Investment metrics
- 1% rule
- 3.00% ✓
- Cap rate
- 24.82%
- Cash-on-cash
- 66.16%
- DSCR
- 3.94
- GRM
- 2.8
CMA / ARV
No comps found within radius.
Projected returns pro-forma
2.6% appreciation · 3.0% rent growth · sell at horizon
- IRR
- 70.6%
- Equity multiple
- 4.87×
- Total profit
- $161,550
- Equity at exit
- $63,706
- IRR
- 70.4%
- Equity multiple
- 9.96×
- Total profit
- $373,976
- Equity at exit
- $95,693
Cash invested: $41,720 (down + closing). Projections, not guarantees.
Landlord ↔ Tenant lean methodology
- Overall (STATE)
- 15 Strongly Tenant-Friendly
- State New York
- 15 Strongly Tenant-Friendly · D+10
- County
- — inherits STATE
- City
- — inherits STATE
ZIP-level market 13838
- Home prices YoY
- 0.8%
- Active inventory
- 32
- Price-to-rent
- 11.1×
Monthly cashflow live
- Estimated rent
- $4,468 medium interval (Pro) →
- Mortgage (P&I)
- −$781
- Tax from tax record
- −$386 /mo · $4,632/yr
- Insurance
- −$62
- HOA
- −$0
- Vacancy / Maint / Mgmt
- −$938
- Net cashflow
- $2,300
Break-even live
4-unit breakdown (identical units grouped — click to expand)
| Units | Beds | Baths | Est. rent |
|---|---|---|---|
| 4× units | 2 | 1 | $4,468 |
| #1 | 2 | 1 | $1,117 |
| #2 | 2 | 1 | $1,117 |
| #3 | 2 | 1 | $1,117 |
| #4 | 2 | 1 | $1,117 |
| Total (4 units) | $4,468 | ||
UW: 25.0% down · 7.5% · 30yr · 1.5% tax · 5.0% vac · 8.0% maint · 8.0% mgmt
Financing live
Cash to close
- Down payment
- $37,250
- Closing costs
- $4,470
- Reserves months
- —
- Total cash needed
- —
Loan-product check · same deal, 3 products live
Conventional
25% down · 7.5% · 30yr
- Down + closing
- —
- Monthly P&I
- —
- Monthly cashflow
- —
- DSCR
- —
- Eligible?
- —
Personal DTI + credit; lowest rate.
DSCR
20% down · 8.5% · 30yr
- Down + closing
- —
- Monthly P&I
- —
- Monthly cashflow
- —
- DSCR
- —
- Eligible?
- —
No personal income docs; deal must DSCR.
Hard money
10% down · 12.0% · 12mo
- Down + closing
- —
- Monthly P&I
- —
- Monthly cashflow
- —
- DSCR
- —
- Eligible?
- —
Short-term bridge; refi at stabilization.
Listing history 10 events
-
2026-06-15statusdays on market $149,000 Pending 13 DOM
-
2026-06-13days on market $149,000 Active 12 DOM
-
2026-06-12days on market $149,000 Active 11 DOM
-
2026-06-09days on market $149,000 Active 8 DOM
-
2026-06-08days on market $149,000 Active 7 DOM
-
2026-06-07days on market $149,000 Active 6 DOM
-
2026-06-07days on market $149,000 Active 5 DOM
-
2026-06-04days on market $149,000 Active 2 DOM
-
2026-06-01remarks 699-char remark
-
2026-06-01$149,000 Active 1 DOM
ⓘ Source: listings_history table (triggers on properties + properties_extension) + one-shot
backfill from property_details.listing_events for pre-trigger history.
Tax reassessment forecast NY · Partial reset (capped growth)
- Current annual tax
- $4,632 · $386/mo
- Projected year-2 tax
- $4,632 · $386/mo
- Expected delta
- $0/yr ($0/mo · 0.0%)
ⓘ Screening estimate from a state-policy table — verify with the county assessor before closing.
Climate risk First Street
- Flood 1/10 Low FEMA zone X (unshaded) · 0% chance over 30 yrs
- Wildfire 1/10 Low
- Heat 3/10 Moderate 7 d/yr ≥90°F today · 17 d/yr by 30 yrs out
- Wind 2/10 Low 100% chance of damaging wind over 30 yrs
- Air quality 2/10 Low 0 unhealthy d/yr today · 1 by 30 yrs out
Nearby sold comps map
Loading sold comps map…
Walkable amenities ~0.75 mi
Loading nearby amenities…
Taxation est. · year 1
- Rental income
- $53,616
- − Mortgage interest
- −$8,346
- − Property taxes
- −$4,632
- − Insurance
- −$745
- − Repairs & maintenance
- −$4,289
- − Management
- −$4,289
- − Depreciation
- −$4,335
- Taxable income
- $26,979
- Est. tax owed @ 24.0%
- −$6,475
- After-tax cash flow
- $21,128/yr
For passive investors: Depreciation is non-cash, so a rental often shows a tax loss while cash-flowing — sheltering income. Rental losses are passive: they offset passive income freely, and up to $25,000/yr can offset ordinary (W-2) income if you actively participate and your MAGI is under $100k (phasing out to $0 by $150k); unused losses carry forward. On sale, claimed depreciation is recaptured at up to 25%, and gains may owe capital-gains tax (a 1031 exchange can defer both). Figures are a year-1 estimate at your 24.0% rate — not tax advice; consult a CPA.
Schools (NCES district)
- District
- Sidney Central School District
- NCES district ID
- 3626850
- Math proficiency
- 44% ▼ -2.00%
- Reading proficiency
- 47% ▲ 5.00%
- Median HH income
- $42,110
- Composite
- 38.29/100
- National rank
- #4232
- State rank
- #462 of 590 in NY
Livability — Sidney
- Score
- 69/100
- State rank
- #476
- US rank
- #8397
Category grades
Schools grade is shown separately in the Schools card above.
Census & demographics
- Census place
- Sidney, NY
- Population (ZIP)
- 4,185
Population outlook (Delaware County) Hauer SSP2
- Today (2025)
- 42,668 people
- By 2030
- 40,337 · -5.5%
- By 2040
- 35,514 · -16.8%
- By 2050
- 31,265 · -26.7%
- By 2075
- 24,455 · -42.7%
- By 2100
- 19,529 · -54.2%
Race, ethnicity, and origin ACS 2023
- Neighborhood character
- Predominantly White (86%)
- Race & ethnicity
- White 86% Two or more races 12% Hispanic / Latino 8% Black 2%
- Hispanic origin (detail)
- Common ancestry
- Romanian 10% Iranian 9% Lithuanian 4%
- Foreign-born
- 1%
- Languages at home
- 92% English-only · German/W. Germanic 5% Other Asian/Pacific 2% Spanish 2%
Political lean MEDSL · Delaware
- 2024 margin
- R (+19.8) · D 40.1% · R 59.9%
- 2008→2024 swing
- -14.6pp toward R · 2008: -5.2pp · 2024: -19.8pp
- All cycles
- 2024: R+19.8 2020: R+18.4 2016: R+29.2 2012: R+9.6 2008: R+5.2
Not yet ingested
- Civics
- —
Market trends
- HPI YoY
- ▲ 2.60%
- Current HPI
- 324.4858
- Rent YoY
- —
- Metro
- —
- State GDP YoY
- ▲ 2.60%
- F500 in state
- 92
Industry mix (Fortune 500 HQ in NY)
| Industry | F500 HQs | Revenue |
|---|---|---|
| Financial Services | 10 | $950B |
|
||
| Consumer Goods | 9 | $162B |
|
||
| Insurance | 4 | $225B |
|
||
| Telecommunications | 2 | $144B |
|
||
| Pharmaceuticals | 2 | $112B |
|
||
| Media / Entertainment | 2 | $69B |
|
||
Price history
+84.0% since first listed2 events — show timeline
- 2026-06-01 Listed $149,000 UNYREIS
- 2004-05-20 Sold (Public Records) $81,000 Public Records
Property tax history
+1.6%/yrLatest (2025): $4,632 · +2.0% YoY. Source: county tax records.
Cash-flow waterfall
monthlySold comps — $/sqft
last 12 mo · ≤1 miLoading sold comps…