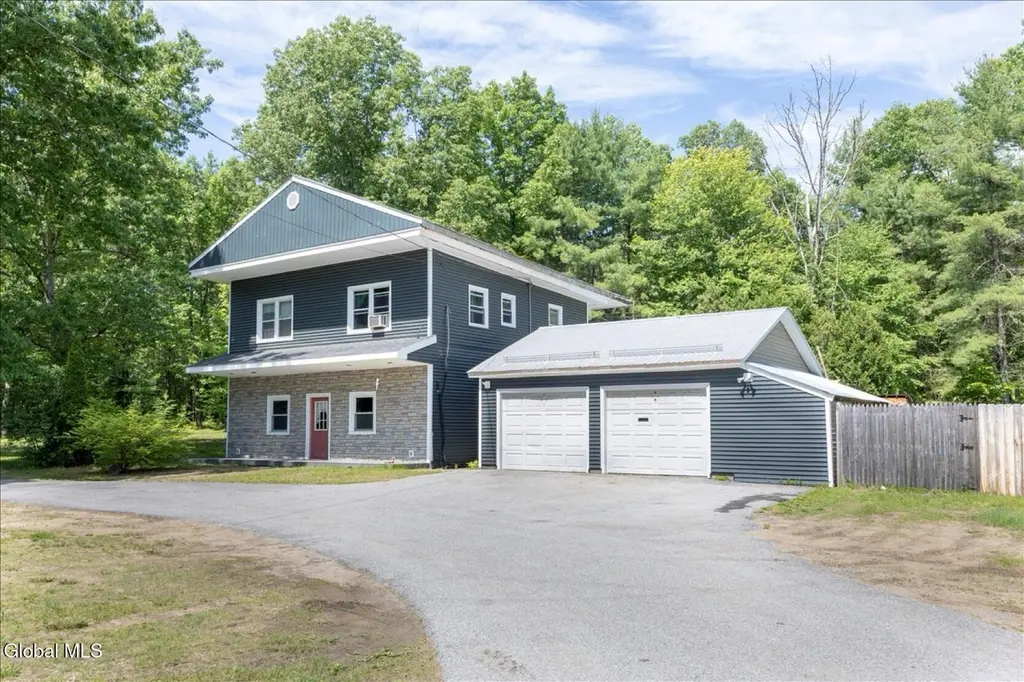
1069 Saratoga Rd · West Glens Falls, NY
Flood risk No data
- FEMA flood zone
- —
- Chance of flooding over 30 yrs
- —
- Est. flood insurance / yr
- —
Fire risk No data
- Est. fire insurance / yr
- —
Heat risk No data
- Hot days now (above threshold)
- —
- Hot days in 30 yrs
- —
Wind risk No data
- Chance of severe wind over 30 yrs
- —
Air-quality risk No data
- Unhealthy air days now
- —
- Unhealthy air days in 30 yrs
- —
Risk factors via First Street. Map © Google.
Why this score? — see what drove the C grade
The composite is a weighted blend of 9 inputs, each scored 0–100. Each bar is that input's sub-score; the figure is the points it added to the 100-point composite (weight × sub-score).
- Cash flow +22.6/30.0
- ARV discount +7.5/15.0
- DSCR +7.3/10.0
- 1% rule +5.9/10.0
- Schools +4.7/10.0
- Condition / age +3.8/5.0
- Livability +3.6/5.0
- Rent growth +2.5/5.0
- Appreciation +0.0/10.0
$264,900
🖨 Deal sheet (PDF) 📄 Offer letter ✓ Due diligence
Listing remarks
Welcome home to this 3-bedroom, 2.5-bath property offering 2,400 square feet of living space on a generous 1.38-acre lot, this home combines comfort, space, and outdoor enjoyment. Step inside to discover spacious living areas designed for everyday living and entertaining. Outside, the backyard is a true retreat--fully fenced and thoughtfully designed for relaxation and fun. Enjoy evenings in the hot tub, entertain guests at the cabana bar, unwind in the charming hobby shed, and take advantage of the many outdoor spaces that make this property stand out. Additional highlights include new vinyl siding, a 2-car garage, and plenty of room to spread out both inside and out. Whether you're hostin
Key facts
- Fully fenced
- Hot tub
- Caban bar
Tags
Property features AI
Exterior
- Parking: Detached garage; Has garage with 2 garage spaces; Total parking for 8 vehicles; Off-street parking and driveway
- Security: Smoke detectors; Carbon monoxide detectors
- Utilities: Circuit breaker electric; Septic tank sewer; Cable available
- Home design: Single family residence; Level lot; private with road frontage
- Construction: Vinyl siding; Metal roof; Slab foundation; Built living area approximately 2,400
- Exterior features: Front porch; Paved driveway; Outdoor bar; Back yard fencing (fenced); Shed(s); Has spa
Interior
- Kitchen: Range; Refrigerator
- Bedrooms: Primary bedroom on second level; Additional bedrooms on second level
- Flooring: Carpet; Other
- Bathrooms: Two full bathrooms on second level; One half bathroom on first level
- Heating & cooling: Baseboard heating; Hot water heating; Propane fuel
- Interior features: Walk-in closets; Insulated windows; Total of 11 rooms
- Laundry & utility: Laundry room on upper (second) level
Neighborhood map
What this means for you Summary
Snapshot
- This is a 3-bed/2.5-bath single-family listed at $265k. Condition is rated good.
Deal economics
- At list price, monthly cash flow is $452 ($5k/yr) — positive.
- The deal already cash-flows at list — no discount required.
- Meets the 1% rule at list price ($3k rent vs $265k).
- Cap rate 8.3% vs local median 2.4% in West Glens Falls — top-decile yield for the area; either an underpriced asset or a hidden risk that comps aren't pricing in. Stress-test before assuming the spread holds.
Location & tenants
- Location reads 71/100 on livability (#388 in NY) — a middle-class / working-renter tenant base. Strengths: employment A+, housing A+, health & safety A+; Watch: crime C-, cost of living C-, amenities F.
- South Glens Falls Central School District (suburban): math 49% / reading 59% proficiency, ranked #307 of 590 in NY (top 52%) — acceptable for families but not a draw, mixed tenant base, ~2y average lease.
- Zoned schools: Ballard Elementary School (math 52% / reading 52%, grade C-, #988 of 2,108 statewide, top 49%, 309 students, 32% FRL); Oliver W Winch Middle School (math 32% / reading 50%, grade F, #402 of 729 statewide, top 56%, 668 students, 37% FRL); South Glens Falls Senior High School (math 92% / reading 91%, grade A+, #197 of 1,100 statewide, top 18%, 908 students, 36% FRL).
- Market conditions: 115 active listings in the ZIP; solid renter incomes; 1,132 units permitted in Saratoga County in 2024 (378 in 5+ unit buildings).
- This rent runs 35% of the median local income ($100k/yr) — at the standard rent-burdened threshold; future hikes will face affordability resistance.
Forward outlook
- Local home prices are declining (-3.0%/yr); year-one equity from $2k of loan paydown is wiped out by about $8k of value loss. Plan a longer hold.
- Saratoga County population projected at +4% by 2050 — modest demand growth; plan on rents tracking national, not racing it.
Negotiation context
- Only 5 days on market — expect competitive offers; lowballing is unlikely to land.
Risks & watch-outs
- Watch-outs: built in 1935 — expect roof / HVAC / electrical / plumbing capex.
Questions for the listing agent
- Built in 1935 — when were the roof, HVAC, electrical panel, plumbing, and water heater last replaced?
- Is there a deadline driving the sale (1031 exchange, divorce, estate, relocation)? That informs how much negotiation room exists.
- Schools are F-rated, which usually means shorter tenancies and higher turnover. Who's the typical renter profile here, and what's been the actual vacancy rate?
- What's the average days-on-market for RENTAL listings here right now (not sales)? A rising rental-DOM trend means longer vacancies and softer asking-rent achievability than the comps imply.
- What's the recent tenant-quality profile in this submarket — average credit score on applications, eviction rate, late-payment / NSF rate, and stable-employment percentage? A property-management company in the area should have these aggregated.
- How much new for-sale + rental construction is in the pipeline within 1–3 miles? Heavy new supply typically softens prices + rents 12–24 months out; constrained supply supports both.
Investment metrics
- 1% rule
- 1.09% ✓
- Cap rate
- 8.34%
- Cash-on-cash
- 7.32%
- DSCR
- 1.33
- GRM
- 7.6
CMA / ARV
- ARV (on-the-fly)
- $794,400
- Comps found
- 7
Show comp detail 7 sales within ~0.75 mi
| Address | Dist | Beds/Ba | Sqft | Sold | Price | $/sf | Match |
|---|---|---|---|---|---|---|---|
| 5 Lookout Cir | 0.15mi | 3/2.5 | 2,169 (-10%) | 10mo | $725,000 | $334 | 69 |
| 7 Lookout Cir | 0.18mi | 4/2.5 (+1) | 2,427 (+1%) | 23mo | $821,000 | $338 | 66 |
| 6 Hidden Pond Way | 0.15mi | 3/2.0 | 2,110 (-12%) | 7mo | $699,000 | $331 | 65 |
| 407 Old Saratoga Rd | 0.06mi | 4/3.0 (+1) | 2,200 (-8%) | 16mo | $585,000 | $266 | 63 |
| 9 Lookout Cir | 0.20mi | 3/2.5 | 2,110 (-12%) | 23mo | $810,000 | $384 | 52 |
| 11 Lookout Cir | 0.20mi | 4/2.0 (+1) | 2,150 (-10%) | 24mo | $708,000 | $329 | 46 |
| 27 Barrington | 0.44mi | 4/2.5 (+1) | 2,694 (+12%) | 20mo | $602,500 | $224 | 38 |
Match score weights: distance 35% · size 25% · config 20% · recency 20%. Top-matched comps best support the ARV.
Projected returns pro-forma
-3.0% appreciation · 3.0% rent growth · sell at horizon
- IRR
- -5.1%
- Equity multiple
- 0.81×
- Total profit
- $-14,083
- Equity at exit
- $39,497
- IRR
- 4.6%
- Equity multiple
- 1.34×
- Total profit
- $24,997
- Equity at exit
- $22,904
Cash invested: $74,172 (down + closing). Projections, not guarantees.
Landlord ↔ Tenant lean methodology
- Overall (STATE)
- 15 Strongly Tenant-Friendly
- State New York
- 15 Strongly Tenant-Friendly · D+10
- County
- — inherits STATE
- City
- — inherits STATE
ZIP-level market 12831
- Home prices YoY
- -12.8%
- Active inventory
- 115
- Price-to-rent
- 7.6×
Monthly cashflow live
- Estimated rent
- $2,890 medium interval (Pro) →
- Mortgage (P&I)
- −$1,389
- Tax est. 1.5%
- −$331 /mo · $3,974/yr
- Insurance
- −$110
- HOA
- −$0
- Vacancy / Maint / Mgmt
- −$607
- Net cashflow
- $452
Break-even live
Sensitivity live
| Price | -10% $635 | -5% $544 | +0% $452 | +5% $361 | +10% $269 |
|---|---|---|---|---|---|
| Rent | -10% $224 | -5% $338 | +0% $452 | +5% $566 | +10% $680 |
| Rate | -1.0pp $586 | -0.5pp $520 | base $452 | +0.5pp $384 | +1.0pp $314 |
UW: 25.0% down · 7.5% · 30yr · 1.5% tax · 5.0% vac · 8.0% maint · 8.0% mgmt
Financing live
Cash to close
- Down payment
- $66,225
- Closing costs
- $7,947
- Reserves months
- —
- Total cash needed
- —
Loan-product check · same deal, 3 products live
Conventional
25% down · 7.5% · 30yr
- Down + closing
- —
- Monthly P&I
- —
- Monthly cashflow
- —
- DSCR
- —
- Eligible?
- —
Personal DTI + credit; lowest rate.
DSCR
20% down · 8.5% · 30yr
- Down + closing
- —
- Monthly P&I
- —
- Monthly cashflow
- —
- DSCR
- —
- Eligible?
- —
No personal income docs; deal must DSCR.
Hard money
10% down · 12.0% · 12mo
- Down + closing
- —
- Monthly P&I
- —
- Monthly cashflow
- —
- DSCR
- —
- Eligible?
- —
Short-term bridge; refi at stabilization.
Listing history 4 events
-
2026-06-16statusdays on market $264,900 Pending 5 DOM
-
2026-06-15days on market $264,900 Active 4 DOM
-
2026-06-14remarks 699-char remark
-
2026-06-14$264,900 Active 2 DOM
ⓘ Source: listings_history table (triggers on properties + properties_extension) + one-shot
backfill from property_details.listing_events for pre-trigger history.
Nearby sold comps map
Loading sold comps map…
Walkable amenities ~0.75 mi
Loading nearby amenities…
Taxation est. · year 1
- Rental income
- $34,676
- − Mortgage interest
- −$14,839
- − Property taxes
- −$3,974
- − Insurance
- −$1,324
- − Repairs & maintenance
- −$2,774
- − Management
- −$2,774
- − Depreciation
- −$7,706
- Taxable income
- $1,285
- Est. tax owed @ 24.0%
- −$308
- After-tax cash flow
- $5,118/yr
For passive investors: Depreciation is non-cash, so a rental often shows a tax loss while cash-flowing — sheltering income. Rental losses are passive: they offset passive income freely, and up to $25,000/yr can offset ordinary (W-2) income if you actively participate and your MAGI is under $100k (phasing out to $0 by $150k); unused losses carry forward. On sale, claimed depreciation is recaptured at up to 25%, and gains may owe capital-gains tax (a 1031 exchange can defer both). Figures are a year-1 estimate at your 24.0% rate — not tax advice; consult a CPA.
Condition & rehab AI · 13 photos
This home is in good condition with a fresh exterior and well-maintained interior. It offers a good balance of comfort and outdoor enjoyment, making it a solid investment.
Value-add opportunities
- Resale Paint the exterior — Fresh paint can enhance curb appeal and property value.
- Both Landscaping improvements — Enhanced landscaping can improve both resale and rental value.
Renovation cost estimate screening
Value-add ROI direction
- Resale Paint the exterior — Fresh paint can enhance curb appeal and property value. ↑
- Both Landscaping improvements — Enhanced landscaping can improve both resale and rental value. ↑
ⓘ Cost ranges are severity-bucket heuristics (US national rule-of-thumb). Get contractor quotes + a written scope before underwriting a rehab budget.
Schools (NCES district)
- District
- South Glens Falls Central School District
- NCES district ID
- 3627240
- Math proficiency
- 49% ▼ -9.00%
- Reading proficiency
- 59% ▲ 12.00%
- Median HH income
- $59,015
- Composite
- 46.93/100
- National rank
- #2363
- State rank
- #307 of 590 in NY
Livability — West Glens Falls
- Score
- 71/100
- State rank
- #388
- US rank
- #6663
Category grades
Schools grade is shown separately in the Schools card above.
Census & demographics
- County
- Saratoga County · 166,192 people
- Metro
- Albany-Schenectady-Troy, NY
- Population (ZIP)
- 18,025
- Household income
- $100,024
- Rent vs Own
- Severe rent burden
- 497.0
Population outlook (Saratoga County) Hauer SSP2
- Today (2025)
- 238,889 people
- By 2030
- 243,681 · +2.0%
- By 2040
- 249,118 · +4.3%
- By 2050
- 248,638 · +4.1%
- By 2075
- 241,675 · +1.2%
- By 2100
- 213,150 · -10.8%
Race, ethnicity, and origin ACS 2023
- Neighborhood character
- Predominantly White (92%)
- Race & ethnicity
- White 92% Hispanic / Latino 3% Two or more races 3% Asian 1%
- Common ancestry
- Lithuanian 11% Romanian 4% Iranian 2%
- Foreign-born
- 3% · Canada
- Languages at home
- 95% English-only · Spanish 2% Russian/Polish/Slavic 1% Other Indo-European 1%
Political lean MEDSL · Saratoga
- 2024 margin
- Toss-up / Even · D 50.9% · R 49.1%
- 2008→2024 swing
- -1.6pp toward R · 2008: 3.4pp · 2024: 1.8pp
- All cycles
- 2024: D+1.8 2020: D+5.4 2016: R+4.4 2012: D+2.1 2008: D+3.4
Not yet ingested
- Civics
- —
Market trends
- HPI YoY
- ▼ -51.79%
- Current HPI
- 351.6972
- Rent YoY
- —
- Metro
- Albany-Schenectady-Troy, NY
- State GDP YoY
- ▲ 2.60%
- F500 in state
- 92
Industry mix (Fortune 500 HQ in NY)
| Industry | F500 HQs | Revenue |
|---|---|---|
| Financial Services | 10 | $950B |
|
||
| Consumer Goods | 9 | $162B |
|
||
| Insurance | 4 | $225B |
|
||
| Telecommunications | 2 | $144B |
|
||
| Pharmaceuticals | 2 | $112B |
|
||
| Media / Entertainment | 2 | $69B |
|
||
Price history
1 event — show timeline
- 2026-06-09 Listed $264,900 Global MLS
Cash-flow waterfall
monthlySold comps — $/sqft
last 12 mo · ≤1 miLoading sold comps…