11621 Wild Horse Trl SE · Albuquerque, NM
Flood risk 1/10 · Minimal
- FEMA flood zone
- X (unshaded)
- Chance of flooding over 30 yrs
- 0.0%
- Est. flood insurance / yr
- $507 – $1,088
Fire risk 4/10 · Minor
- Est. fire insurance / yr
- $706 – $1,312
Heat risk 4/10 · Minor
- Hot days now (above 94°F)
- 3 days/yr
- Hot days in 30 yrs
- 7 days/yr
Wind risk 1/10 · Minimal
- Chance of severe wind over 30 yrs
- —
Air-quality risk 1/10 · Minimal
- Unhealthy air days now
- 0 days/yr
- Unhealthy air days in 30 yrs
- 0 days/yr
Risk factors via First Street. Map © Google.
Why this score? — see what drove the B+ grade
The composite is a weighted blend of 9 inputs, each scored 0–100. Each bar is that input's sub-score; the figure is the points it added to the 100-point composite (weight × sub-score).
- Cash flow +30.0/30.0
- ARV discount +15.0/15.0
- 1% rule +10.0/10.0
- DSCR +10.0/10.0
- Schools +5.3/10.0
- Condition / age +4.0/5.0
- Livability +3.6/5.0
- Rent growth +2.0/5.0
- Appreciation +0.0/10.0
$84,900
🖨 Deal sheet (PDF) 📄 Offer letter ✓ Due diligence
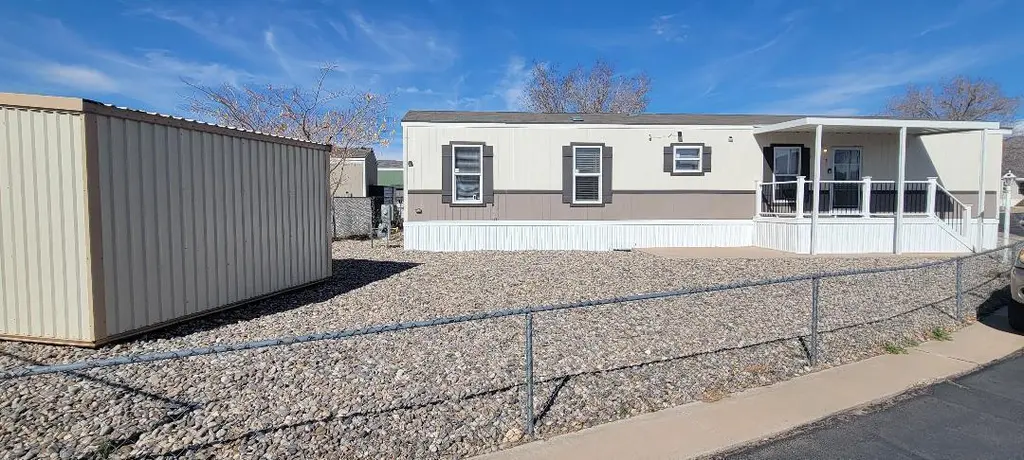
Listing remarks
Super clean and well maintained 3 bed 2 bath home on a corner lot in the quiet neighborhood of Four Hills Mobile Home Park. Wood laminate flooring, stainless steel appliances. Amenities include 3 pools, 4 playgrounds, community center, clubhouse, tennis and basketball courts. IPS security patrol. Potential BUYERS MUST APPLY AND BE APPROVED with village management prior to purchase. Lot rent is $645/monthly. Home is not on permanent foundation, it is considered chattel. Cash or special financing is required, contact listing broker. Lot rent subject to change per village management
Key facts
- 4 playgrounds
- Quiet neighborhood
- 3 pools
Tags
Neighborhood map
What this means for you Summary
Snapshot
- This is a 3-bed/2.0-bath manufactured listed at $85k. Condition is rated good.
Deal economics
- At list price, monthly cash flow is $498 ($6k/yr) — positive.
- The deal already cash-flows at list — no discount required.
- Meets the 1% rule at list price ($1k rent vs $85k).
- Cap rate 13.3% vs local median 3.7% in Albuquerque — top-decile yield for the area; either an underpriced asset or a hidden risk that comps aren't pricing in. Stress-test before assuming the spread holds.
Location & tenants
- Location reads 72/100 on livability (#13 in NM) — a middle-class / working-renter tenant base. Strengths: amenities A+, commute A+, cost of living A+; Watch: schools D-, crime F.
- Albuquerque Public Schools (urban): math 51% / reading 75% proficiency, ranked #3 of 29 in NM (top 10%) — acceptable for families but not a draw, mixed tenant base, ~2y average lease; 60% free/reduced lunch — lower-income household profile, screen leases tightly.
- Market conditions: Rents soft (-2.1%/yr); 202 active listings in the ZIP; 14 comparable units currently listed for rent nearby; rentals at typical pace (median 22d on market — plan ~3-4 weeks tenant-placement turnaround); 1,316 units permitted in Bernalillo County in 2024 (546 in 5+ unit buildings).
Forward outlook
- Local home prices are declining (-3.0%/yr); year-one equity from $587 of loan paydown is wiped out by about $3k of value loss. Plan a longer hold.
- At projected returns (-3.0% appreciation + 0.0% rent growth), your $24k cash investment doubles in ~6 years — after that, you're playing with house money.
Negotiation context
- Only 12 days on market — expect competitive offers; lowballing is unlikely to land.
Questions for the listing agent
- Is there a deadline driving the sale (1031 exchange, divorce, estate, relocation)? That informs how much negotiation room exists.
- Schools are D-rated, which usually means shorter tenancies and higher turnover. Who's the typical renter profile here, and what's been the actual vacancy rate?
- Crime grade is F in this area — have there been break-ins, vandalism, or insurance claims at this property in the last 3 years? What carrier currently insures it and at what premium?
- What's the average days-on-market for RENTAL listings here right now (not sales)? A rising rental-DOM trend means longer vacancies and softer asking-rent achievability than the comps imply.
- What's the recent tenant-quality profile in this submarket — average credit score on applications, eviction rate, late-payment / NSF rate, and stable-employment percentage? A property-management company in the area should have these aggregated.
- How much new for-sale + rental construction is in the pipeline within 1–3 miles? Heavy new supply typically softens prices + rents 12–24 months out; constrained supply supports both.
Investment metrics
- 1% rule
- 1.62% ✓
- Cap rate
- 13.34%
- Cash-on-cash
- 25.16%
- DSCR
- 2.12
- GRM
- 5.2
CMA / ARV
- ARV (median comp)
- $113,614
- List price
- $84,900
- Delta
- -25.19%
- Verdict
- UNDERPRICED
- Comps
- 3 within 1.0 mi
Projected returns pro-forma
-3.0% appreciation · 0.0% rent growth · sell at horizon
- IRR
- 15.2%
- Equity multiple
- 1.59×
- Total profit
- $13,978
- Equity at exit
- $12,659
- IRR
- 21.6%
- Equity multiple
- 2.58×
- Total profit
- $37,570
- Equity at exit
- $7,341
Cash invested: $23,772 (down + closing). Projections, not guarantees.
Landlord ↔ Tenant lean methodology
- Overall (STATE)
- 55 Moderately Landlord-Leaning
- State New Mexico
- 55 Moderately Landlord-Leaning · D+3
- County
- — inherits STATE
- City
- — inherits STATE
ZIP-level market 87123
- Rents YoY
- -2.1%
- Active inventory
- 202
- Price-to-rent
- 5.2×
Monthly cashflow live
- Estimated rent
- $1,374 high interval (Pro) →
- Mortgage (P&I)
- −$445
- Tax est. 1.5%
- −$106 /mo · $1,274/yr
- Insurance
- −$35
- HOA
- −$0
- Vacancy / Maint / Mgmt
- −$288
- Net cashflow
- $498
Break-even live
Sensitivity live
| Price | -10% $557 | -5% $528 | +0% $498 | +5% $469 | +10% $440 |
|---|---|---|---|---|---|
| Rent | -10% $390 | -5% $444 | +0% $498 | +5% $553 | +10% $607 |
| Rate | -1.0pp $541 | -0.5pp $520 | base $498 | +0.5pp $476 | +1.0pp $454 |
UW: 25.0% down · 7.5% · 30yr · 1.5% tax · 5.0% vac · 8.0% maint · 8.0% mgmt
Financing live
Cash to close
- Down payment
- $21,225
- Closing costs
- $2,547
- Reserves months
- —
- Total cash needed
- —
Loan-product check · same deal, 3 products live
Conventional
25% down · 7.5% · 30yr
- Down + closing
- —
- Monthly P&I
- —
- Monthly cashflow
- —
- DSCR
- —
- Eligible?
- —
Personal DTI + credit; lowest rate.
DSCR
20% down · 8.5% · 30yr
- Down + closing
- —
- Monthly P&I
- —
- Monthly cashflow
- —
- DSCR
- —
- Eligible?
- —
No personal income docs; deal must DSCR.
Hard money
10% down · 12.0% · 12mo
- Down + closing
- —
- Monthly P&I
- —
- Monthly cashflow
- —
- DSCR
- —
- Eligible?
- —
Short-term bridge; refi at stabilization.
Rent comps 14 comps
| Address | Beds | Baths | Sqft | Rent | $/sqft | DOM | Units | Dist |
|---|---|---|---|---|---|---|---|---|
| 701 Stephen Moody St SE Albuquerque, NM | 1.0–2.0 | 1.0–2.0 | 814 | $1,715 | $2.11 | 4d | 10 | 0.84mi |
| 301 Western Skies Dr SE Albuquerque, NM | 1.0–3.0 | 1.0–2.0 | 806 | $1,511 | $1.87 | 4d | 17 | 0.96mi |
| 408 Rainbow Ct SE Albuquerque, NM | 2.0 | 1.0 | 950 | $1,200 | $1.26 | 24d | 1 | 0.99mi |
| 12736 Singing Arrow Ave SE Unit C Albuquerque, NM | 2.0 | 1.0 | 800 | $950 | $1.19 | 24d | 1 | 1.00mi |
| 221 Hanosh Ct SE Albuquerque, NM | 2.0 | 1.0 | 700 | $800 | $1.14 | 44d | 1 | 1.01mi |
| 521 Nathan St SE Albuquerque, NM | 3.0 | 2.0 | 1060 | $1,895 | $1.79 | 20d | 1 | 1.01mi |
| 225 Hanosh Ct SE Apt 3 Albuquerque, NM | 2.0 | 1.0 | 650 | $1,200 | $1.85 | 4d | 1 | 1.02mi |
| 405 Dorado Ct SE Unit D Albuquerque, NM | 2.0 | 1.0 | 800 | $900 | $1.12 | 44d | 1 | 1.02mi |
| 405 Dorado Ct SE Albuquerque, NM | 2.0 | 1.0 | 800 | $1,000 | $1.25 | 45d | 1 | 1.02mi |
| 309 Whispering Sands Ct SE Unit 3 Albuquerque, NM | 2.0 | 1.0 | 825 | $1,200 | $1.45 | 24d | 1 | 1.02mi |
| 200 Figueroa St NE Albuquerque, NM | 1.0–2.0 | 1.0 | 734 | $1,207 | $1.64 | 4d | 10 | 1.25mi |
| 13150 Wenonah Ave SE Albuquerque, NM | 1.0–2.0 | 1.0–2.0 | 789 | $1,633 | $2.07 | 4d | 16 | 1.30mi |
| 12021 Skyline Rd NE Albuquerque, NM | 1.0–3.0 | 1.0–2.0 | 875 | $1,592 | $1.82 | 4d | 17 | 1.31mi |
| 517 Ida Pl NE Albuquerque, NM | 3.0 | 1.5 | 1058 | $2,000 | $1.89 | 22d | 1 | 1.44mi |
Listing history 4 events
-
2026-06-03days on market $84,900 Active 12 DOM
-
2026-06-02days on market $84,900 Active 11 DOM
-
2026-06-01days on market $84,900 Active 10 DOM
-
2026-05-31days on market $84,900 Active 9 DOM
ⓘ Source: listings_history table (triggers on properties + properties_extension) + one-shot
backfill from property_details.listing_events for pre-trigger history.
Climate risk First Street
- Flood 1/10 Low FEMA zone X (unshaded) · 0% chance over 30 yrs
- Wildfire 4/10 Moderate
- Heat 4/10 Moderate 3 d/yr ≥94°F today · 7 d/yr by 30 yrs out
- Wind 1/10 Low
- Air quality 1/10 Low 0 unhealthy d/yr today · 0 by 30 yrs out
Nearby sold comps map
Loading sold comps map…
Walkable amenities ~0.75 mi
Loading nearby amenities…
Taxation est. · year 1
- Rental income
- $16,482
- − Mortgage interest
- −$4,756
- − Property taxes
- −$1,274
- − Insurance
- −$424
- − Repairs & maintenance
- −$1,319
- − Management
- −$1,319
- − Depreciation
- −$2,470
- Taxable income
- $4,921
- Est. tax owed @ 24.0%
- −$1,181
- After-tax cash flow
- $4,799/yr
For passive investors: Depreciation is non-cash, so a rental often shows a tax loss while cash-flowing — sheltering income. Rental losses are passive: they offset passive income freely, and up to $25,000/yr can offset ordinary (W-2) income if you actively participate and your MAGI is under $100k (phasing out to $0 by $150k); unused losses carry forward. On sale, claimed depreciation is recaptured at up to 25%, and gains may owe capital-gains tax (a 1031 exchange can defer both). Figures are a year-1 estimate at your 24.0% rate — not tax advice; consult a CPA.
Condition & rehab AI · 12 photos
This mobile home is in good condition with cosmetic updates needed to enhance its curb appeal and value.
Value-add opportunities
- Both Paint exterior siding — Enhances curb appeal and value
- Both Replace window seals — Improves energy efficiency and appearance
- Both Replace flooring — Freshens the interior and adds value
Renovation cost estimate screening
Value-add ROI direction
- Both Paint exterior siding — Enhances curb appeal and value ↑
- Both Replace window seals — Improves energy efficiency and appearance ↑
- Both Replace flooring — Freshens the interior and adds value ↑
ⓘ Cost ranges are severity-bucket heuristics (US national rule-of-thumb). Get contractor quotes + a written scope before underwriting a rehab budget.
Schools (NCES district)
- District
- Albuquerque Public Schools
- NCES district ID
- 3500060
- Math proficiency
- 51% ▲ 30.00%
- Reading proficiency
- 75% ▲ 45.00%
- Median HH income
- $48,151
- Composite
- 53.29/100
- National rank
- #1487
- State rank
- #3 of 29 in NM
Livability — Albuquerque
- Score
- 72/100
- State rank
- #13
- US rank
- #6219
Category grades
Schools grade is shown separately in the Schools card above.
Census & demographics
- Census place
- Albuquerque, NM
- County
- Bernalillo County · 647,165 people
- City population
- 647,165
- Metro
- Albuquerque, NM
- Population (ZIP)
- 42,252
- Household income
- $64,359
- Rent vs Own
- Severe rent burden
- 1657.0
Population outlook (Bernalillo County) Hauer SSP2
- Today (2025)
- 704,528 people
- By 2030
- 711,723 · +1.0%
- By 2040
- 714,522 · +1.4%
- By 2050
- 709,274 · +0.7%
- By 2075
- 680,015 · -3.5%
- By 2100
- 619,879 · -12.0%
Race, ethnicity, and origin ACS 2023
- Neighborhood character
- Diverse neighborhood (Simpson 0.64)
- Race & ethnicity
- Hispanic / Latino 44% White 40% Two or more races 18% Native American 6% Asian 5% Black 2%
- Hispanic origin (detail)
- Mexican 28%
- Common ancestry
- Italian 2% Romanian 2% Lithuanian 1%
- Foreign-born
- 12% · Canada, Vietnam
- Languages at home
- 71% English-only · Spanish 22% Vietnamese 2%
Political lean MEDSL · Bernalillo
- 2024 margin
- Strong D (+21.0) · D 59.2% · R 38.2% · Other 2.6%
- 2008→2024 swing
- -0.3pp no change · 2008: 21.4pp · 2024: 21.0pp
- All cycles
- 2024: D+21.0 2020: D+24.4 2016: D+17.8 2012: D+16.2 2008: D+21.4
Not yet ingested
- Civics
- —
Market trends
- HPI YoY
- ▼ -231.76%
- Current HPI
- 233.3553
- Rent YoY
- ▼ -2.10%
- Metro
- Albuquerque, NM
- State GDP YoY
- —
- F500 in state
- 0
Cash-flow waterfall
monthlySold comps — $/sqft
last 12 mo · ≤1 miLoading sold comps…