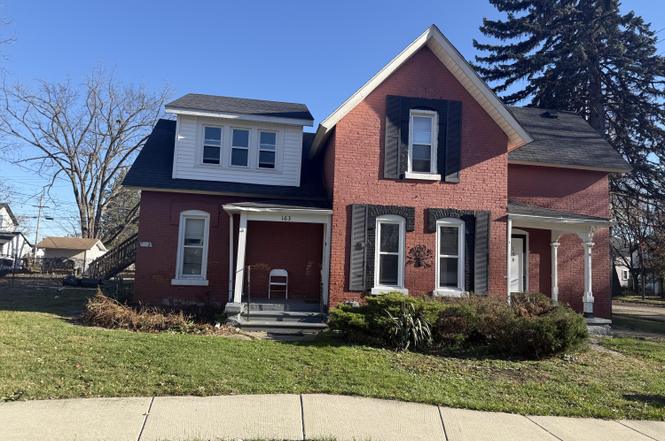
158 Robertson St · Mount Clemens, MI
Flood risk 1/10 · Minimal
- FEMA flood zone
- X (unshaded)
- Chance of flooding over 30 yrs
- 0.0%
- Est. flood insurance / yr
- $473 – $860
Fire risk 1/10 · Minimal
- Est. fire insurance / yr
- $784 – $1,456
Heat risk 3/10 · Minor
- Hot days now (above 96°F)
- 7 days/yr
- Hot days in 30 yrs
- 15 days/yr
Wind risk 1/10 · Minimal
- Chance of severe wind over 30 yrs
- —
Air-quality risk 4/10 · Minor
- Unhealthy air days now
- 4 days/yr
- Unhealthy air days in 30 yrs
- 6 days/yr
Risk factors via First Street. Map © Google.
Why this score? — see what drove the D- grade
The composite is a weighted blend of 9 inputs, each scored 0–100. Each bar is that input's sub-score; the figure is the points it added to the 100-point composite (weight × sub-score).
- Cash flow +9.4/30.0
- ARV discount +7.5/15.0
- 1% rule +5.6/10.0
- Rent growth +5.0/5.0
- Livability +3.9/5.0
- DSCR +2.6/10.0
- Condition / age +2.5/5.0
- Schools +0.6/10.0
- Appreciation +0.0/10.0
$167,000
🖨 Deal sheet 📄 Offer letter ✓ Due diligence
Listing remarks MLS
Turn-Key 3-Unit Multifamily - Updated & Income Producing!This charming brick triplex is a perfect investment opportunity with two tenants on month-to-month leases and one vacant, freshly updated unit ready to rent. Current rents are $850 and $500, with strong potential for increased income. Each unit has been recently updated with new paint, flooring, modern kitchen finishes, and clean, bright living spaces. The vacant unit is move-in ready for an owner-occupant or new tenant. Exterior features include classic brick architecture, covered porches, and a spacious yard on a corner lot. With great visibility, solid rental demand, and turn-key condition, this property is ideal for investors looking for immediate cash flow and future upside. Don't miss this fully updated, ready-to-go multifamily opportunity! Do not disturb tenants!
Key facts
- Spacious yard
- Covered porches
- Turn-key multifamily
Tags
Neighborhood map
What this means for you Summary
Snapshot
- This is a 9-bed/3.0-bath single-family listed at $167k.
Deal economics
- At list price, monthly cash flow is $-120 ($-1k/yr) — negative.
- To cash-flow at today's rent, offer at most $146k (12.7% below list).
- Meets the 1% rule at list price ($2k rent vs $167k).
- Recommended offer: $146k (12.7% below list) — sets the bar for cash-flow.
- Cap rate 5.4% vs local median 3.5% in Mount Clemens — top-decile yield for the area; either an underpriced asset or a hidden risk that comps aren't pricing in. Stress-test before assuming the spread holds.
Location & tenants
- Location reads 77/100 on livability (#120 in MI, #2,918 nationally) — a middle-class / working-renter tenant base. Strengths: commute A+, cost of living A+, housing A+; Watch: schools D+, crime D+, amenities D+.
- Mount Clemens Community School District (suburban): math 4% / reading 11% proficiency, ranked #532 of 540 in MI (top 98%) — low school quality limits family demand, transient renter base, plan for 1-2y turnover; 80% free/reduced lunch — lower-income household profile, screen leases tightly.
- Market conditions: Rents rising fast (+10.8%/yr); 66 active listings in the ZIP; 1,321 units permitted in Macomb County in 2024 (86 in 5+ unit buildings).
- This rent runs 41% of the median local income ($52k/yr) — at the standard rent-burdened threshold; future hikes will face affordability resistance.
Forward outlook
- Local home prices are declining (-3.0%/yr); year-one equity from $1k of loan paydown is wiped out by about $5k of value loss. Plan a longer hold.
- Macomb County population projected at +9% by 2050 — modest demand growth; plan on rents tracking national, not racing it.
Negotiation context
- It's been on market 59 days — a 3% lower offer ($162k) is reasonable based on typical stale-listing flexibility.
- 14 sale attempts since 32y ago with the ask held roughly flat each time — persistent listings suggest the price (not the market) is what's stuck; bring a comps-based counter.
Risks & watch-outs
- Watch-outs: property tax is 4.1% of price; built in 1900 — expect roof / HVAC / electrical / plumbing capex.
Questions for the listing agent
- What do current leases actually rent for vs. the listed asking? Can we see a recent rent roll and the last 12 months of T-12 income?
- It's been on market 59 days. Have you received any prior offers? Is the seller open to a 13% concession, seller financing, or rate buy-down credit?
- Built in 1900 — when were the roof, HVAC, electrical panel, plumbing, and water heater last replaced?
- Property tax is high relative to price — has the assessment been appealed recently, and will the sale trigger a re-assessment?
- Is there a deadline driving the sale (1031 exchange, divorce, estate, relocation)? That informs how much negotiation room exists.
- Schools are D-rated, which usually means shorter tenancies and higher turnover. Who's the typical renter profile here, and what's been the actual vacancy rate?
- Crime grade is D in this area — have there been break-ins, vandalism, or insurance claims at this property in the last 3 years? What carrier currently insures it and at what premium?
- The area grade is low — what's the realistic commute time and amenity access for the typical tenant pool here? Any planned neighborhood developments (good or bad) we should know about?
- What's the average days-on-market for RENTAL listings here right now (not sales)? A rising rental-DOM trend means longer vacancies and softer asking-rent achievability than the comps imply.
- What's the recent tenant-quality profile in this submarket — average credit score on applications, eviction rate, late-payment / NSF rate, and stable-employment percentage? A property-management company in the area should have these aggregated.
- How much new for-sale + rental construction is in the pipeline within 1–3 miles? Heavy new supply typically softens prices + rents 12–24 months out; constrained supply supports both.
Investment metrics
- 1% rule
- 1.06% ✓
- Cap rate
- 5.43%
- Cash-on-cash
- -3.07%
- DSCR
- 0.86
- GRM
- 7.9
CMA / ARV
No comps found within radius.
Projected returns pro-forma
-3.0% appreciation · 8.0% rent growth · sell at horizon
- IRR
- -14.1%
- Equity multiple
- 0.46×
- Total profit
- $-25,116
- Equity at exit
- $24,900
- IRR
- 2.7%
- Equity multiple
- 1.25×
- Total profit
- $11,726
- Equity at exit
- $14,439
Cash invested: $46,760 (down + closing). Projections, not guarantees.
Landlord ↔ Tenant lean methodology
- Overall (STATE)
- 62 Landlord-Friendly
- State Michigan
- 62 Landlord-Friendly · EVEN
- County
- — inherits STATE
- City
- — inherits STATE
ZIP-level market 48043
- Rents YoY
- 10.8%
- Active inventory
- 66
- Price-to-rent
- 7.9×
Monthly cashflow live
- Estimated rent
- $1,763 medium interval (Pro) →
- Mortgage (P&I)
- −$876
- Tax from tax record
- −$567 /mo · $6,804/yr
- Insurance
- −$70
- HOA
- −$0
- Vacancy / Maint / Mgmt
- −$370
- Net cashflow
- $-120
Break-even live
UW: 25.0% down · 7.5% · 30yr · 1.5% tax · 5.0% vac · 8.0% maint · 8.0% mgmt
Financing live
Cash to close
- Down payment
- $41,750
- Closing costs
- $5,010
- Reserves months
- —
- Total cash needed
- —
Loan-product check · same deal, 3 products live
Conventional
25% down · 7.5% · 30yr
- Down + closing
- —
- Monthly P&I
- —
- Monthly cashflow
- —
- DSCR
- —
- Eligible?
- —
Personal DTI + credit; lowest rate.
DSCR
20% down · 8.5% · 30yr
- Down + closing
- —
- Monthly P&I
- —
- Monthly cashflow
- —
- DSCR
- —
- Eligible?
- —
No personal income docs; deal must DSCR.
Hard money
10% down · 12.0% · 12mo
- Down + closing
- —
- Monthly P&I
- —
- Monthly cashflow
- —
- DSCR
- —
- Eligible?
- —
Short-term bridge; refi at stabilization.
Listing history 49 events
-
2026-04-28soldstatus $162,000
-
2026-01-28status Pending 843-char remark
Show marketing remark (843 chars)
Turn-Key 3-Unit Multifamily - Updated & Income Producing!This charming brick triplex is a perfect investment opportunity with two tenants on month-to-month leases and one vacant, freshly updated unit ready to rent. Current rents are $850 and $500, with strong potential for increased income. Each unit has been recently updated with new paint, flooring, modern kitchen finishes, and clean, bright living spaces. The vacant unit is move-in ready for an owner-occupant or new tenant. Exterior features include classic brick architecture, covered porches, and a spacious yard on a corner lot. With great visibility, solid rental demand, and turn-key condition, this property is ideal for investors looking for immediate cash flow and future upside. Don't miss this fully updated, ready-to-go multifamily opportunity! Do not disturb tenants!
-
2026-01-28status Pending
Show marketing remark (843 chars)
Turn-Key 3-Unit Multifamily - Updated & Income Producing!This charming brick triplex is a perfect investment opportunity with two tenants on month-to-month leases and one vacant, freshly updated unit ready to rent. Current rents are $850 and $500, with strong potential for increased income. Each unit has been recently updated with new paint, flooring, modern kitchen finishes, and clean, bright living spaces. The vacant unit is move-in ready for an owner-occupant or new tenant. Exterior features include classic brick architecture, covered porches, and a spacious yard on a corner lot. With great visibility, solid rental demand, and turn-key condition, this property is ideal for investors looking for immediate cash flow and future upside. Don't miss this fully updated, ready-to-go multifamily opportunity! Do not disturb tenants!
-
2025-12-01$167,000 Active
-
2025-11-30$167,000 Active 843-char remark
Show marketing remark (843 chars)
Turn-Key 3-Unit Multifamily - Updated & Income Producing!This charming brick triplex is a perfect investment opportunity with two tenants on month-to-month leases and one vacant, freshly updated unit ready to rent. Current rents are $850 and $500, with strong potential for increased income. Each unit has been recently updated with new paint, flooring, modern kitchen finishes, and clean, bright living spaces. The vacant unit is move-in ready for an owner-occupant or new tenant. Exterior features include classic brick architecture, covered porches, and a spacious yard on a corner lot. With great visibility, solid rental demand, and turn-key condition, this property is ideal for investors looking for immediate cash flow and future upside. Don't miss this fully updated, ready-to-go multifamily opportunity! Do not disturb tenants!
-
2023-08-23historical Accepting Backup Offers
-
2023-08-23historical Accepting Backup Offers
-
2023-08-23historical
-
2023-08-23historical
-
2023-08-12status Active
-
2023-08-12status Active
-
2023-08-08historical Accepting Backup Offers
-
2023-08-08historical Accepting Backup Offers
-
2023-07-29$159,900 Active
-
2023-07-29$159,900 Active
-
2023-07-24historical
-
2023-07-24historical
-
2022-11-17soldstatus $110,000
-
2022-11-15soldstatus $110,000 Sold
-
2022-11-15soldstatus $110,000 Closed
-
2022-10-24status Pending
-
2022-10-24status Pending
-
2022-10-17$124,900 Active
-
2022-10-17$124,900 Active
-
2022-02-23price $825
-
2007-12-14historical
-
2007-10-01$99,900
-
2007-10-01historical
-
2007-06-14$109,900
-
2002-06-21soldstatus $105,000
-
2002-05-29soldstatus $105,000
-
2002-05-10historical
-
2002-02-26$114,900
-
1998-07-20soldstatus $65,000
-
1998-07-20soldstatus $77,000
-
1998-07-20soldstatus $52,500
-
1998-07-20soldstatus $42,000
-
1998-07-20soldstatus $60,000
-
1998-05-12soldstatus $77,000
-
1998-04-23historical
-
1998-02-04$79,900
-
1996-05-03soldstatus $69,000
-
1996-04-15soldstatus $69,000
-
1996-02-29historical
-
1996-02-02$72,900
-
1994-11-11soldstatus $60,000
-
1994-09-01$59,900
-
1993-04-23soldstatus $52,500
-
1991-10-11soldstatus $56,900
ⓘ Source: listings_history table (triggers on properties + properties_extension) + one-shot
backfill from property_details.listing_events for pre-trigger history.
Tax reassessment forecast MI · Partial reset (capped growth)
- Current annual tax
- $6,804 · $567/mo
- Projected year-2 tax
- $6,804 · $567/mo
- Expected delta
- $0/yr ($0/mo · 0.0%)
ⓘ Screening estimate from a state-policy table — verify with the county assessor before closing.
Climate risk First Street
- Flood 1/10 Low FEMA zone X (unshaded) · 0% chance over 30 yrs
- Wildfire 1/10 Low
- Heat 3/10 Moderate 7 d/yr ≥96°F today · 15 d/yr by 30 yrs out
- Wind 1/10 Low
- Air quality 4/10 Moderate 4 unhealthy d/yr today · 6 by 30 yrs out
Nearby sold comps map
Loading sold comps map…
Walkable amenities ~0.75 mi
Loading nearby amenities…
Taxation est. · year 1
- Rental income
- $21,156
- − Mortgage interest
- −$9,355
- − Property taxes
- −$6,804
- − Insurance
- −$835
- − Repairs & maintenance
- −$1,692
- − Management
- −$1,692
- − Depreciation
- −$4,858
- Taxable loss
- −$4,081
- Est. tax savings @ 24.0%
- +$980
- After-tax cash flow
- $-456/yr
For passive investors: Depreciation is non-cash, so a rental often shows a tax loss while cash-flowing — sheltering income. Rental losses are passive: they offset passive income freely, and up to $25,000/yr can offset ordinary (W-2) income if you actively participate and your MAGI is under $100k (phasing out to $0 by $150k); unused losses carry forward. On sale, claimed depreciation is recaptured at up to 25%, and gains may owe capital-gains tax (a 1031 exchange can defer both). Figures are a year-1 estimate at your 24.0% rate — not tax advice; consult a CPA.
Schools (NCES district)
- District
- Mount Clemens Community School District
- NCES district ID
- 2624690
- Math proficiency
- 4% ▼ -9.00%
- Reading proficiency
- 11% ▼ -7.00%
- Median HH income
- $36,632
- Composite
- 6.25/100
- National rank
- #10005
- State rank
- #532 of 540 in MI
Livability — Mount Clemens
- Score
- 77/100
- State rank
- #120
- US rank
- #2918
Category grades
Schools grade is shown separately in the Schools card above.
Census & demographics
- Census place
- Mount Clemens, MI
- County
- Macomb County · 638,552 people
- City population
- 15,429
- Metro
- Detroit-Warren-Dearborn, MI
- Population (ZIP)
- 15,429
- Household income
- $52,161
- Rent vs Own
- Severe rent burden
- 610.0
Population outlook (Macomb County) Hauer SSP2
- Today (2025)
- 925,296 people
- By 2030
- 948,226 · +2.5%
- By 2040
- 983,961 · +6.3%
- By 2050
- 1,010,200 · +9.2%
- By 2075
- 1,076,222 · +16.3%
- By 2100
- 1,077,065 · +16.4%
Race, ethnicity, and origin ACS 2023
- Neighborhood character
- Majority White (65%)
- Race & ethnicity
- White 65% Black 22% Two or more races 10% Hispanic / Latino 4%
- Common ancestry
- Romanian 10% Lithuanian 4% Slovak 2%
- Foreign-born
- 2% · Canada
- Languages at home
- 96% English-only · Spanish 2% Russian/Polish/Slavic 1%
Political lean MEDSL · Macomb
- 2024 margin
- R (+13.7) · D 42.2% · R 55.9% · Other 1.9%
- 2008→2024 swing
- -22.3pp toward R · 2008: 8.6pp · 2024: -13.7pp
- All cycles
- 2024: R+13.7 2020: R+8.1 2016: R+11.6 2012: D+4.0 2008: D+8.6
Not yet ingested
- Civics
- —
Market trends
- HPI YoY
- ▼ -194.74%
- Current HPI
- 260.7139
- Rent YoY
- ▲ 10.82%
- Metro
- Detroit-Warren-Dearborn, MI
- State GDP YoY
- ▲ 1.37%
- F500 in state
- 28
Industry mix (Fortune 500 HQ in MI)
| Industry | F500 HQs | Revenue |
|---|---|---|
| Automotive Parts | 3 | $48B |
|
||
| Automotive | 2 | $372B |
|
||
| Chemicals | 1 | $45B |
|
||
| Automotive Retail | 1 | $29B |
|
||
| Healthcare / Medical Devices | 1 | $23B |
|
||
| Automotive Technology | 1 | $20B |
|
||
Price history
+184.7% since first listed49 events — show timeline
- 2026-04-28 Sold (Public Records) $162,000 Public Records
- 2026-01-28 Pending — MiRealSource-MiMLS
- 2026-01-28 Pending — REALCOMP
- 2025-12-01 Listed $167,000 REALCOMP
- 2025-11-30 Listed $167,000 MiRealSource-MiMLS
- 2023-08-23 Contingent — MiRealSource-MiMLS
- 2023-08-23 Contingent — REALCOMP
- 2023-08-23 Listing Removed — MiRealSource-MiMLS
- 2023-08-23 Listing Removed — REALCOMP
- 2023-08-12 Relisted — MiRealSource-MiMLS
- 2023-08-12 Relisted — REALCOMP
- 2023-08-08 Contingent — MiRealSource-MiMLS
- 2023-08-08 Contingent — REALCOMP
- 2023-07-29 Listed $159,900 MiRealSource-MiMLS
- 2023-07-29 Listed $159,900 REALCOMP
- 2023-07-24 Coming Soon — MiRealSource-MiMLS
- 2023-07-24 Coming Soon — REALCOMP
- 2022-11-17 Sold (Public Records) $110,000 Public Records
- 2022-11-15 Sold (MLS) $110,000 MiRealSource-MiMLS
- 2022-11-15 Sold (MLS) $110,000 REALCOMP
- 2022-10-24 Pending — MiRealSource-MiMLS
- 2022-10-24 Pending — REALCOMP
- 2022-10-17 Listed $124,900 MiRealSource-MiMLS
- 2022-10-17 Listed $124,900 REALCOMP
- 2022-02-23 Price Changed $825 RENT.
- 2007-12-14 Listing Removed — MiRealSource-MiMLS
- 2007-10-01 Listing Removed — MiRealSource-MiMLS
- 2007-10-01 Listed $99,900 MiRealSource-MiMLS
- 2007-06-14 Listed $109,900 MiRealSource-MiMLS
- 2002-06-21 Sold (Public Records) $105,000 Public Records
- 2002-05-29 Sold (MLS) $105,000 MiRealSource-MiMLS
- 2002-05-10 Listing Removed — MiRealSource-MiMLS
- 2002-02-26 Listed $114,900 MiRealSource-MiMLS
- 1998-07-20 Sold (Public Records) $60,000 Public Records
- 1998-07-20 Sold (Public Records) $42,000 Public Records
- 1998-07-20 Sold (Public Records) $52,500 Public Records
- 1998-07-20 Sold (Public Records) $77,000 Public Records
- 1998-07-20 Sold (Public Records) $65,000 Public Records
- 1998-05-12 Sold (MLS) $77,000 MiRealSource-MiMLS
- 1998-04-23 Listing Removed — MiRealSource-MiMLS
- 1998-02-04 Listed $79,900 MiRealSource-MiMLS
- 1996-05-03 Sold (Public Records) $69,000 Public Records
- 1996-04-15 Sold (MLS) $69,000 MiRealSource-MiMLS
- 1996-02-29 Listing Removed — MiRealSource-MiMLS
- 1996-02-02 Listed $72,900 MiRealSource-MiMLS
- 1994-11-11 Sold (MLS) $60,000 MiRealSource-MiMLS
- 1994-09-01 Listed $59,900 MiRealSource-MiMLS
- 1993-04-23 Sold (Public Records) $52,500 Public Records
- 1991-10-11 Sold (Public Records) $56,900 Public Records
Property tax history
+9.2%/yrLatest (2025): $6,804 · -7.2% YoY. Source: county tax records.
Cash-flow waterfall
monthlySold comps — $/sqft
last 12 mo · ≤1 miLoading sold comps…