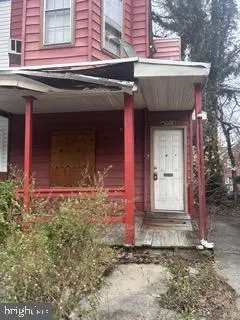
4713 Alhambra Ave · Baltimore, MD
Flood risk 1/10 · Minimal
- FEMA flood zone
- X (unshaded)
- Chance of flooding over 30 yrs
- 0.0%
- Est. flood insurance / yr
- $473 – $860
Fire risk 1/10 · Minimal
- Est. fire insurance / yr
- $755 – $1,403
Heat risk 7/10 · Major
- Hot days now (above 103°F)
- 7 days/yr
- Hot days in 30 yrs
- 15 days/yr
Wind risk 6/10 · Moderate
- Chance of severe wind over 30 yrs
- 27.0%
Air-quality risk 4/10 · Minor
- Unhealthy air days now
- 6 days/yr
- Unhealthy air days in 30 yrs
- 7 days/yr
Risk factors via First Street. Map © Google.
Why this score? — see what drove the B+ grade
The composite is a weighted blend of 9 inputs, each scored 0–100. Each bar is that input's sub-score; the figure is the points it added to the 100-point composite (weight × sub-score).
- Cash flow +30.0/30.0
- ARV discount +15.0/15.0
- 1% rule +10.0/10.0
- DSCR +10.0/10.0
- Livability +3.8/5.0
- Rent growth +3.7/5.0
- Condition / age +2.5/5.0
- Schools +1.0/10.0
- Appreciation +0.0/10.0
$68,000
🖨 Deal sheet 📄 Offer letter ✓ Due diligence
Listing remarks MLS
Investor special in the heart of Baltimore with strong upside potential! This property is a full renovation opportunity, ideal for investors, flippers, or savvy buyers looking to build equity through renovation. Features include a classic layout with multiple bedrooms, covered front porch, and a structure ready for transformation. Property requires a complete rehab and is being sold AS-IS, making it a perfect candidate for cash, hard money, or renovation financing options such as FHA 203(k). With multiple renovated homes and ongoing development in the area, this is your chance to capitalize on the neighborhood’s growth and increasing values. Endless potential for a fix-and-flip, buy-and-hold rental, or customized primary residence. Conveniently located near major commuter routes, shopping, and local amenities. Bring your contractor, your vision, and your best offer—opportunities like this don’t last!
Key facts
- Built 1910
- Listed 72 days
Neighborhood map
What this means for you Summary
Snapshot
- This is a 3-bed/1.0-bath townhouse listed at $68k.
Deal economics
- At list price, monthly cash flow is $853 ($10k/yr) — positive.
- The deal already cash-flows at list — no discount required.
- Meets the 1% rule at list price ($2k rent vs $68k).
- Recommended offer: $64k (6.0% below list) — sets the bar for market timing.
- Cap rate 21.4% vs local median 6.0% in Baltimore — top-decile yield for the area; either an underpriced asset or a hidden risk that comps aren't pricing in. Stress-test before assuming the spread holds.
Location & tenants
- Location reads 76/100 on livability (#90 in MD, #3,396 nationally) — a middle-class / working-renter tenant base. Strengths: amenities A+, commute A+, housing A+; Watch: schools D, crime F.
- Baltimore City Public Schools (urban): math 7% / reading 16% proficiency, ranked #24 of 24 in MD (top 100%) — low school quality limits family demand, transient renter base, plan for 1-2y turnover; 79% free/reduced lunch — lower-income household profile, screen leases tightly.
- Market conditions: Rents rising fast (+4.7%/yr); 133 active listings in the ZIP; 40 comparable units currently listed for rent nearby; rentals at typical pace (median 24d on market — plan ~3-4 weeks tenant-placement turnaround); 45% of comp listings sitting > 30 days — soft ceiling on asking rent; solid renter incomes; 1,273 units permitted in Baltimore city in 2024 (1,104 in 5+ unit buildings).
Forward outlook
- Local home prices are declining (-3.0%/yr); year-one equity from $470 of loan paydown is wiped out by about $2k of value loss. Plan a longer hold.
- Baltimore County population projected to shrink 4% by 2050 — rents likely to lag national; underwrite the cash flow, not the appreciation.
- At projected returns (-3.0% appreciation + 4.7% rent growth), your $19k cash investment doubles in ~3 years — after that, you're playing with house money.
Negotiation context
- It's been on market 72 days — a 6% lower offer ($64k) is reasonable based on typical stale-listing flexibility.
- 5 sale attempts since 9y ago with the ask held roughly flat each time — persistent listings suggest the price (not the market) is what's stuck; bring a comps-based counter.
- Current owner paid $31k; list at $68k implies a 120% gain — meaningful room to come down on a strong offer.
Risks & watch-outs
- Watch-outs: property tax is 2.8% of price; built in 1910 — expect roof / HVAC / electrical / plumbing capex.
- Climate carrying-cost: major wind risk, 27% chance of damaging wind over 30y; extreme-heat days projected 7→15/yr by 2055 (HVAC capex compounding) — expect insurance premiums to compound above CPI over the hold.
Questions for the listing agent
- It's been on market 72 days. Have you received any prior offers? Is the seller open to a 6% concession, seller financing, or rate buy-down credit?
- Built in 1910 — when were the roof, HVAC, electrical panel, plumbing, and water heater last replaced?
- Property tax is high relative to price — has the assessment been appealed recently, and will the sale trigger a re-assessment?
- Why hasn't it sold? Are there any deal-killer items the seller is aware of (foundation, flood, title, zoning, code violations)?
- Is there a deadline driving the sale (1031 exchange, divorce, estate, relocation)? That informs how much negotiation room exists.
- Schools are D-rated, which usually means shorter tenancies and higher turnover. Who's the typical renter profile here, and what's been the actual vacancy rate?
- Crime grade is F in this area — have there been break-ins, vandalism, or insurance claims at this property in the last 3 years? What carrier currently insures it and at what premium?
- What's the average days-on-market for RENTAL listings here right now (not sales)? A rising rental-DOM trend means longer vacancies and softer asking-rent achievability than the comps imply.
- What's the recent tenant-quality profile in this submarket — average credit score on applications, eviction rate, late-payment / NSF rate, and stable-employment percentage? A property-management company in the area should have these aggregated.
- How much new for-sale + rental construction is in the pipeline within 1–3 miles? Heavy new supply typically softens prices + rents 12–24 months out; constrained supply supports both.
Investment metrics
- 1% rule
- 2.60% ✓
- Cap rate
- 21.35%
- Cash-on-cash
- 53.79%
- DSCR
- 3.39
- GRM
- 3.2
CMA / ARV
- ARV (median comp)
- $132,765
- List price
- $68,000
- Delta
- -48.78%
- Verdict
- UNDERPRICED
- Comps
- 20 within 1.0 mi
Show comp detail 12 sales within ~0.75 mi
| Address | Dist | Beds/Ba | Sqft | Sold | Price | $/sf | Match |
|---|---|---|---|---|---|---|---|
| 739 Springfield Ave | 0.29mi | 3/1.0 | 1,160 (+1%) | 2mo | $125,000 | $108 | 83 |
| 800 Radnor Ave | 0.21mi | 3/1.5 | 1,224 (+7%) | 2mo | $99,900 | $82 | 76 |
| 3952 Wilsby Ave | 0.51mi | 3/1.0 | 1,200 (+4%) | 3mo | $82,572 | $69 | 66 |
| 812 Mccabe Ave | 0.52mi | 3/1.0 | 1,080 (-6%) | 1mo | $150,000 | $139 | 65 |
| 827 Belgian Ave | 0.36mi | 3/2.0 | 1,260 (+10%) | 2mo | $130,000 | $103 | 62 |
| 929 E 41st St | 0.44mi | 3/1.0 | 1,260 (+10%) | 3mo | $149,500 | $119 | 61 |
| 608 Chestnut Hill Ave | 0.74mi | 2/1.0 (-1) | 1,156 (+1%) | 1mo | $73,000 | $63 | 59 |
| 1312 E Cold Spring Ln | 0.65mi | 3/1.0 | 1,216 (+6%) | 1mo | $147,000 | $121 | 59 |
| 934 Argonne Dr | 0.49mi | 3/1.0 | 1,260 (+10%) | 3mo | $130,000 | $103 | 59 |
| 712 Chestnut Hill Ave | 0.74mi | 3/1.5 | 1,120 (-2%) | 2mo | $151,580 | $135 | 58 |
| 355 Homeland Southway Unit 2B | 0.59mi | 2/1.5 (-1) | 1,043 (-9%) | 0mo | $205,000 | $197 | 50 |
| 380 Homeland Southway Unit 3A | 0.72mi | 2/2.0 (-1) | 1,066 (-7%) | 3mo | $225,000 | $211 | 43 |
Match score weights: distance 35% · size 25% · config 20% · recency 20%. Top-matched comps best support the ARV.
Projected returns pro-forma
-3.0% appreciation · 4.65% rent growth · sell at horizon
- IRR
- 53.9%
- Equity multiple
- 3.44×
- Total profit
- $46,386
- Equity at exit
- $10,139
- IRR
- 59.7%
- Equity multiple
- 7.48×
- Total profit
- $123,317
- Equity at exit
- $5,879
Cash invested: $19,040 (down + closing). Projections, not guarantees.
Landlord ↔ Tenant lean methodology
- Overall (CITY)
- 12 Strongly Tenant-Friendly
- State Maryland
- 27 Tenant-Leaning · D+14
- County
- — inherits STATE
- City Baltimore
- 12 Strongly Tenant-Friendly · D+58
ZIP-level market 21212
- Rents YoY
- 4.7%
- Active inventory
- 133
- Price-to-rent
- 3.2×
Monthly cashflow live
- Estimated rent
- $1,766 high interval (Pro) →
- Mortgage (P&I)
- −$357
- Tax from tax record
- −$157 /mo · $1,884/yr
- Insurance
- −$28
- HOA
- −$0
- Vacancy / Maint / Mgmt
- −$371
- Net cashflow
- $853
Break-even live
UW: 25.0% down · 7.5% · 30yr · 1.5% tax · 5.0% vac · 8.0% maint · 8.0% mgmt
Financing live
Cash to close
- Down payment
- $17,000
- Closing costs
- $2,040
- Reserves months
- —
- Total cash needed
- —
Loan-product check · same deal, 3 products live
Conventional
25% down · 7.5% · 30yr
- Down + closing
- —
- Monthly P&I
- —
- Monthly cashflow
- —
- DSCR
- —
- Eligible?
- —
Personal DTI + credit; lowest rate.
DSCR
20% down · 8.5% · 30yr
- Down + closing
- —
- Monthly P&I
- —
- Monthly cashflow
- —
- DSCR
- —
- Eligible?
- —
No personal income docs; deal must DSCR.
Hard money
10% down · 12.0% · 12mo
- Down + closing
- —
- Monthly P&I
- —
- Monthly cashflow
- —
- DSCR
- —
- Eligible?
- —
Short-term bridge; refi at stabilization.
Rent comps 40 comps
| Address | Beds | Baths | Sqft | Rent | $/sqft | DOM | Units | Dist |
|---|---|---|---|---|---|---|---|---|
| 531 Willow Ave Unit Na Baltimore, MD | 4.0 | 1.0 | 1300 | $1,800 | $1.38 | 20d | 1 | 0.07mi |
| 4407 Old York Rd Baltimore, MD | 3.0 | 1.5 | 1356 | $1,574 | $1.16 | 20d | 1 | 0.09mi |
| 4407 Old York Rd Baltimore, MD | 3.0 | 1.5 | 1356 | $1,574 | $1.16 | 43d | 1 | 0.09mi |
| 835 E Cold Spring Ln Baltimore, MD | 2.0 | 1.5 | 997 | $1,400 | $1.40 | 23d | 1 | 0.17mi |
| 720 Springfield Ave Baltimore, MD | 3.0 | 1.0 | 1160 | $2,000 | $1.72 | 43d | 1 | 0.26mi |
| 815 Gilrubin Ct Baltimore, MD | 2.0 | 1.0 | 900 | $1,695 | $1.88 | 43d | 1 | 0.30mi |
| 812 Nat Ct Apt 12 Baltimore, MD | 2.0 | 1.0 | 900 | $1,295 | $1.44 | 43d | 1 | 0.32mi |
| 5001 Midwood Ave Apt 2A Baltimore, MD | 2.0 | 1.0 | 750 | $1,265 | $1.69 | 43d | 1 | 0.33mi |
| 543 Chateau Ave Baltimore, MD | 3.0 | 2.0 | 1152 | $1,900 | $1.65 | 4d | 1 | 0.38mi |
| 416 Winston Ave Unit 426-01 Baltimore, MD | 2.0 | 1.0 | 890 | $1,250 | $1.40 | 43d | 1 | 0.44mi |
| 416 Winston Ave Unit 426-08 Baltimore, MD | 2.0 | 1.0 | 790 | $1,050 | $1.33 | 23d | 1 | 0.44mi |
| 956 Argonne Dr Baltimore, MD | 1.0–2.0 | 1.0 | 662 | $1,295 | $1.95 | 4d | 6 | 0.47mi |
| 711 1/2 McCabe Ave Baltimore, MD | 4.0 | 3.0 | 1204 | $2,350 | $1.95 | 4d | 1 | 0.50mi |
| 1260 Rossiter Ave Baltimore, MD | 2.0 | 1.0 | 710 | $1,250 | $1.76 | 1d | 37 | 0.54mi |
| 5200 Ready Ave Baltimore, MD | 3.0 | 1.5 | 1116 | $1,950 | $1.75 | 3d | 1 | 0.56mi |
| 1224 Winston Ave Baltimore, MD | 3.0 | 2.0 | 1248 | $2,100 | $1.68 | 17d | 1 | 0.58mi |
| 1275 Kitmore Rd Unit 1248B-A Baltimore, MD | 2.0 | 1.0 | 812 | $1,360 | $1.67 | 4d | 1 | 0.65mi |
| 1275 Kitmore Rd Unit 1245K-T Baltimore, MD | 3.0 | 1.0 | 935 | $1,895 | $2.03 | 4d | 1 | 0.65mi |
| 1275 Kitmore Rd Unit 1221B-T Baltimore, MD | 2.0 | 1.0 | 811 | $1,560 | $1.92 | 23d | 1 | 0.65mi |
| 1275 Kitmore Rd Unit 1259K-T Baltimore, MD | 2.0 | 1.0 | 811 | $1,535 | $1.89 | 4d | 1 | 0.65mi |
| 1275 Kitmore Rd Unit 1263K-T Baltimore, MD | 2.0 | 1.0 | 811 | $1,485 | $1.83 | 4d | 1 | 0.65mi |
| 1275 Kitmore Rd Unit 1215B-T Baltimore, MD | 2.0 | 1.0 | 811 | $1,435 | $1.77 | 4d | 1 | 0.65mi |
| 1275 Kitmore Rd Unit 1260K-T Baltimore, MD | 2.0 | 1.0 | 811 | $1,410 | $1.74 | 4d | 1 | 0.65mi |
| 1275 Kitmore Rd Unit 1262B-A Baltimore, MD | 2.0 | 1.0 | 923 | $1,320 | $1.43 | 1d | 1 | 0.65mi |
| 1275 Kitmore Rd Unit 1267K-T Baltimore, MD | 2.0 | 1.0 | 827 | $1,585 | $1.92 | 43d | 1 | 0.65mi |
| 1275 Kitmore Rd Baltimore, MD | 2.0 | 1.0 | 827 | $1,525 | $1.84 | 43d | 1 | 0.65mi |
| 1275 Kitmore Rd Unit 1276B-A Baltimore, MD | 2.0 | 1.0 | 812 | $1,360 | $1.67 | 43d | 1 | 0.65mi |
| 5307 York Rd Baltimore, MD | 2.0 | 1.0 | 1120 | $1,200 | $1.07 | 43d | 1 | 0.65mi |
| 3721 Ellerslie Ave Baltimore, MD | 1.0–3.0 | 1.0–2.0 | 894 | $1,603 | $1.79 | 1d | 1 | 0.70mi |
| 1221 Glenwood Ave Baltimore, MD | 3.0 | 2.0 | 1390 | $2,595 | $1.87 | 43d | 1 | 0.71mi |
| 612 Chestnut Hill Ave Unit 1 Baltimore, MD | 2.0 | 1.0 | 900 | $1,999 | $2.22 | 43d | 1 | 0.74mi |
| 1006 Cameron Rd Baltimore, MD | 2.0 | 1.0 | 1032 | $950 | $0.92 | 43d | 1 | 0.88mi |
| 721 E 36th St Unit Na Baltimore, MD | 2.0 | 1.0 | 1156 | $1,650 | $1.43 | 43d | 1 | 0.90mi |
| 1545 E Cold Spring Ln Baltimore, MD | 4.0 | 2.0 | 1240 | $2,000 | $1.61 | 43d | 1 | 0.92mi |
| 3529 Greenmount Ave Baltimore, MD | 3.0 | 2.0 | 1316 | $1,575 | $1.20 | 43d | 1 | 0.93mi |
| 1617 Argonne Dr Baltimore, MD | 4.0 | 2.0 | 1200 | $2,550 | $2.12 | 43d | 1 | 0.94mi |
| 5618 Midwood Ave Unit 1 Baltimore, MD | 2.0 | 1.0 | 800 | $1,250 | $1.56 | 23d | 1 | 0.96mi |
| 3811 Canterbury Rd Baltimore, MD | 2.0 | 1.0–2.0 | 975 | $2,495 | $2.56 | 12d | 5 | 0.96mi |
| 1090 Cameron Rd Baltimore, MD | 2.0 | 1.0 | 832 | $1,675 | $2.01 | 3d | 1 | 0.96mi |
| 5622 Midwood Ave Baltimore, MD | 3.0 | 2.0 | 1452 | $2,300 | $1.58 | 43d | 1 | 0.96mi |
Listing history 28 events
-
2026-06-18days on market $68,000 Active 72 DOM
-
2026-06-17days on market $68,000 Active 71 DOM
-
2026-06-16days on market $68,000 Active 70 DOM
-
2026-06-15days on market $68,000 Active 69 DOM
-
2026-06-13days on market $68,000 Active 67 DOM
-
2026-06-09days on market $68,000 Active 63 DOM
-
2026-06-08days on market $68,000 Active 62 DOM
-
2026-06-07days on market $68,000 Active 61 DOM
-
2026-06-04days on market $68,000 Active 58 DOM
-
2026-06-03days on market $68,000 Active 57 DOM
-
2026-06-02days on market $68,000 Active 56 DOM
-
2026-06-01days on market $68,000 Active 55 DOM
-
2026-05-31days on market $68,000 Active 54 DOM
-
2026-04-07$68,000 Active 931-char remark
Show marketing remark (931 chars)
Investor special in the heart of Baltimore with strong upside potential! This property is a full renovation opportunity, ideal for investors, flippers, or savvy buyers looking to build equity through renovation. Features include a classic layout with multiple bedrooms, covered front porch, and a structure ready for transformation. Property requires a complete rehab and is being sold AS-IS, making it a perfect candidate for cash, hard money, or renovation financing options such as FHA 203(k). With multiple renovated homes and ongoing development in the area, this is your chance to capitalize on the neighborhood’s growth and increasing values. Endless potential for a fix-and-flip, buy-and-hold rental, or customized primary residence. Conveniently located near major commuter routes, shopping, and local amenities. Bring your contractor, your vision, and your best offer—opportunities like this don’t last!
-
2026-03-11historical
-
2026-01-08price $65,000
-
2025-11-18$80,000 Active
-
2017-09-08soldstatus $30,900
-
2017-08-24historical
-
2017-08-22soldstatus $30,900
-
2017-08-22soldstatus $30,900 Sold
-
2017-08-01status Contract
-
2017-06-03price $35,000
-
2017-05-30status Active
-
2017-04-22status Contract
-
2017-04-16$31,000 Active
-
2017-04-16$35,000
-
1981-08-27soldstatus $33,000
ⓘ Source: listings_history table (triggers on properties + properties_extension) + one-shot
backfill from property_details.listing_events for pre-trigger history.
Tax reassessment forecast MD · Partial reset (capped growth)
- Current annual tax
- $1,884 · $157/mo
- Projected year-2 tax
- $1,884 · $157/mo
- Expected delta
- $0/yr ($0/mo · 0.0%)
ⓘ Screening estimate from a state-policy table — verify with the county assessor before closing.
Climate risk First Street
- Flood 1/10 Low FEMA zone X (unshaded) · 0% chance over 30 yrs
- Wildfire 1/10 Low
- Heat 7/10 Severe 7 d/yr ≥103°F today · 15 d/yr by 30 yrs out
- Wind 6/10 Major 27% chance of damaging wind over 30 yrs
- Air quality 4/10 Moderate 6 unhealthy d/yr today · 7 by 30 yrs out
Nearby sold comps map
Loading sold comps map…
Walkable amenities ~0.75 mi
Loading nearby amenities…
Taxation est. · year 1
- Rental income
- $21,195
- − Mortgage interest
- −$3,809
- − Property taxes
- −$1,884
- − Insurance
- −$340
- − Repairs & maintenance
- −$1,696
- − Management
- −$1,696
- − Depreciation
- −$1,978
- Taxable income
- $9,792
- Est. tax owed @ 24.0%
- −$2,350
- After-tax cash flow
- $7,891/yr
For passive investors: Depreciation is non-cash, so a rental often shows a tax loss while cash-flowing — sheltering income. Rental losses are passive: they offset passive income freely, and up to $25,000/yr can offset ordinary (W-2) income if you actively participate and your MAGI is under $100k (phasing out to $0 by $150k); unused losses carry forward. On sale, claimed depreciation is recaptured at up to 25%, and gains may owe capital-gains tax (a 1031 exchange can defer both). Figures are a year-1 estimate at your 24.0% rate — not tax advice; consult a CPA.
Schools (NCES district)
- District
- Baltimore City Public Schools
- NCES district ID
- 2400090
- Math proficiency
- 7% ▼ -9.00%
- Reading proficiency
- 16% ▼ -5.00%
- Median HH income
- $42,108
- Composite
- 10.08/100
- National rank
- #9805
- State rank
- #24 of 24 in MD
Livability — Baltimore
- Score
- 76/100
- State rank
- #90
- US rank
- #3396
Category grades
Schools grade is shown separately in the Schools card above.
Census & demographics
- Census place
- Baltimore, MD
- County
- Baltimore City · 558,601 people
- City population
- 588,727
- Metro
- Baltimore-Columbia-Towson, MD
- Population (ZIP)
- 33,974
- Household income
- $96,685
- Rent vs Own
- Severe rent burden
- 769.0
Population outlook (Baltimore County) Hauer SSP2
- Today (2025)
- 624,249 people
- By 2030
- 621,541 · -0.4%
- By 2040
- 609,756 · -2.3%
- By 2050
- 597,249 · -4.3%
- By 2075
- 552,236 · -11.5%
- By 2100
- 513,934 · -17.7%
Race, ethnicity, and origin ACS 2023
- Neighborhood character
- Diverse neighborhood (Simpson 0.64)
- Race & ethnicity
- White 49% Black 35% Two or more races 9% Hispanic / Latino 7% Asian 4%
- Hispanic origin (detail)
- Mexican 1% Puerto Rican 1%
- Common ancestry
- Romanian 3% Italian 2% Slovak 2%
- Foreign-born
- 9% · Canada, China
- Languages at home
- 87% English-only · Spanish 5% Other Indo-European 2% French/Haitian/Cajun 1%
Political lean MEDSL · Baltimore
- 2024 margin
- Solid D (+73.0) · D 85.2% · R 12.2% · Other 2.6%
- 2008→2024 swing
- -2.5pp toward R · 2008: 75.5pp · 2024: 73.0pp
- All cycles
- 2024: D+73.0 2020: D+76.6 2016: D+74.6 2012: D+76.4 2008: D+75.5
Not yet ingested
- Civics
- —
Market trends
- HPI YoY
- ▼ -392.44%
- Current HPI
- 267.4569
- Rent YoY
- ▲ 4.65%
- Metro
- Baltimore-Columbia-Towson, MD
- State GDP YoY
- ▲ 2.97%
- F500 in state
- 12
Industry mix (Fortune 500 HQ in MD)
| Industry | F500 HQs | Revenue |
|---|---|---|
| Aerospace / Defense | 1 | $71B |
|
||
| Utilities | 1 | $25B |
|
||
| Hotels | 1 | $24B |
|
||
| Consumer Goods | 1 | $7B |
|
||
| Real Estate | 1 | $6B |
|
||
| Chemicals | 1 | $2B |
|
||
Price history
+106.1% since first listed15 events — show timeline
- 2026-04-07 Listed $68,000 BRIGHT MLS
- 2026-03-11 Listing Removed — BRIGHT MLS
- 2026-01-08 Price Changed $65,000 BRIGHT MLS
- 2025-11-18 Listed $80,000 BRIGHT MLS
- 2017-09-08 Sold (Public Records) $30,900 Public Records
- 2017-08-24 Listing Removed — BRIGHT MLS
- 2017-08-22 Sold (MLS) $30,900 MRIS
- 2017-08-22 Sold (MLS) $30,900 BRIGHT MLS
- 2017-08-01 Pending — MRIS
- 2017-06-03 Price Changed $35,000 MRIS
- 2017-05-30 Relisted — MRIS
- 2017-04-22 Pending — MRIS
- 2017-04-16 Listed $31,000 MRIS
- 2017-04-16 Listed $35,000 BRIGHT MLS
- 1981-08-27 Sold (Public Records) $33,000 Public Records
Property tax history
+0.1%/yrLatest (2025): $1,884 · +7.9% YoY. Source: county tax records.
Cash-flow waterfall
monthlySold comps — $/sqft
last 12 mo · ≤1 miLoading sold comps…