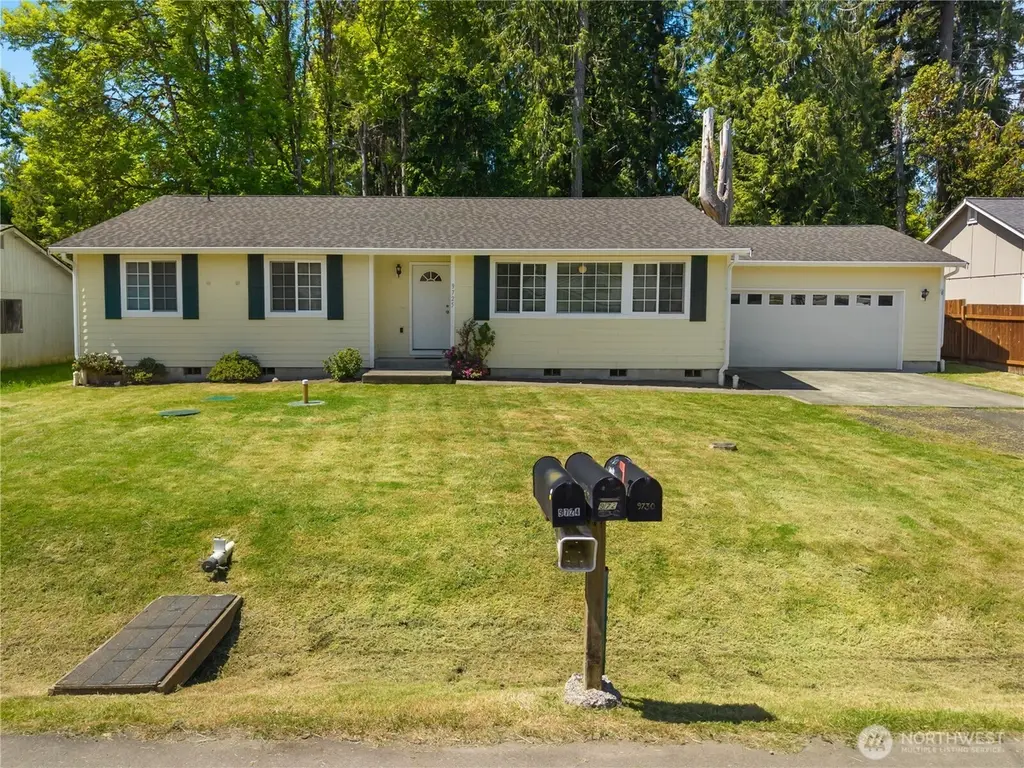
9725 Channel Dr NW · Olympia, WA
Flood risk 4/10 · Minor
- FEMA flood zone
- X (unshaded)
- Chance of flooding over 30 yrs
- 0.22%
- Est. flood insurance / yr
- $507 – $1,088
Fire risk 1/10 · Minimal
- Est. fire insurance / yr
- $604 – $1,122
Heat risk 3/10 · Minor
- Hot days now (above 88°F)
- 7 days/yr
- Hot days in 30 yrs
- 14 days/yr
Wind risk 1/10 · Minimal
- Chance of severe wind over 30 yrs
- —
Air-quality risk 6/10 · Moderate
- Unhealthy air days now
- 7 days/yr
- Unhealthy air days in 30 yrs
- 7 days/yr
Risk factors via First Street. Map © Google.
Why this score? — see what drove the D grade
The composite is a weighted blend of 9 inputs, each scored 0–100. Each bar is that input's sub-score; the figure is the points it added to the 100-point composite (weight × sub-score).
- ARV discount +12.5/15.0
- Appreciation +10.0/10.0
- Schools +5.8/10.0
- Cash flow +5.2/30.0
- Livability +4.2/5.0
- Rent growth +3.3/5.0
- Condition / age +2.5/5.0
- 1% rule +0.4/10.0
- DSCR +0.0/10.0
$490,000
🖨 Deal sheet 📄 Offer letter ✓ Due diligence
Listing remarks
Welcome to Carlyon Beach! This updated 1,710 SF rambler offers 3 BR, 2 BA, and an easy one-level floorplan with a 2-car attached garage. Fresh interior paint, new flooring, new refrigerator, new range, and new toilets help make this home move-in ready. Enjoy comfortable living spaces, a practical layout, and the relaxed feel of a waterfront community without the waterfront price. Carlyon Beach HOA amenities include a clubhouse, community dock, marina, boat launch, waterfront park, kayak racks, community garden, kids’ park, and dog park. The community waterfront park offers beach access, play areas, basketball court, horseshoe pits, picnic-style gathering space, and a covered Wanigan w
Key facts
- Dog park
- Waterfront park
- Boat launch
Tags
Property features AI
Finance
- Financial info: Financing accepted: Cash, Conventional, FHA, State Bond, USDA Loan, VA Loan
- HOA & community: HOA with monthly fee of $127 covering common area and road maintenance; Community amenities include boat launch, clubhouse, park, playground; CCRs apply; Community waterfront/private beach access
Exterior
- Parking: Attached garage (has garage); 2 covered spaces; 2 uncovered parking spaces; Driveway
- Utilities: Electric power; Community water (managed by CBHOA); Sewer connected (CBHOA); Cable (Comcast); Internet (XFinity)
- Home design: Single-family residence; One story; Main level entry; East-facing
- Construction: Built on lot; Standard frame construction; Cement plank exterior; Composition roof; Concrete ribbon foundation; House structure
- Exterior features: Cement plank siding; Patio; Paved lot; Level topography
Interior
- Kitchen: Dishwasher; Refrigerator; Stove/Range
- Bedrooms: 3 bedrooms on the main level
- Flooring: Vinyl; Vinyl plank
- Bathrooms: 2 full bathrooms (main level) with tubs and showers
- Heating & cooling: Has heating; No central air conditioning
- Interior features: Ceiling fans; French doors; Vaulted ceilings; Electric water heater (located in garage)
- Laundry & utility: Water heater in garage
Neighborhood map
What this means for you Summary
Snapshot
- This is a 3-bed/2.0-bath single-family listed at $490k.
Deal economics
- At list price, monthly cash flow is $-1k ($-13k/yr) — negative.
- To cash-flow at today's rent, offer at most $293k (40.1% below list).
- To meet the 1% rule (rent ≥ 1% of price), the offer needs to be $266k (45.8% below list).
- Recommended offer: $266k (45.8% below list) — sets the bar for 1% rule.
- Cap rate 3.6% vs local median 2.4% in Olympia — top-decile yield for the area; either an underpriced asset or a hidden risk that comps aren't pricing in. Stress-test before assuming the spread holds.
Location & tenants
- Location reads 83/100 on livability (#58 in WA, #1,036 nationally) — a professional / high-income tenant draw. Strengths: amenities A+, commute A+, health & safety A+; Watch: crime F, cost of living D-.
- Griffin School District (suburban): math 59% / reading 68% proficiency, ranked #28 of 291 in WA (top 10%) — acceptable for families but not a draw, mixed tenant base, ~2y average lease; only 14% free/reduced lunch — higher-income household profile.
- Zoned schools: Griffin School (577 students, 23% FRL).
- Market conditions: Rents rising (+3.2%/yr); 304 active listings in the ZIP; 1 comparable units currently listed for rent nearby; solid renter incomes; 1,222 units permitted in Thurston County in 2024 (508 in 5+ unit buildings).
- This rent runs 35% of the median local income ($92k/yr) — at the standard rent-burdened threshold; future hikes will face affordability resistance.
Forward outlook
- In year one you build about $52k of equity ($3k loan paydown + $49k appreciation (10.0% local appreciation)).
- Thurston County population projected at +27% by 2050 — long-run rental-demand tailwind backs the buy-and-hold thesis.
- By year 2, paydown + projected appreciation supports a ~$84k cash-out refi (75% LTV) — recoverable capital for the next deal without selling this one.
Negotiation context
- It's been on market 26 days — a 2% lower offer ($483k) is reasonable based on typical stale-listing flexibility.
Questions for the listing agent
- What do current leases actually rent for vs. the listed asking? Can we see a recent rent roll and the last 12 months of T-12 income?
- What does the HOA fee cover, when was the last increase, and are there any pending special assessments or reserve-fund shortfalls?
- Is there a deadline driving the sale (1031 exchange, divorce, estate, relocation)? That informs how much negotiation room exists.
- Schools are A-rated — typically a magnet for longer-tenancy family renters. What's the average tenant stay here, and is there a school-zone premium baked into asking?
- Crime grade is F in this area — have there been break-ins, vandalism, or insurance claims at this property in the last 3 years? What carrier currently insures it and at what premium?
- The area grade is low — what's the realistic commute time and amenity access for the typical tenant pool here? Any planned neighborhood developments (good or bad) we should know about?
- What's the average days-on-market for RENTAL listings here right now (not sales)? A rising rental-DOM trend means longer vacancies and softer asking-rent achievability than the comps imply.
- What's the recent tenant-quality profile in this submarket — average credit score on applications, eviction rate, late-payment / NSF rate, and stable-employment percentage? A property-management company in the area should have these aggregated.
- How much new for-sale + rental construction is in the pipeline within 1–3 miles? Heavy new supply typically softens prices + rents 12–24 months out; constrained supply supports both.
Investment metrics
- 1% rule
- 0.54% ✗
- Cap rate
- 3.57%
- Cash-on-cash
- -9.74%
- DSCR
- 0.57
- GRM
- 15.4
CMA / ARV
- ARV (on-the-fly)
- $550,620
- Comps found
- 12
Show comp detail 12 sales within ~0.75 mi
| Address | Dist | Beds/Ba | Sqft | Sold | Price | $/sf | Match |
|---|---|---|---|---|---|---|---|
| 9733 Whitecap Dr NW | 0.07mi | 3/2.0 | 1,704 (-0%) | 16mo | $465,000 | $273 | 83 |
| 9910 Whitecap Dr NW | 0.15mi | 3/2.0 | 1,650 (-4%) | 14mo | $483,000 | $293 | 76 |
| 9828 Channel Dr NW | 0.12mi | 3/2.5 | 1,871 (+9%) | 2mo | $492,000 | $263 | 75 |
| 10139 Windward Dr NW | 0.40mi | 3/2.0 | 1,688 (-1%) | 7mo | $695,000 | $412 | 73 |
| 9832 Whitecap Dr NW | 0.09mi | 2/2.0 (-1) | 1,545 (-10%) | 2mo | $510,000 | $330 | 73 |
| 9800 Steamboat Island Rd NW | 0.08mi | 3/2.0 | 1,467 (-14%) | 5mo | $496,500 | $338 | 68 |
| 9722 Overlook Dr NW | 0.09mi | 3/2.5 | 1,936 (+13%) | 6mo | $430,000 | $222 | 67 |
| 9806 Lookout Dr NW | 0.45mi | 3/2.0 | 1,810 (+6%) | 4mo | $510,000 | $282 | 66 |
| 10017 Steamboat Island Rd NW | 0.30mi | 2/2.0 (-1) | 1,880 (+10%) | 8mo | $938,000 | $499 | 58 |
| 2216 Westwind Dr NW | 0.40mi | 3/2.0 | 1,491 (-13%) | 12mo | $479,500 | $322 | 50 |
| 2232 Westwind Dr NW | 0.38mi | 3/2.0 | 1,464 (-14%) | 16mo | $455,000 | $311 | 45 |
| 9120 Steamboat Island Rd NW | 0.69mi | 2/2.0 (-1) | 1,616 (-6%) | 12mo | $524,900 | $325 | 44 |
Match score weights: distance 35% · size 25% · config 20% · recency 20%. Top-matched comps best support the ARV.
Projected returns pro-forma
10.0% appreciation · 3.16% rent growth · sell at horizon
- IRR
- 17.5%
- Equity multiple
- 2.43×
- Total profit
- $196,329
- Equity at exit
- $441,431
- IRR
- 16.5%
- Equity multiple
- 5.63×
- Total profit
- $634,652
- Equity at exit
- $951,962
Cash invested: $137,200 (down + closing). Projections, not guarantees.
Landlord ↔ Tenant lean methodology
- Overall (STATE)
- 28 Tenant-Leaning
- State Washington
- 28 Tenant-Leaning · D+8
- County
- — inherits STATE
- City
- — inherits STATE
ZIP-level market 98502
- Home prices YoY
- 1.8%
- Rents YoY
- 3.2%
- Active inventory
- 304
- Price-to-rent
- 15.4×
Monthly cashflow live
- Estimated rent
- $2,656 medium interval (Pro) →
- Mortgage (P&I)
- −$2,570
- Tax from tax record
- −$310 /mo · $3,723/yr
- Insurance
- −$204
- HOA
- −$127
- Vacancy / Maint / Mgmt
- −$558
- Net cashflow
- $-1,113
Break-even live
UW: 25.0% down · 7.5% · 30yr · 1.5% tax · 5.0% vac · 8.0% maint · 8.0% mgmt
Financing live
Cash to close
- Down payment
- $122,500
- Closing costs
- $14,700
- Reserves months
- —
- Total cash needed
- —
Loan-product check · same deal, 3 products live
Conventional
25% down · 7.5% · 30yr
- Down + closing
- —
- Monthly P&I
- —
- Monthly cashflow
- —
- DSCR
- —
- Eligible?
- —
Personal DTI + credit; lowest rate.
DSCR
20% down · 8.5% · 30yr
- Down + closing
- —
- Monthly P&I
- —
- Monthly cashflow
- —
- DSCR
- —
- Eligible?
- —
No personal income docs; deal must DSCR.
Hard money
10% down · 12.0% · 12mo
- Down + closing
- —
- Monthly P&I
- —
- Monthly cashflow
- —
- DSCR
- —
- Eligible?
- —
Short-term bridge; refi at stabilization.
Rent comps 1 comps
| Address | Beds | Baths | Sqft | Rent | $/sqft | DOM | Units | Dist |
|---|---|---|---|---|---|---|---|---|
| 10019 Mariner Dr NW Olympia, WA | 2.0 | 2.0 | 1625 | $2,995 | $1.84 | 43d | 1 | 0.41mi |
HOA detail
- Monthly dues
- $127 · $1,524/yr
- Likely covers
- water
Listing history 16 events
-
2026-06-18days on market $490,000 Active 26 DOM
-
2026-06-17days on market $490,000 Active 25 DOM
-
2026-06-16days on market $490,000 Active 24 DOM
-
2026-06-15days on market $490,000 Active 23 DOM
-
2026-06-14days on market $490,000 Active 21 DOM
-
2026-06-13days on market $490,000 Active 20 DOM
-
2026-06-10days on market $490,000 Active 18 DOM
-
2026-06-09days on market $490,000 Active 17 DOM
-
2026-06-08days on market $490,000 Active 16 DOM
-
2026-06-07days on market $490,000 Active 15 DOM
-
2026-06-05days on market $490,000 Active 12 DOM
-
2026-06-02days on market $490,000 Active 10 DOM
-
2026-06-01days on market $490,000 Active 9 DOM
-
2026-05-31days on market $490,000 Active 8 DOM
-
2026-05-30days on market $490,000 Active 7 DOM
-
2026-05-23$490,000 Active
ⓘ Source: listings_history table (triggers on properties + properties_extension) + one-shot
backfill from property_details.listing_events for pre-trigger history.
Tax reassessment forecast WA · Resets to sale price
- Current annual tax
- $3,723 · $310/mo
- Projected year-2 tax
- $4,802 · $400/mo
- Expected delta
- +$1,079/yr (+$90/mo · 29.0%)
ⓘ Screening estimate from a state-policy table — verify with the county assessor before closing.
Climate risk First Street
- Flood 4/10 Moderate FEMA zone X (unshaded) · 22% chance over 30 yrs
- Wildfire 1/10 Low
- Heat 3/10 Moderate 7 d/yr ≥88°F today · 14 d/yr by 30 yrs out
- Wind 1/10 Low
- Air quality 6/10 Major 7 unhealthy d/yr today · 7 by 30 yrs out
Nearby sold comps map
Loading sold comps map…
Walkable amenities ~0.75 mi
Loading nearby amenities…
Taxation est. · year 1
- Rental income
- $31,866
- − Mortgage interest
- −$27,448
- − Property taxes
- −$3,723
- − Insurance
- −$2,450
- − Repairs & maintenance
- −$2,549
- − Management
- −$2,549
- − HOA
- −$1,524
- − Depreciation
- −$14,255
- Taxable loss
- −$22,631
- Est. tax savings @ 24.0%
- +$5,432
- After-tax cash flow
- $-7,926/yr
For passive investors: Depreciation is non-cash, so a rental often shows a tax loss while cash-flowing — sheltering income. Rental losses are passive: they offset passive income freely, and up to $25,000/yr can offset ordinary (W-2) income if you actively participate and your MAGI is under $100k (phasing out to $0 by $150k); unused losses carry forward. On sale, claimed depreciation is recaptured at up to 25%, and gains may owe capital-gains tax (a 1031 exchange can defer both). Figures are a year-1 estimate at your 24.0% rate — not tax advice; consult a CPA.
Schools (NCES district)
- District
- Griffin School District
- NCES district ID
- 5303330
- Math proficiency
- 59% ▼ -2.00%
- Reading proficiency
- 68% ▼ -4.00%
- Median HH income
- $80,706
- Composite
- 58.36/100
- National rank
- #2079
- State rank
- #28 of 291 in WA
Livability — Olympia
- Score
- 83/100
- State rank
- #58
- US rank
- #1036
Category grades
Schools grade is shown separately in the Schools card above.
Census & demographics
- County
- Thurston County · 269,345 people
- City population
- 98,428
- Metro
- Olympia-Lacey-Tumwater, WA
- Population (ZIP)
- 35,398
- Household income
- $92,207
- Rent vs Own
- Severe rent burden
- 1811.0
Population outlook (Thurston County) Hauer SSP2
- Today (2025)
- 308,239 people
- By 2030
- 326,483 · +5.9%
- By 2040
- 359,890 · +16.8%
- By 2050
- 391,800 · +27.1%
- By 2075
- 468,024 · +51.8%
- By 2100
- 519,890 · +68.7%
Race, ethnicity, and origin ACS 2023
- Neighborhood character
- Predominantly White (71%)
- Race & ethnicity
- White 71% Two or more races 13% Hispanic / Latino 11% Asian 6% Black 3% Native American 1%
- Hispanic origin (detail)
- Mexican 3% Puerto Rican 4%
- Common ancestry
- Italian 5% Portuguese 4% Iranian 3%
- Foreign-born
- 8% · Vietnam, Canada, China
- Languages at home
- 90% English-only · Spanish 3% Vietnamese 2% Other Asian/Pacific 1%
Political lean MEDSL · Thurston
- 2024 margin
- Strong D (+20.4) · D 58.5% · R 38.1% · Other 3.5%
- 2008→2024 swing
- -1.3pp toward R · 2008: 21.7pp · 2024: 20.4pp
- All cycles
- 2024: D+20.4 2020: D+18.6 2016: D+15.4 2012: D+19.0 2008: D+21.7
Not yet ingested
- Civics
- —
Market trends
- HPI YoY
- ▲ 18.49%
- Current HPI
- 1056.49
- Rent YoY
- ▲ 3.16%
- Metro
- Olympia-Lacey-Tumwater, WA
- State GDP YoY
- ▲ 4.65%
- F500 in state
- 22
Industry mix (Fortune 500 HQ in WA)
| Industry | F500 HQs | Revenue |
|---|---|---|
| Retail | 2 | $269B |
|
||
| Technology / Retail | 1 | $638B |
|
||
| Technology | 1 | $245B |
|
||
| Telecommunications | 1 | $38B |
|
||
| Food / Beverage | 1 | $36B |
|
||
| Automotive / Trucks | 1 | $34B |
|
||
Price history
1 event — show timeline
- 2026-05-23 Listed $490,000 NWMLS as Distributed by MLS Grid
Property tax history
+3.5%/yrLatest (2026): $3,723 · +1.6% YoY. Source: county tax records.
Cash-flow waterfall
monthlySold comps — $/sqft
last 12 mo · ≤1 miLoading sold comps…