29 High Point Cir E #308 · Naples, FL
Flood risk 6/10 · Moderate
- FEMA flood zone
- X
- Chance of flooding over 30 yrs
- 0.54%
- Est. flood insurance / yr
- $507 – $1,088
Fire risk 2/10 · Minimal
- Est. fire insurance / yr
- $947 – $1,759
Heat risk 10/10 · Severe
- Hot days now (above 107°F)
- 7 days/yr
- Hot days in 30 yrs
- 25 days/yr
Wind risk 10/10 · Severe
- Chance of severe wind over 30 yrs
- 99.0%
Air-quality risk 2/10 · Minimal
- Unhealthy air days now
- 2 days/yr
- Unhealthy air days in 30 yrs
- 2 days/yr
Risk factors via First Street. Map © Google.
Why this score? — see what drove the C- grade
The composite is a weighted blend of 9 inputs, each scored 0–100. Each bar is that input's sub-score; the figure is the points it added to the 100-point composite (weight × sub-score).
- Cash flow +17.4/30.0
- 1% rule +7.7/10.0
- ARV discount +7.5/15.0
- DSCR +5.4/10.0
- Rent growth +5.0/5.0
- Schools +5.0/10.0
- Livability +4.0/5.0
- Condition / age +2.5/5.0
- Appreciation +0.0/10.0
$365,000
🖨 Deal sheet 📄 Offer letter ✓ Due diligence
Listing remarks
Must see END UNIT . .. .. Beautiful sunsets can be yours! Highly sought after, rarely available in Building 29, with an impressive view of the golf course! Centrally located between Venetian Village and world famous 5th Ave, High Point Country Club is just a short bike ride or walk to the beach. Enjoy 6 pools, bocce, tennis, pickleball, exercise room, and IMMEDIATE 2 person GOLF membership. The social calendar at this country club is booming, and you do not want to miss the fun. Seasonal restaurant open for both breakfast and dinner. Condo includes impact glass sliders and lanai screens so you get the best lanai enjoyment possible. New plantation shutters and solar shades are also included
Key facts
- Tennis
- 6 pools
- Impact glass sliders
Tags
Property features AI
Finance
- Other: Part of a complex with 473 units; 40 units in the building; 3 units per floor; building number 29; unit/lot 308; Possession at closing; Restrictions include limited build time, no commercial, no corporate buyer, no RV (see remarks)
- HOA & community: Mandatory HOA; Master association fee approximately $10,492 annually; Total one-time fees approximately $150; Professional management; HOA maintenance includes cable, internet/WiFi, irrigation water, sewer, trash removal, water, golf course and master association fee included; Community type: golf course (golf bundled); Community amenities include: clubhouse, community pool, exercise room, tennis, pickleball, bocce, putting green, bike/jog path, bike storage, restaurant, BBQ/picnic, hobby room, library, extra storage, streetlights, vehicle wash area and private membership (see remarks)
Exterior
- Parking: 1 assigned covered parking space; Detached 1-car carport; Additional load space and paved parking
- Utilities: Water assessment paid; Sewer assessment paid; Cable available
- Home design: Residential mid-rise (4-7 stories); End-unit; Built in 1981; Located in HIGH POINT / High Point Country Club development
- Construction: Concrete block construction; Stucco finish; Built-up or flat roof; Year built: 1981
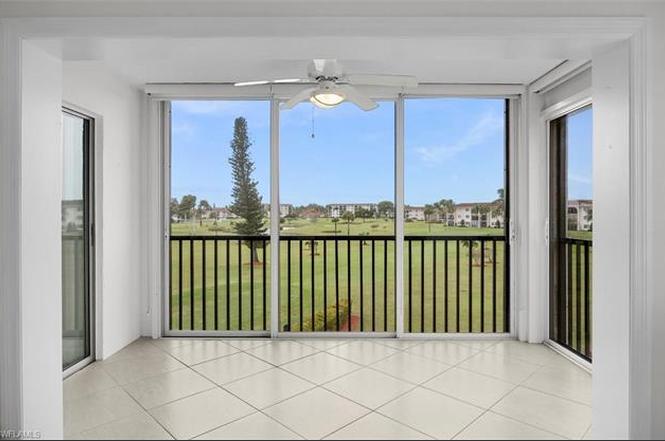
- Exterior features: Stucco exterior; Impact resistant windows and doors; Built-up or flat roof; Golf course view; Landscaped area, pond and water feature views; Paved road access; End-unit; Rear exposure facing west; Irrigation assessment paid
Interior
- Kitchen: Pantry; Dishwasher; Microwave; Refrigerator/Freezer; Gas/electric range not specified
- Bedrooms: 2 bedrooms (split bedroom floor plan)
- Flooring: Tile
- Bathrooms: 2 full bathrooms; Master bath: see remarks
- Heating & cooling: Central electric heat; Central electric cooling; Ceiling fans
- Interior features: Built-in cabinets; Pantry; Smoke detectors; See remarks; Common elevator; Screened lanai/porch
- Laundry & utility: Washer; Dryer
Neighborhood map
What this means for you Summary
Snapshot
- This is a 2-bed/2.0-bath condo listed at $365k.
Deal economics
- At list price, monthly cash flow is $274 ($3k/yr) — positive.
- The deal already cash-flows at list — no discount required.
- Meets the 1% rule at list price ($5k rent vs $365k).
- Recommended offer: $321k (12.0% below list) — sets the bar for market timing.
Location & tenants
- Location reads 80/100 on livability (#126 in FL, #1,903 nationally) — a professional / high-income tenant draw. Strengths: crime A+, amenities A+, employment A+; Watch: commute D+, cost of living F.
- Collier (suburban): math 60% / reading 56% proficiency, ranked #16 of 73 in FL (top 22%) — acceptable for families but not a draw, mixed tenant base, ~2y average lease.
- Market conditions: Rents rising fast (+14.6%/yr); 479 active listings in the ZIP; 40 comparable units currently listed for rent nearby; rentals at typical pace (median 24d on market — plan ~3-4 weeks tenant-placement turnaround); high-income renter base; 3,520 units permitted in Collier County in 2024 (959 in 5+ unit buildings).
- At $4,646/mo this rent would consume 48% of the median local household income ($117k/yr) (locally 311% of renters already pay >50% of income on rent) — very limited rent-growth headroom before tenants either downsize or default.
Forward outlook
- Local home prices are declining (-3.0%/yr); year-one equity from $3k of loan paydown is wiped out by about $11k of value loss. Plan a longer hold.
- Collier County population projected at +30% by 2050 — long-run rental-demand tailwind backs the buy-and-hold thesis.
- At projected returns (-3.0% appreciation + 8.0% rent growth), your $102k cash investment doubles in ~9 years — after that, you're playing with house money.
Negotiation context
- It's been on market 154 days — a 12% lower offer ($321k) is reasonable based on typical stale-listing flexibility.
Risks & watch-outs
- Climate carrying-cost: major flood risk; severe wind risk, 99% chance of damaging wind over 30y; extreme-heat days projected 7→25/yr by 2055 (HVAC capex compounding) — expect insurance premiums to compound above CPI over the hold.
Questions for the listing agent
- It's been on market 154 days. Have you received any prior offers? Is the seller open to a 12% concession, seller financing, or rate buy-down credit?
- What does the HOA fee cover, when was the last increase, and are there any pending special assessments or reserve-fund shortfalls?
- Any open or pending special assessments — roof, HVAC, plumbing, elevator, façade? What's the per-unit balance and payoff schedule, and is the seller paying it off at close or rolling it to the buyer?
- Why hasn't it sold? Are there any deal-killer items the seller is aware of (foundation, flood, title, zoning, code violations)?
- Is there a deadline driving the sale (1031 exchange, divorce, estate, relocation)? That informs how much negotiation room exists.
- Schools are B-rated — typically a magnet for longer-tenancy family renters. What's the average tenant stay here, and is there a school-zone premium baked into asking?
- What's the average days-on-market for RENTAL listings here right now (not sales)? A rising rental-DOM trend means longer vacancies and softer asking-rent achievability than the comps imply.
- What's the recent tenant-quality profile in this submarket — average credit score on applications, eviction rate, late-payment / NSF rate, and stable-employment percentage? A property-management company in the area should have these aggregated.
- How much new apartment / multifamily construction is in the pipeline within 1–3 miles? Heavy new supply (>2% of stock underway) typically softens rents 12–24 months out; light construction supports rent growth.
Investment metrics
- 1% rule
- 1.27% ✓
- Cap rate
- 7.19%
- Cash-on-cash
- 3.22%
- DSCR
- 1.14
- GRM
- 6.5
CMA / ARV
No comps found within radius.
Projected returns pro-forma
-3.0% appreciation · 8.0% rent growth · sell at horizon
- IRR
- -4.0%
- Equity multiple
- 0.84×
- Total profit
- $-16,515
- Equity at exit
- $54,423
- IRR
- 11.8%
- Equity multiple
- 2.20×
- Total profit
- $122,340
- Equity at exit
- $31,559
Cash invested: $102,200 (down + closing). Projections, not guarantees.
Landlord ↔ Tenant lean methodology
- Overall (STATE)
- 87 Strongly Landlord-Friendly
- State Florida
- 87 Strongly Landlord-Friendly · R+3
- County
- — inherits STATE
- City
- — inherits STATE
ZIP-level market 34103
- Rents YoY
- 14.6%
- Active inventory
- 479
- Price-to-rent
- 6.5×
Monthly cashflow live
- Estimated rent
- $4,646 medium interval (Pro) →
- Mortgage (P&I)
- −$1,914
- Tax est. 1.5%
- −$456 /mo · $5,475/yr
- Insurance
- −$152
- HOA
- −$874
- Vacancy / Maint / Mgmt
- −$976
- Net cashflow
- $274
Break-even live
UW: 25.0% down · 7.5% · 30yr · 1.5% tax · 5.0% vac · 8.0% maint · 8.0% mgmt
Financing live
Cash to close
- Down payment
- $91,250
- Closing costs
- $10,950
- Reserves months
- —
- Total cash needed
- —
Loan-product check · same deal, 3 products live
Conventional
25% down · 7.5% · 30yr
- Down + closing
- —
- Monthly P&I
- —
- Monthly cashflow
- —
- DSCR
- —
- Eligible?
- —
Personal DTI + credit; lowest rate.
DSCR
20% down · 8.5% · 30yr
- Down + closing
- —
- Monthly P&I
- —
- Monthly cashflow
- —
- DSCR
- —
- Eligible?
- —
No personal income docs; deal must DSCR.
Hard money
10% down · 12.0% · 12mo
- Down + closing
- —
- Monthly P&I
- —
- Monthly cashflow
- —
- DSCR
- —
- Eligible?
- —
Short-term bridge; refi at stabilization.
Rent comps 40 comps
| Address | Beds | Baths | Sqft | Rent | $/sqft | DOM | Units | Dist |
|---|---|---|---|---|---|---|---|---|
| 45 High Point Cir S #303 Naples, FL | 2.0 | 2.0 | 1015 | $5,500 | $5.42 | 23d | 1 | 0.12mi |
| 3200 Binnacle Dr Unit D3 Naples, FL | 2.0 | 2.0 | 1180 | $9,000 | $7.63 | 21d | 1 | 0.51mi |
| 3030 Binnacle Dr #201 Naples, FL | 2.0 | 2.0 | 1092 | $5,000 | $4.58 | 23d | 1 | 0.59mi |
| 820 Ketch Dr #2 Naples, FL | 2.0 | 2.0 | 1100 | $5,700 | $5.18 | 23d | 1 | 0.61mi |
| 820 Ketch Dr #3 Naples, FL | 2.0 | 2.0 | 1100 | $5,500 | $5.00 | 23d | 1 | 0.61mi |
| 788 Park Shore Dr Naples, FL | 1.0–2.0 | 1.5–2.0 | 931 | $5,500 | $5.90 | 13d | 3 | 0.67mi |
| 2400 14th St N Naples, FL | 3.0 | 2.0 | 1464 | $5,890 | $4.02 | 13d | 1 | 0.68mi |
| 3930 Belair Ln Naples, FL | 2.0 | 2.0 | 1300 | $6,000 | $4.62 | 23d | 1 | 0.77mi |
| 3520 Bolero Way Unit 1325569P Naples, FL | 3.0 | 2.0 | 1399 | $5,021 | $3.59 | 13d | 1 | 0.89mi |
| 4092 Belair Ln #15 Naples, FL | 3.0 | 3.0 | 1500 | $6,200 | $4.13 | 23d | 1 | 0.95mi |
| 1082 Capri Dr Naples, FL | 3.0 | 2.0 | 1500 | $9,000 | $6.00 | 23d | 1 | 1.08mi |
| 4523 Fluvia Ave Naples, FL | 2.0 | 1.0 | 1050 | $5,500 | $5.24 | 23d | 1 | 1.10mi |
| 4525 Fluvia Ave Naples, FL | 2.0 | 1.0 | 1050 | $5,500 | $5.24 | 23d | 1 | 1.10mi |
| 333 Harbour Dr #211 Naples, FL | 2.0 | 2.0 | 975 | $5,500 | $5.64 | 13d | 1 | 1.12mi |
| 600 Neapolitan Way Naples, FL | 1.0–2.0 | 2.0 | 832 | $5,200 | $6.25 | 23d | 2 | 1.12mi |
| 555 Park Shore Dr Unit B410 Naples, FL | 2.0 | 2.0 | 1200 | $6,000 | $5.00 | 21d | 1 | 1.13mi |
| 2581 Poinciana St Naples, FL | 3.0 | 2.0 | 1255 | $9,000 | $7.17 | 23d | 1 | 1.14mi |
| 222 Harbour Dr #105 Naples, FL | 2.0 | 2.0 | 1393 | $13,000 | $9.33 | 23d | 1 | 1.21mi |
| 3400 Gulf Shore Blvd N Unit M3 Naples, FL | 2.0 | 2.0 | 1337 | $9,500 | $7.11 | 23d | 1 | 1.22mi |
| 4200 Belair Ln Naples, FL | 2.0–3.0 | 2.0 | 1406 | $6,500 | $4.62 | 23d | 5 | 1.25mi |
| 3200 Gulf Shore Blvd N #105 Naples, FL | 2.0 | 2.0 | 1116 | $8,500 | $7.62 | 23d | 1 | 1.26mi |
| 3070 Gulf Shore Blvd N #103 Naples, FL | 2.0 | 2.0 | 1300 | $8,000 | $6.15 | 23d | 1 | 1.26mi |
| 3500 Gulf Shore Blvd N Naples, FL | 2.0 | 2.0 | 1258 | $7,650 | $6.08 | 23d | 2 | 1.28mi |
| 4300 Belair Ln Naples, FL | 2.0 | 2.0 | 1200 | $6,750 | $5.62 | 13d | 2 | 1.34mi |
| 2600 Gulf Shore Blvd N #64 Naples, FL | 2.0 | 2.0 | 1200 | $7,200 | $6.00 | 23d | 1 | 1.36mi |
| 3443 Gulf Shore Blvd N Naples, FL | 2.0 | 2.0 | 1171 | $12,750 | $10.88 | 13d | 11 | 1.36mi |
| 2885 Gulf Shore Blvd N #302 Naples, FL | 2.0 | 2.0 | 1500 | $20,000 | $13.33 | 23d | 1 | 1.37mi |
| 2500 Gulf Shore Blvd N Unit S6 Naples, FL | 2.0 | 2.0 | 1145 | $7,500 | $6.55 | 23d | 1 | 1.38mi |
| 2258 Gulf Shore Blvd N Unit O1 Naples, FL | 2.0 | 2.0 | 1491 | $13,750 | $9.22 | 23d | 1 | 1.43mi |
| 2216 Gulf Shore Blvd N Unit R3 Naples, FL | 2.0 | 2.0 | 1265 | $10,000 | $7.91 | 23d | 1 | 1.43mi |
| 1400 Pompei Ln Naples, FL | 2.0 | 2.0 | 1012 | $1,888 | $1.86 | 23d | 2 | 1.45mi |
| 4001 Gulf Shore Blvd N #303 Naples, FL | 2.0 | 2.0 | 1248 | $9,000 | $7.21 | 23d | 1 | 1.46mi |
| 4001 Gulf Shore Blvd N #1104 Naples, FL | 2.0 | 2.0 | 1267 | $11,000 | $8.68 | 23d | 1 | 1.46mi |
| 4001 Gulf Shore Blvd N #105 Naples, FL | 2.0 | 2.0 | 1247 | $12,000 | $9.62 | 23d | 1 | 1.46mi |
| 4001 Gulf Shore Blvd N #803 Naples, FL | 2.0 | 2.0 | 1267 | $13,000 | $10.26 | 23d | 1 | 1.46mi |
| 4001 Gulf Shore Blvd N #707 Naples, FL | 2.0 | 2.0 | 1267 | $20,000 | $15.79 | 23d | 1 | 1.46mi |
| 4001 Gulf Shore Blvd N #505 Naples, FL | 2.0 | 2.0 | 1271 | $9,000 | $7.08 | 13d | 1 | 1.46mi |
| 1400 Pompei Ln Unit O-21 Naples, FL | 2.0 | 2.0 | 1025 | $2,200 | $2.15 | 23d | 1 | 1.46mi |
| 1400 Pompei Ln Unit S-21 Naples, FL | 2.0 | 2.0 | 1025 | $3,000 | $2.93 | 23d | 1 | 1.46mi |
| 4005 Gulf Shore Blvd N #607 Naples, FL | 2.0 | 2.0 | 1400 | $14,000 | $10.00 | 23d | 1 | 1.47mi |
HOA detail condo
- Monthly dues
- $874 · $10,488/yr
- Likely covers
- pool
- Assessments
- None detected in remarks — confirm with the listing agent.
Listing history 20 events
-
2026-06-18days on market $365,000 Active 154 DOM
-
2026-06-17days on market $365,000 Active 153 DOM
-
2026-06-16days on market $365,000 Active 152 DOM
-
2026-06-15days on market $365,000 Active 151 DOM
-
2026-06-14days on market $365,000 Active 149 DOM
-
2026-06-10days on market $365,000 Active 146 DOM
-
2026-06-09days on market $365,000 Active 145 DOM
-
2026-06-08days on market $365,000 Active 144 DOM
-
2026-06-07days on market $365,000 Active 143 DOM
-
2026-06-03days on market $365,000 Active 139 DOM
-
2026-06-02days on market $365,000 Active 138 DOM
-
2026-06-01days on market $365,000 Active 137 DOM
-
2026-05-31days on market $365,000 Active 136 DOM
-
2026-05-30days on market $365,000 Active 135 DOM
-
2026-05-08price $384,900
-
2026-03-19price $399,900
-
2026-01-15$439,900 Active
-
2023-12-19soldstatus $385,000
-
2001-11-05soldstatus $85,000
-
1982-02-01soldstatus $86,400
ⓘ Source: listings_history table (triggers on properties + properties_extension) + one-shot
backfill from property_details.listing_events for pre-trigger history.
Climate risk First Street
- Flood 6/10 Major FEMA zone X · 54% chance over 30 yrs
- Wildfire 2/10 Low
- Heat 10/10 Extreme 7 d/yr ≥107°F today · 25 d/yr by 30 yrs out
- Wind 10/10 Extreme 99% chance of damaging wind over 30 yrs
- Air quality 2/10 Low 2 unhealthy d/yr today · 2 by 30 yrs out
Nearby sold comps map
Loading sold comps map…
Walkable amenities ~0.75 mi
Loading nearby amenities…
Taxation est. · year 1
- Rental income
- $55,757
- − Mortgage interest
- −$20,446
- − Property taxes
- −$5,475
- − Insurance
- −$1,825
- − Repairs & maintenance
- −$4,461
- − Management
- −$4,461
- − HOA
- −$10,488
- − Depreciation
- −$10,618
- Taxable loss
- −$2,016
- Est. tax savings @ 24.0%
- +$484
- After-tax cash flow
- $3,775/yr
For passive investors: Depreciation is non-cash, so a rental often shows a tax loss while cash-flowing — sheltering income. Rental losses are passive: they offset passive income freely, and up to $25,000/yr can offset ordinary (W-2) income if you actively participate and your MAGI is under $100k (phasing out to $0 by $150k); unused losses carry forward. On sale, claimed depreciation is recaptured at up to 25%, and gains may owe capital-gains tax (a 1031 exchange can defer both). Figures are a year-1 estimate at your 24.0% rate — not tax advice; consult a CPA.
Schools (NCES district)
- District
- Collier
- NCES district ID
- 1200330
- Math proficiency
- 60% ▼ -4.00%
- Reading proficiency
- 56% ▼ -2.00%
- Median HH income
- $58,275
- Composite
- 50.23/100
- National rank
- #1892
- State rank
- #16 of 73 in FL
Livability — Naples
- Score
- 80/100
- State rank
- #126
- US rank
- #1903
Category grades
Schools grade is shown separately in the Schools card above.
Census & demographics
- County
- Collier County · 396,295 people
- City population
- 344,941
- Metro
- Naples-Marco Island, FL
- Population (ZIP)
- 11,299
- Household income
- $116,875
- Rent vs Own
- Severe rent burden
- 311.0
Population outlook (Collier County) Hauer SSP2
- Today (2025)
- 420,858 people
- By 2030
- 450,054 · +6.9%
- By 2040
- 502,232 · +19.3%
- By 2050
- 544,932 · +29.5%
- By 2075
- 627,203 · +49.0%
- By 2100
- 659,015 · +56.6%
Race, ethnicity, and origin ACS 2023
- Neighborhood character
- Predominantly White (87%)
- Race & ethnicity
- White 87% Hispanic / Latino 10% Two or more races 8% Asian 1%
- Hispanic origin (detail)
- Common ancestry
- Romanian 4% Lithuanian 2% Portuguese 2%
- Foreign-born
- 13% · Canada
- Languages at home
- 87% English-only · Spanish 9% Other Indo-European 2% German/W. Germanic 1%
Political lean MEDSL · Collier
- 2024 margin
- Solid R (+33.1) · D 33.1% · R 66.2%
- 2008→2024 swing
- -10.6pp toward R · 2008: -22.5pp · 2024: -33.1pp
- All cycles
- 2024: R+33.1 2020: R+24.7 2016: R+26.0 2012: R+30.1 2008: R+22.5
Not yet ingested
- Civics
- —
Market trends
- HPI YoY
- ▼ -327.53%
- Current HPI
- 315.1396
- Rent YoY
- ▲ 14.55%
- Metro
- Naples-Marco Island, FL
- State GDP YoY
- ▲ 3.28%
- F500 in state
- 36
Industry mix (Fortune 500 HQ in FL)
| Industry | F500 HQs | Revenue |
|---|---|---|
| Industrial Technology | 2 | $29B |
|
||
| Insurance | 2 | $17B |
|
||
| Retail | 1 | $60B |
|
||
| Technology Distribution | 1 | $58B |
|
||
| Homebuilding | 1 | $35B |
|
||
| Technology Manufacturing | 1 | $35B |
|
||
Price history
+345.5% since first listed6 events — show timeline
- 2026-05-08 Price Changed $384,900 NAPLESMLS
- 2026-03-19 Price Changed $399,900 NAPLESMLS
- 2026-01-15 Listed $439,900 NAPLESMLS
- 2023-12-19 Sold (Public Records) $385,000 Public Records
- 2001-11-05 Sold (Public Records) $85,000 Public Records
- 1982-02-01 Sold (Public Records) $86,400 Public Records
Property tax history
-7.5%/yrLatest (2025): $345 · -88.2% YoY. Source: county tax records.
Cash-flow waterfall
monthlySold comps — $/sqft
last 12 mo · ≤1 miLoading sold comps…