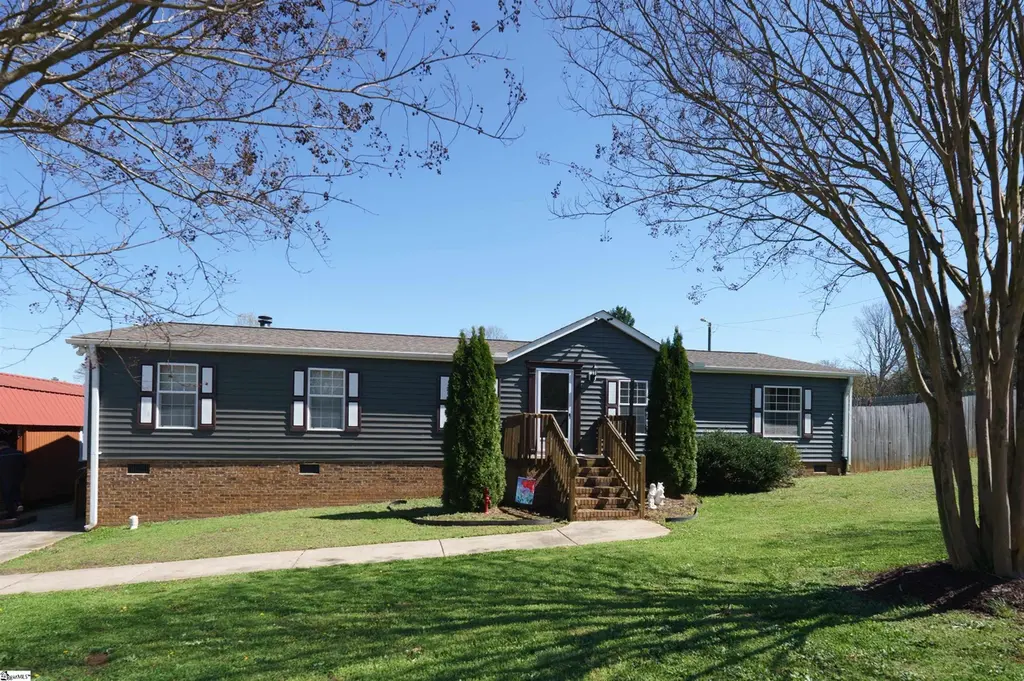
2 Raisinwood Dr · Simpsonville, SC
Flood risk 1/10 · Minimal
- FEMA flood zone
- X (unshaded)
- Chance of flooding over 30 yrs
- 0.0%
- Est. flood insurance / yr
- $507 – $1,088
Fire risk 4/10 · Minor
- Est. fire insurance / yr
- $783 – $1,453
Heat risk 6/10 · Moderate
- Hot days now (above 104°F)
- 7 days/yr
- Hot days in 30 yrs
- 17 days/yr
Wind risk 2/10 · Minimal
- Chance of severe wind over 30 yrs
- 2.0%
Air-quality risk 3/10 · Minor
- Unhealthy air days now
- 3 days/yr
- Unhealthy air days in 30 yrs
- 3 days/yr
Risk factors via First Street. Map © Google.
Why this score? — see what drove the D grade
The composite is a weighted blend of 9 inputs, each scored 0–100. Each bar is that input's sub-score; the figure is the points it added to the 100-point composite (weight × sub-score).
- Cash flow +13.8/30.0
- ARV discount +7.5/15.0
- Livability +4.4/5.0
- DSCR +4.2/10.0
- Schools +4.2/10.0
- 1% rule +3.9/10.0
- Rent growth +3.5/5.0
- Condition / age +2.5/5.0
- Appreciation +0.0/10.0
$250,000
🖨 Deal sheet 📄 Offer letter ✓ Due diligence
Listing remarks
Welcome to 2 Raisinwood Drive — a spacious 4-bedroom, 2-bath home situated on a generous 0.40-acre lot with no HOA or restrictions! This property offers the perfect blend of space, functionality, and flexibility both inside and out. The fenced backyard features a dedicated garden area, while the additional open portion of the lot provides endless possibilities for outdoor living, recreation, or future customization. Two outbuildings (10x20 and 12x32) offer excellent space for storage, hobbies, or a workshop setup, and four installed light poles provide added convenience and visibility throughout the property. This home sits on a permanent foundation and includes several valuable updat
Key facts
- 0.38 acre lot
- Built 2006
- Listed 43 days
Property features AI
Finance
- HOA & community: No HOA fees
Exterior
- Parking: Paved concrete driveway
- Security: Smoke detector
- Utilities: Public water; Private sewer; Public garbage pickup; Electric service
- Home design: Single-story home; Built in 2006; Crawl space foundation; Residential property
- Construction: Architectural roof; Vinyl siding exterior; Outbuilding for storage
- Exterior features: Front porch; Deck; Vinyl/aluminum trim; Vinyl siding
Interior
- Kitchen: Kitchen approx. 12 x 12; Dishwasher; Built-in microwave; Refrigerator; Stand-alone electric range; Freezer
- Bedrooms: 4 bedrooms on the main level; Primary bedroom on main level with double sinks, full bath, separate shower, garden tub, separate tub, and walk-in closet; Primary bedroom approx. 14 x 13; Second bedroom approx. 10 x 13; Third bedroom approx. 10 x 9; Fourth bedroom approx. 9 x 13
- Flooring: Carpet; Laminate flooring
- Bathrooms: 2 full bathrooms (both on the main level)
- Heating & cooling: Electric heating; Central forced cooling; Electric water heater
- Interior features: Ceiling fans; Open floor plan; Smoke detector; Some window treatments; Walk-in closets; Laminate countertops; Ceramic tile countertops; Wood-burning fireplace with screen
- Laundry & utility: Laundry on first floor with washer connection and electric dryer hookup; Walk-in laundry
Neighborhood map
What this means for you Summary
Snapshot
- This is a 4-bed/1.0-bath land listed at $250k.
Deal economics
- At list price, monthly cash flow is $24 ($283/yr) — positive.
- The deal already cash-flows at list — no discount required.
- To meet the 1% rule (rent ≥ 1% of price), the offer needs to be $222k (11.3% below list).
- Recommended offer: $222k (11.3% below list) — sets the bar for 1% rule.
- Cap rate 6.4% vs local median 3.9% in Simpsonville — top-decile yield for the area; either an underpriced asset or a hidden risk that comps aren't pricing in. Stress-test before assuming the spread holds.
Location & tenants
- Location reads 87/100 on livability (#1 in SC, #295 nationally) — a professional / high-income tenant draw. Strengths: commute A+, housing A+, health & safety A+.
- Greenville 01 (suburban): math 44% / reading 54% proficiency, ranked #10 of 80 in SC (top 12%) — families likely to look elsewhere, expect single-tenant / working-renter base with shorter leases.
- Zoned schools: Bryson Elementary (math 52% / reading 52%, grade C-, #145 of 597 statewide, top 26%, 911 students, 70% FRL) — zoned schools average 70% FRL vs 42% district-wide (28 pts higher); higher-poverty schools than district average — tighter screening recommended.
- Market conditions: Rents rising fast (+4.1%/yr); 523 active listings in the ZIP; 7 comparable units currently listed for rent nearby; rentals at typical pace (median 24d on market — plan ~3-4 weeks tenant-placement turnaround); high-income renter base; 5,595 units permitted in Greenville County in 2024 (566 in 5+ unit buildings).
Forward outlook
- Local home prices are declining (-3.0%/yr); year-one equity from $2k of loan paydown is wiped out by about $8k of value loss. Plan a longer hold.
- Greenville County population projected at +34% by 2050 — long-run rental-demand tailwind backs the buy-and-hold thesis.
Negotiation context
- It's been on market 43 days — a 3% lower offer ($242k) is reasonable based on typical stale-listing flexibility.
Risks & watch-outs
- Climate carrying-cost: extreme-heat days projected 7→17/yr by 2055 (HVAC capex compounding) — expect insurance premiums to compound above CPI over the hold.
Questions for the listing agent
- It's been on market 43 days. Have you received any prior offers? Is the seller open to a 11% concession, seller financing, or rate buy-down credit?
- Is there a deadline driving the sale (1031 exchange, divorce, estate, relocation)? That informs how much negotiation room exists.
- Schools are B-rated — typically a magnet for longer-tenancy family renters. What's the average tenant stay here, and is there a school-zone premium baked into asking?
- The area grade is low — what's the realistic commute time and amenity access for the typical tenant pool here? Any planned neighborhood developments (good or bad) we should know about?
- What's the average days-on-market for RENTAL listings here right now (not sales)? A rising rental-DOM trend means longer vacancies and softer asking-rent achievability than the comps imply.
- What's the recent tenant-quality profile in this submarket — average credit score on applications, eviction rate, late-payment / NSF rate, and stable-employment percentage? A property-management company in the area should have these aggregated.
- How much new for-sale + rental construction is in the pipeline within 1–3 miles? Heavy new supply typically softens prices + rents 12–24 months out; constrained supply supports both.
Investment metrics
- 1% rule
- 0.89% ✗
- Cap rate
- 6.41%
- Cash-on-cash
- 0.40%
- DSCR
- 1.02
- GRM
- 9.4
CMA / ARV
No comps found within radius.
Projected returns pro-forma
-3.0% appreciation · 4.09% rent growth · sell at horizon
- IRR
- -14.4%
- Equity multiple
- 0.48×
- Total profit
- $-36,518
- Equity at exit
- $37,276
- IRR
- -4.0%
- Equity multiple
- 0.72×
- Total profit
- $-19,418
- Equity at exit
- $21,615
Cash invested: $70,000 (down + closing). Projections, not guarantees.
Landlord ↔ Tenant lean methodology
- Overall (STATE)
- 90 Strongly Landlord-Friendly
- State South Carolina
- 90 Strongly Landlord-Friendly · R+6
- County
- — inherits STATE
- City
- — inherits STATE
ZIP-level market 29681
- Rents YoY
- 4.1%
- Active inventory
- 523
- Price-to-rent
- 9.4×
Monthly cashflow live
- Estimated rent
- $2,217 high interval (Pro) →
- Mortgage (P&I)
- −$1,311
- Tax est. 1.5%
- −$312 /mo · $3,750/yr
- Insurance
- −$104
- HOA
- −$0
- Vacancy / Maint / Mgmt
- −$466
- Net cashflow
- $24
Break-even live
UW: 25.0% down · 7.5% · 30yr · 1.5% tax · 5.0% vac · 8.0% maint · 8.0% mgmt
Financing live
Cash to close
- Down payment
- $62,500
- Closing costs
- $7,500
- Reserves months
- —
- Total cash needed
- —
Loan-product check · same deal, 3 products live
Conventional
25% down · 7.5% · 30yr
- Down + closing
- —
- Monthly P&I
- —
- Monthly cashflow
- —
- DSCR
- —
- Eligible?
- —
Personal DTI + credit; lowest rate.
DSCR
20% down · 8.5% · 30yr
- Down + closing
- —
- Monthly P&I
- —
- Monthly cashflow
- —
- DSCR
- —
- Eligible?
- —
No personal income docs; deal must DSCR.
Hard money
10% down · 12.0% · 12mo
- Down + closing
- —
- Monthly P&I
- —
- Monthly cashflow
- —
- DSCR
- —
- Eligible?
- —
Short-term bridge; refi at stabilization.
Rent comps 7 comps
| Address | Beds | Baths | Sqft | Rent | $/sqft | DOM | Units | Dist |
|---|---|---|---|---|---|---|---|---|
| 113 Garfield Ln Simpsonville, SC | 3.0 | 2.0 | 1360 | $1,775 | $1.31 | 14d | 1 | 0.62mi |
| 608 Goldburn Way Simpsonville, SC | 3.0 | 2.0 | 2250 | $2,071 | $0.92 | 3d | 1 | 0.78mi |
| 105 Cobden Ct Simpsonville, SC | 3.0 | 2.5 | 1600 | $1,995 | $1.25 | 23d | 1 | 1.15mi |
| 201 Bryland Way Fountain Inn, SC | 3.0–5.0 | 2.5–3.5 | 2109 | $2,148 | $1.02 | 2d | 30 | 1.43mi |
| 29 Merganser Aly Simpsonville, SC | 3.0 | 2.5 | 1676 | $1,979 | $1.18 | 23d | 1 | 1.49mi |
| 37 Red Bank Rd Simpsonville, SC | 3.0 | 2.5 | 1676 | $1,979 | $1.18 | 23d | 1 | 1.50mi |
| 31 Merganser Aly Simpsonville, SC | 3.0 | 2.5 | 1676 | $1,929 | $1.15 | 23d | 1 | 1.50mi |
Listing history 2 events
-
2026-05-01status Pending
-
2026-03-19$250,000 Active
ⓘ Source: listings_history table (triggers on properties + properties_extension) + one-shot
backfill from property_details.listing_events for pre-trigger history.
Climate risk First Street
- Flood 1/10 Low FEMA zone X (unshaded) · 0% chance over 30 yrs
- Wildfire 4/10 Moderate
- Heat 6/10 Major 7 d/yr ≥104°F today · 17 d/yr by 30 yrs out
- Wind 2/10 Low 2% chance of damaging wind over 30 yrs
- Air quality 3/10 Moderate 3 unhealthy d/yr today · 3 by 30 yrs out
Nearby sold comps map
Loading sold comps map…
Walkable amenities ~0.75 mi
Loading nearby amenities…
Taxation est. · year 1
- Rental income
- $26,602
- − Mortgage interest
- −$14,004
- − Property taxes
- −$3,750
- − Insurance
- −$1,250
- − Repairs & maintenance
- −$2,128
- − Management
- −$2,128
- − Depreciation
- −$7,273
- Taxable loss
- −$3,931
- Est. tax savings @ 24.0%
- +$943
- After-tax cash flow
- $1,227/yr
For passive investors: Depreciation is non-cash, so a rental often shows a tax loss while cash-flowing — sheltering income. Rental losses are passive: they offset passive income freely, and up to $25,000/yr can offset ordinary (W-2) income if you actively participate and your MAGI is under $100k (phasing out to $0 by $150k); unused losses carry forward. On sale, claimed depreciation is recaptured at up to 25%, and gains may owe capital-gains tax (a 1031 exchange can defer both). Figures are a year-1 estimate at your 24.0% rate — not tax advice; consult a CPA.
Schools (NCES district)
- District
- Greenville 01
- NCES district ID
- 4502310
- Math proficiency
- 44% ▼ -10.00%
- Reading proficiency
- 54% ▼ -2.00%
- Median HH income
- $49,596
- Composite
- 41.88/100
- National rank
- #3370
- State rank
- #10 of 80 in SC
Livability — Simpsonville
- Score
- 87/100
- State rank
- #1
- US rank
- #295
Category grades
Schools grade is shown separately in the Schools card above.
Census & demographics
- County
- Greenville County · 573,815 people
- City population
- 104,420
- Metro
- Greenville-Anderson, SC
- Population (ZIP)
- 68,650
- Household income
- $114,986
- Rent vs Own
- Severe rent burden
- 865.0
Population outlook (Greenville County) Hauer SSP2
- Today (2025)
- 574,580 people
- By 2030
- 615,615 · +7.1%
- By 2040
- 695,373 · +21.0%
- By 2050
- 769,367 · +33.9%
- By 2075
- 933,296 · +62.4%
- By 2100
- 1,029,196 · +79.1%
Race, ethnicity, and origin ACS 2023
- Neighborhood character
- Predominantly White (71%)
- Race & ethnicity
- White 71% Black 12% Hispanic / Latino 8% Two or more races 8% Asian 4%
- Hispanic origin (detail)
- Mexican 2% Puerto Rican 1%
- Common ancestry
- Romanian 3% Italian 3% Slovak 3%
- Foreign-born
- 8% · Canada, Jamaica, South Korea
- Languages at home
- 89% English-only · Spanish 6% Other Indo-European 1% Other Asian/Pacific 1%
Political lean MEDSL · Greenville
- 2024 margin
- Strong R (+22.2) · D 38.0% · R 60.2% · Other 1.8%
- 2008→2024 swing
- +1.7pp toward D · 2008: -23.9pp · 2024: -22.2pp
- All cycles
- 2024: R+22.2 2020: R+18.2 2016: R+24.7 2012: R+27.8 2008: R+23.9
Not yet ingested
- Civics
- —
Market trends
- HPI YoY
- ▼ -144.64%
- Current HPI
- 226.5252
- Rent YoY
- ▲ 4.09%
- Metro
- Greenville-Anderson, SC
- State GDP YoY
- ▲ 4.51%
- F500 in state
- 2
Industry mix (Fortune 500 HQ in SC)
| Industry | F500 HQs | Revenue |
|---|---|---|
| Packaging | 1 | $7B |
|
||
Price history
2 events — show timeline
- 2026-05-01 Pending — Greater Greenville MLS
- 2026-03-19 Listed $250,000 Greater Greenville MLS
Property tax history
-1.4%/yrLatest (2025): $143 · +59.9% YoY. Source: county tax records.
Cash-flow waterfall
monthlySold comps — $/sqft
last 12 mo · ≤1 miLoading sold comps…