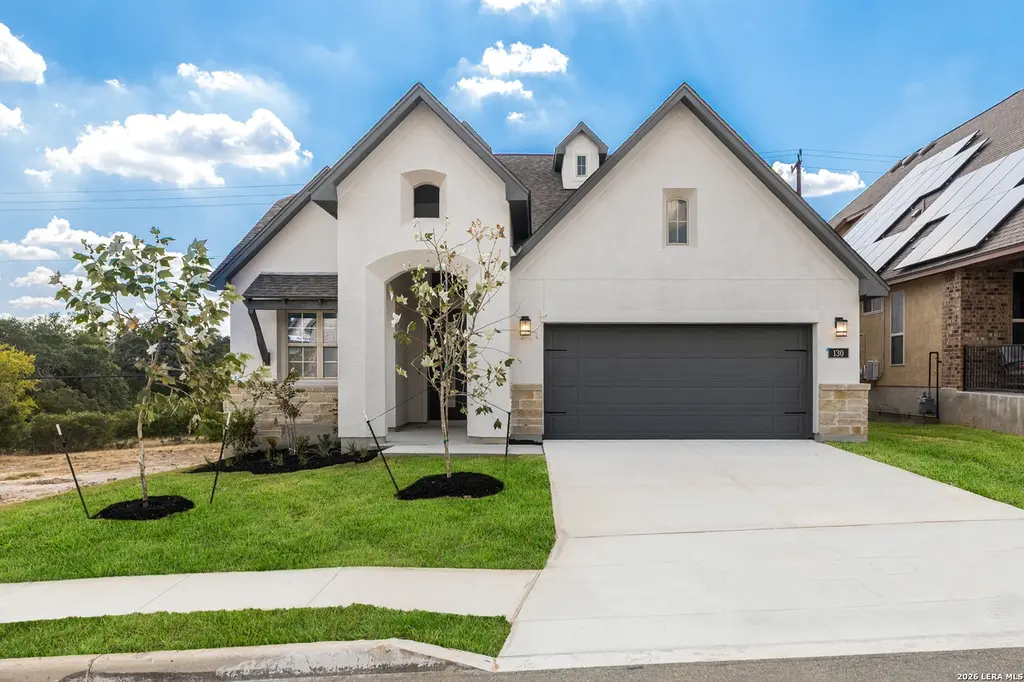
130 Gallant Fox · Castroville, TX
Flood risk No data
- FEMA flood zone
- —
- Chance of flooding over 30 yrs
- —
- Est. flood insurance / yr
- —
Fire risk No data
- Est. fire insurance / yr
- —
Heat risk No data
- Hot days now (above threshold)
- —
- Hot days in 30 yrs
- —
Wind risk No data
- Chance of severe wind over 30 yrs
- —
Air-quality risk No data
- Unhealthy air days now
- —
- Unhealthy air days in 30 yrs
- —
Risk factors via First Street. Map © Google.
Why this score? — see what drove the F grade
The composite is a weighted blend of 9 inputs, each scored 0–100. Each bar is that input's sub-score; the figure is the points it added to the 100-point composite (weight × sub-score).
- ARV discount +13.5/15.0
- Schools +4.4/10.0
- Livability +3.7/5.0
- Cash flow +3.5/30.0
- Rent growth +2.5/5.0
- Condition / age +2.5/5.0
- 1% rule +0.0/10.0
- DSCR +0.0/10.0
- Appreciation +0.0/10.0
$510,766
🖨 Deal sheet (PDF) 📄 Offer letter ✓ Due diligence
Listing remarks MLS
This stunning home offers 4 spacious bedrooms and 3 full bathrooms, designed for both comfort and style. Enjoy an open layout with sleek stainless-steel appliances, a versatile upstairs game room, and all bedrooms conveniently located downstairs. Step outside to a covered patio perfect for relaxing or entertaining, plus a 2-car garage for added convenience and storage. This gated neighborhood offers the charm of peaceful country living while keeping you just minutes from premier shopping, dining, entertainment, and major employment centers. Medina Valley ISD
Key facts
- Gated neighborhood
- Open layout
- Covered patio
Tags
Neighborhood map
What this means for you Summary
Snapshot
- This is a 4-bed/3.0-bath other listed at $511k.
Deal economics
- At list price, monthly cash flow is $-2k ($-19k/yr) — negative.
- To cash-flow at today's rent, offer at most $237k (53.6% below list).
- To meet the 1% rule (rent ≥ 1% of price), the offer needs to be $195k (61.7% below list).
- Recommended offer: $195k (61.7% below list) — sets the bar for 1% rule.
Location & tenants
- Location reads 73/100 on livability (#212 in TX) — a middle-class / working-renter tenant base. Strengths: cost of living A+, housing A+, crime B; Watch: health & safety D+, amenities F, commute F.
- Medina Valley ISD (rural): math 48% / reading 53% proficiency, ranked #148 of 826 in TX (top 18%) — acceptable for families but not a draw, mixed tenant base, ~2y average lease.
- Zoned schools: Potranco El (math 50% / reading 51%, grade D+, #833 of 4,322 statewide, top 20%, 847 students, 47% FRL); Medina Valley Middle (math 47% / reading 49%, grade C-, #400 of 1,662 statewide, top 24%, 1,029 students, 62% FRL); Medina Valley H S (math 34% / reading 55%, grade F, #652 of 1,632 statewide, top 43%, 2,147 students, 51% FRL) — zoned schools at 53% FRL track the district average.
- Market conditions: 440 active listings in the ZIP; 11 comparable units currently listed for rent nearby; rentals at typical pace (median 26d on market — plan ~3-4 weeks tenant-placement turnaround); 102 units permitted in Medina County in 2024 (0 in 5+ unit buildings).
Forward outlook
- Local home prices are declining (-3.0%/yr); year-one equity from $4k of loan paydown is wiped out by about $15k of value loss. Plan a longer hold.
- Medina County population projected at +24% by 2050 — long-run rental-demand tailwind backs the buy-and-hold thesis.
Negotiation context
- It's been on market 90 days — a 6% lower offer ($480k) is reasonable based on typical stale-listing flexibility.
- 2 sale attempts; this cycle's ask has dropped $30k (6%) from the opening price — seller is motivated, your offer sets the floor, not the list.
Questions for the listing agent
- What do current leases actually rent for vs. the listed asking? Can we see a recent rent roll and the last 12 months of T-12 income?
- It's been on market 90 days. Have you received any prior offers? Is the seller open to a 62% concession, seller financing, or rate buy-down credit?
- What does the HOA fee cover, when was the last increase, and are there any pending special assessments or reserve-fund shortfalls?
- Why hasn't it sold? Are there any deal-killer items the seller is aware of (foundation, flood, title, zoning, code violations)?
- Is there a deadline driving the sale (1031 exchange, divorce, estate, relocation)? That informs how much negotiation room exists.
- The area grade is low — what's the realistic commute time and amenity access for the typical tenant pool here? Any planned neighborhood developments (good or bad) we should know about?
- What's the average days-on-market for RENTAL listings here right now (not sales)? A rising rental-DOM trend means longer vacancies and softer asking-rent achievability than the comps imply.
- What's the recent tenant-quality profile in this submarket — average credit score on applications, eviction rate, late-payment / NSF rate, and stable-employment percentage? A property-management company in the area should have these aggregated.
- How much new for-sale + rental construction is in the pipeline within 1–3 miles? Heavy new supply typically softens prices + rents 12–24 months out; constrained supply supports both.
Investment metrics
- 1% rule
- 0.38% ✗
- Cap rate
- 2.65%
- Cash-on-cash
- -13.01%
- DSCR
- 0.42
- GRM
- 21.8
CMA / ARV
- ARV (median comp)
- $589,804
- List price
- $510,766
- Delta
- -13.40%
- Verdict
- UNDERPRICED
- Comps
- 20 within 1.0 mi
Projected returns pro-forma
-3.0% appreciation · 3.0% rent growth · sell at horizon
- IRR
- -40.7%
- Equity multiple
- -0.27×
- Total profit
- $-181,783
- Equity at exit
- $76,157
- IRR
- -67.1%
- Equity multiple
- -1.00×
- Total profit
- $-286,453
- Equity at exit
- $44,162
Cash invested: $143,014 (down + closing). Projections, not guarantees.
Landlord ↔ Tenant lean methodology
- Overall (STATE)
- 87 Strongly Landlord-Friendly
- State Texas
- 87 Strongly Landlord-Friendly · R+5
- County
- — inherits STATE
- City
- — inherits STATE
ZIP-level market 78009
- Home prices YoY
- -21.1%
- Active inventory
- 440
- Price-to-rent
- 21.8×
Monthly cashflow live
- Estimated rent
- $1,954 high interval (Pro) →
- Mortgage (P&I)
- −$2,679
- Tax from tax record
- −$140 /mo · $1,681/yr
- Insurance
- −$213
- HOA
- −$63
- Vacancy / Maint / Mgmt
- −$410
- Net cashflow
- $-1,551
Break-even live
Sensitivity live
| Price | -10% $-1,262 | -5% $-1,406 | +0% $-1,551 | +5% $-1,695 | +10% $-1,840 |
|---|---|---|---|---|---|
| Rent | -10% $-1,705 | -5% $-1,628 | +0% $-1,551 | +5% $-1,474 | +10% $-1,397 |
| Rate | -1.0pp $-1,294 | -0.5pp $-1,421 | base $-1,551 | +0.5pp $-1,683 | +1.0pp $-1,818 |
UW: 25.0% down · 7.5% · 30yr · 1.5% tax · 5.0% vac · 8.0% maint · 8.0% mgmt
Financing live
Cash to close
- Down payment
- $127,692
- Closing costs
- $15,323
- Reserves months
- —
- Total cash needed
- —
Loan-product check · same deal, 3 products live
Conventional
25% down · 7.5% · 30yr
- Down + closing
- —
- Monthly P&I
- —
- Monthly cashflow
- —
- DSCR
- —
- Eligible?
- —
Personal DTI + credit; lowest rate.
DSCR
20% down · 8.5% · 30yr
- Down + closing
- —
- Monthly P&I
- —
- Monthly cashflow
- —
- DSCR
- —
- Eligible?
- —
No personal income docs; deal must DSCR.
Hard money
10% down · 12.0% · 12mo
- Down + closing
- —
- Monthly P&I
- —
- Monthly cashflow
- —
- DSCR
- —
- Eligible?
- —
Short-term bridge; refi at stabilization.
Rent comps 11 comps
| Address | Beds | Baths | Sqft | Rent | $/sqft | DOM | Units | Dist |
|---|---|---|---|---|---|---|---|---|
| 270 Lilly Blf Castroville, TX | 4.0 | 3.0 | 2958 | $3,600 | $1.22 | 45d | 1 | 0.69mi |
| 186 Nespral Dr San Antonio, TX | 4.0 | 2.5 | 1676 | $1,650 | $0.98 | 25d | 1 | 1.40mi |
| 210 Nespral Dr San Antonio, TX | 3.0–4.0 | 2.0–2.5 | 1487 | $1,595 | $1.07 | 45d | 1 | 1.40mi |
| 153 Nespral Dr San Antonio, TX | 3.0 | 2.0 | 1484 | $1,595 | $1.07 | 25d | 1 | 1.43mi |
| 197 Nespral Dr Unit 197 Nespral San Antonio, TX | 4.0 | 2.5 | 1676 | $1,595 | $0.95 | 6d | 1 | 1.44mi |
| 209 Nespral Dr San Antonio, TX | 3.0 | 2.0 | 1484 | $1,595 | $1.07 | 25d | 1 | 1.44mi |
| 255 Nespral Dr Unit 259 San Antonio, TX | 4.0 | 2.5 | 1640 | $2,050 | $1.25 | 45d | 1 | 1.45mi |
| 339 Nespral Dr San Antonio, TX | 3.0 | 2.0 | 1484 | $1,595 | $1.07 | 6d | 1 | 1.47mi |
| 339 Nespral Dr San Antonio, TX | 3.0 | 2.0 | 1484 | $1,595 | $1.07 | 12d | 1 | 1.47mi |
| 335 Nespral Dr San Antonio, TX | 3.0 | 2.0 | 1484 | $1,595 | $1.07 | 25d | 1 | 1.48mi |
| 345 Nespral Dr , TX | 3.0 | 2.0 | 1484 | $1,595 | $1.07 | 6d | 1 | 1.48mi |
HOA detail
- Monthly dues
- $63 · $756/yr
- Likely covers
- security
Listing history 18 events
-
2026-06-21pricestatusdays on market $510,766 Price Change 90 DOM
-
2026-06-18days on market $540,888 Active 87 DOM
-
2026-06-17days on market $540,888 Active 86 DOM
-
2026-06-16days on market $540,888 Active 85 DOM
-
2026-06-15days on market $540,888 Active 84 DOM
-
2026-06-13days on market $540,888 Active 82 DOM
-
2026-06-09days on market $540,888 Active 78 DOM
-
2026-06-08days on market $540,888 Active 77 DOM
-
2026-06-07days on market $540,888 Active 76 DOM
-
2026-06-04days on market $540,888 Active 73 DOM
-
2026-06-03days on market $540,888 Active 72 DOM
-
2026-06-02days on market $540,888 Active 71 DOM
-
2026-06-02days on market $540,888 Active 70 DOM
-
2026-05-31days on market $540,888 Active 69 DOM
-
2026-03-23$540,888 New 564-char remark
Show marketing remark (564 chars)
This stunning home offers 4 spacious bedrooms and 3 full bathrooms, designed for both comfort and style. Enjoy an open layout with sleek stainless-steel appliances, a versatile upstairs game room, and all bedrooms conveniently located downstairs. Step outside to a covered patio perfect for relaxing or entertaining, plus a 2-car garage for added convenience and storage. This gated neighborhood offers the charm of peaceful country living while keeping you just minutes from premier shopping, dining, entertainment, and major employment centers. Medina Valley ISD
-
2026-03-11historical
-
2025-05-28price $540,088
-
2025-05-17$540,061 New
ⓘ Source: listings_history table (triggers on properties + properties_extension) + one-shot
backfill from property_details.listing_events for pre-trigger history.
Tax reassessment forecast TX · Resets to sale price
- Current annual tax
- $1,681 · $140/mo
- Projected year-2 tax
- $9,347 · $779/mo
- Expected delta
- +$7,666/yr (+$639/mo · 456.0%)
ⓘ Screening estimate from a state-policy table — verify with the county assessor before closing.
Nearby sold comps map
Loading sold comps map…
Walkable amenities ~0.75 mi
Loading nearby amenities…
Taxation est. · year 1
- Rental income
- $23,446
- − Mortgage interest
- −$28,611
- − Property taxes
- −$1,681
- − Insurance
- −$2,554
- − Repairs & maintenance
- −$1,876
- − Management
- −$1,876
- − HOA
- −$756
- − Depreciation
- −$14,859
- Taxable loss
- −$28,766
- Est. tax savings @ 24.0%
- +$6,904
- After-tax cash flow
- $-11,707/yr
For passive investors: Depreciation is non-cash, so a rental often shows a tax loss while cash-flowing — sheltering income. Rental losses are passive: they offset passive income freely, and up to $25,000/yr can offset ordinary (W-2) income if you actively participate and your MAGI is under $100k (phasing out to $0 by $150k); unused losses carry forward. On sale, claimed depreciation is recaptured at up to 25%, and gains may owe capital-gains tax (a 1031 exchange can defer both). Figures are a year-1 estimate at your 24.0% rate — not tax advice; consult a CPA.
Schools (NCES district)
- District
- Medina Valley ISD
- NCES district ID
- 4830060
- Math proficiency
- 48% ▼ -9.00%
- Reading proficiency
- 53% ▼ -2.00%
- Median HH income
- $60,596
- Composite
- 44.2/100
- National rank
- #2851
- State rank
- #148 of 826 in TX
Livability — Castroville
- Score
- 73/100
- State rank
- #212
- US rank
- #5267
Category grades
Schools grade is shown separately in the Schools card above.
Census & demographics
- Population (ZIP)
- 9,494
Population outlook (Medina County) Hauer SSP2
- Today (2025)
- 54,332 people
- By 2030
- 57,250 · +5.4%
- By 2040
- 62,563 · +15.1%
- By 2050
- 67,386 · +24.0%
- By 2075
- 79,538 · +46.4%
- By 2100
- 84,624 · +55.8%
Race, ethnicity, and origin ACS 2023
- Neighborhood character
- Diverse neighborhood (Simpson 0.60)
- Race & ethnicity
- Hispanic / Latino 52% White 37% Two or more races 29% Black 4% Asian 3% Native American 1%
- Hispanic origin (detail)
- Mexican 41% Puerto Rican 3%
- Common ancestry
- Albanian 6% Lithuanian 5% Slovak 2%
- Foreign-born
- 9% · Canada
- Languages at home
- 74% English-only · Spanish 24% Other Indo-European 1%
Political lean MEDSL · Medina
- 2024 margin
- Solid R (+42.8) · D 28.2% · R 71.0%
- 2008→2024 swing
- -8.9pp toward R · 2008: -33.9pp · 2024: -42.8pp
- All cycles
- 2024: R+42.8 2020: R+39.2 2016: R+43.2 2012: R+39.2 2008: R+33.9
Not yet ingested
- Civics
- —
Market trends
- HPI YoY
- ▼ -56.81%
- Current HPI
- 212.1813
- Rent YoY
- —
- Metro
- —
- State GDP YoY
- ▲ 3.95%
- F500 in state
- 110
Industry mix (Fortune 500 HQ in TX)
| Industry | F500 HQs | Revenue |
|---|---|---|
| Energy | 16 | $1,198B |
|
||
| Technology | 5 | $198B |
|
||
| Engineering / Construction | 4 | $72B |
|
||
| Energy Services | 3 | $60B |
|
||
| Utilities | 3 | $41B |
|
||
| Healthcare | 2 | $330B |
|
||
Price history
+0.2% since first listed4 events — show timeline
- 2026-03-23 Listed $540,888 LERA
- 2026-03-11 Listing Removed — LERA
- 2025-05-28 Price Changed $540,088 LERA
- 2025-05-17 Listed $540,061 LERA
Property tax history
+182.4%/yrLatest (2025): $1,681 · +360.5% YoY. Source: county tax records.
Cash-flow waterfall
monthlySold comps — $/sqft
last 12 mo · ≤1 miLoading sold comps…