 🏗️ New Construction
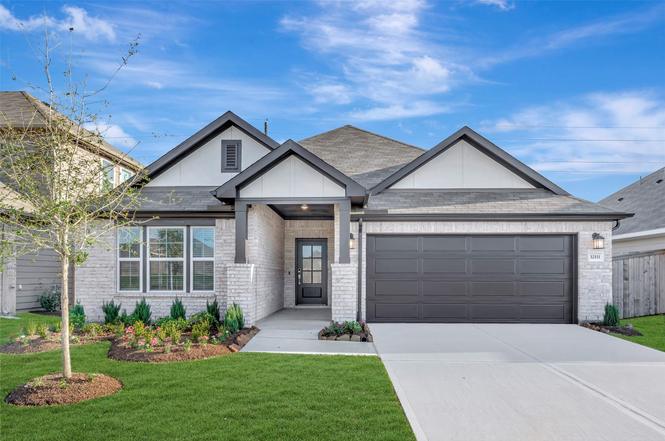
32111 Morning Luster Ct · Fulshear, TX
Flood risk No data
- FEMA flood zone
- —
- Chance of flooding over 30 yrs
- —
- Est. flood insurance / yr
- —
Fire risk No data
- Est. fire insurance / yr
- —
Heat risk No data
- Hot days now (above threshold)
- —
- Hot days in 30 yrs
- —
Wind risk No data
- Chance of severe wind over 30 yrs
- —
Air-quality risk No data
- Unhealthy air days now
- —
- Unhealthy air days in 30 yrs
- —
Risk factors via First Street. Map © Google.
Why this score? — see what drove the D+ grade
The composite is a weighted blend of 9 inputs, each scored 0–100. Each bar is that input's sub-score; the figure is the points it added to the 100-point composite (weight × sub-score).
- Cash flow +16.9/30.0
- ARV discount +7.5/15.0
- DSCR +5.3/10.0
- 1% rule +4.8/10.0
- Schools +4.6/10.0
- Livability +3.5/5.0
- Condition / age +2.5/5.0
- Rent growth +2.1/5.0
- Appreciation +0.0/10.0
$354,990
🖨 Deal sheet 📄 Offer letter ✓ Due diligence
Listing remarks
READY NOW! Welcome to the Esperanza, a beautifully designed single-story home offering 4 bedrooms, 2 bathrooms, and a thoughtfully planned living space. From the inviting covered porch to the open-concept layout, this home blends comfort, flexibility, and style. Step inside to a spacious foyer that leads to an open family room, dining area, and kitchen with a sloped ceiling that adds an airy feel. The kitchen features a large island, abundant counter space, and a walk-in pantry, making it ideal for cooking and entertaining. The owner’s suite sits in its own private corner of the home and includes a luxurious bath with dual vanities, a walk-in shower, and a generous walk-in closet. Th
Key facts
- Covered porch
- Private corner
- Large island
Tags
Property features AI
Finance
- Other: Builder: M/I Homes; Full ownership
- HOA & community: Community managed by King Property Management; Annual association fee
Exterior
- Parking: Attached garage (2 spaces)
- Security: Owned security system
- Utilities: Public sewer
- Home design: Residential property; New construction; Faces north; Slab foundation
- Construction: Brick construction; Composition roof; Built in 2025
- Exterior features: Covered patio; Patio; Deck; Fence (back yard); Located in a subdivision; Cul-de-sac lot
Interior
- Kitchen: Dishwasher; Disposal; Gas oven; Gas range; Microwave
- Bedrooms: Primary bedroom on first floor (12 x 19); Bedroom on first floor (12 x 13); Bedroom on first floor (12 x 10); Bedroom on first floor (11 x 10); Dining room on first floor (11 x 11); Family room on first floor (15 x 22)
- Flooring: Vinyl
- Bathrooms: 2 full bathrooms
- Heating & cooling: Central heating (gas); Central electric air conditioning; Has heating; Has cooling
- Interior features: Double vanity; Kitchen island; Kitchen and family room combined; Pantry; Soaking tub; Separate shower; Tub/shower combo; Ceiling fans; Kitchen and dining combined; Programmable thermostat
- Laundry & utility: Programmable thermostat (HVAC control)
Neighborhood map
What this means for you Summary
Snapshot
- This is a 4-bed/3.0-bath single-family listed at $355k.
Deal economics
- At list price, monthly cash flow is $212 ($3k/yr) — positive.
- To cash-flow at today's rent, offer at most $353k (0.7% below list).
- To meet the 1% rule (rent ≥ 1% of price), the offer needs to be $316k (10.9% below list).
- Recommended offer: $316k (10.9% below list) — sets the bar for 1% rule.
- Cap rate 7.1% vs local median 3.2% in Fulshear — top-decile yield for the area; either an underpriced asset or a hidden risk that comps aren't pricing in. Stress-test before assuming the spread holds.
Location & tenants
- Location reads 69/100 on livability (#430 in TX) — a middle-class / working-renter tenant base. Strengths: crime A+, employment A+, housing A+; Watch: amenities F, commute F, cost of living F.
- Lamar CISD (suburban): math 50% / reading 53% proficiency, ranked #116 of 826 in TX (top 14%) — acceptable for families but not a draw, mixed tenant base, ~2y average lease.
- Zoned schools: Dean Leaman J H School (math 59% / reading 56%, grade B, #206 of 1,662 statewide, top 13%, 2,191 students, 32% FRL); Fulshear H S (math 52% / reading 70%, grade C+, #258 of 1,632 statewide, top 16%, 2,464 students, 30% FRL).
- Market conditions: Rents soft (-1.6%/yr); 1213 active listings in the ZIP; 6 comparable units currently listed for rent nearby; rentals at typical pace (median 22d on market — plan ~3-4 weeks tenant-placement turnaround); high-income renter base; 12,093 units permitted in Fort Bend County in 2024 (815 in 5+ unit buildings).
Forward outlook
- Local home prices are declining (-3.0%/yr); year-one equity from $2k of loan paydown is wiped out by about $10k of value loss. Plan a longer hold.
- Fort Bend County population projected at +75% by 2050 — long-run rental-demand tailwind backs the buy-and-hold thesis.
Negotiation context
- It's been on market 97 days — a 9% lower offer ($323k) is reasonable based on typical stale-listing flexibility.
- 2 sale attempts; this cycle's ask has dropped $42k (11%) from the opening price — seller is motivated, your offer sets the floor, not the list.
Questions for the listing agent
- It's been on market 97 days. Have you received any prior offers? Is the seller open to a 11% concession, seller financing, or rate buy-down credit?
- What does the HOA fee cover, when was the last increase, and are there any pending special assessments or reserve-fund shortfalls?
- Why hasn't it sold? Are there any deal-killer items the seller is aware of (foundation, flood, title, zoning, code violations)?
- Is there a deadline driving the sale (1031 exchange, divorce, estate, relocation)? That informs how much negotiation room exists.
- Schools are A-rated — typically a magnet for longer-tenancy family renters. What's the average tenant stay here, and is there a school-zone premium baked into asking?
- The area grade is low — what's the realistic commute time and amenity access for the typical tenant pool here? Any planned neighborhood developments (good or bad) we should know about?
- What's the average days-on-market for RENTAL listings here right now (not sales)? A rising rental-DOM trend means longer vacancies and softer asking-rent achievability than the comps imply.
- What's the recent tenant-quality profile in this submarket — average credit score on applications, eviction rate, late-payment / NSF rate, and stable-employment percentage? A property-management company in the area should have these aggregated.
- How much new for-sale + rental construction is in the pipeline within 1–3 miles? Heavy new supply typically softens prices + rents 12–24 months out; constrained supply supports both.
Investment metrics
- 1% rule
- 0.98% ✗
- Cap rate
- 7.08%
- Cash-on-cash
- 2.82%
- DSCR
- 1.13
- GRM
- 8.5
CMA / ARV
- ARV (on-the-fly)
- $321,900
- Comps found
- 12
Show comp detail 12 sales within ~0.75 mi
| Address | Dist | Beds/Ba | Sqft | Sold | Price | $/sf | Match |
|---|---|---|---|---|---|---|---|
| 32107 Morning Luster Ct | 0.01mi | 4/3.0 | 2,402 (+12%) | 1mo | $369,990 | $154 | 79 |
| 32407 Sunbeam Dr | 0.18mi | 4/3.0 | 2,353 (+10%) | 2mo | $352,990 | $150 | 74 |
| 32503 Midsummer Dr | 0.21mi | 4/2.5 | 2,342 (+9%) | 1mo | $324,990 | $139 | 72 |
| 32511 Midsummer Dr | 0.22mi | 4/2.5 | 2,342 (+9%) | 1mo | $350,990 | $150 | 72 |
| 32455 Sunbeam Dr | 0.21mi | 4/2.5 | 2,342 (+9%) | 2mo | $329,990 | $141 | 71 |
| 32447 Sunbeam Dr | 0.21mi | 4/2.5 | 2,342 (+9%) | 2mo | $326,990 | $140 | 71 |
| 32215 Sunbeam Dr | 0.15mi | 4/3.0 | 2,417 (+13%) | 1mo | $364,990 | $151 | 71 |
| 5711 Sunland Trl | 0.18mi | 4/3.0 | 2,402 (+12%) | 1mo | $391,990 | $163 | 71 |
| 32415 Sunbeam Dr | 0.18mi | 4/2.5 | 2,342 (+9%) | 4mo | $320,990 | $137 | 70 |
| 32439 Sunbeam Dr | 0.20mi | 4/3.0 | 2,386 (+11%) | 6mo | $362,990 | $152 | 67 |
| 5727 Daylight Cv | 0.22mi | 4/3.0 | 2,412 (+12%) | 3mo | $310,000 | $129 | 67 |
| 31423 Splitting Willow Way | 0.71mi | 4/3.0 | 2,242 (+4%) | 1mo | $349,999 | $156 | 59 |
Match score weights: distance 35% · size 25% · config 20% · recency 20%. Top-matched comps best support the ARV.
Projected returns pro-forma
-3.0% appreciation · 0.0% rent growth · sell at horizon
- IRR
- -15.3%
- Equity multiple
- 0.47×
- Total profit
- $-47,834
- Equity at exit
- $47,996
- IRR
- -13.2%
- Equity multiple
- 0.34×
- Total profit
- $-59,721
- Equity at exit
- $27,832
Cash invested: $90,132 (down + closing). Projections, not guarantees.
Landlord ↔ Tenant lean methodology
- Overall (STATE)
- 87 Strongly Landlord-Friendly
- State Texas
- 87 Strongly Landlord-Friendly · R+5
- County
- — inherits STATE
- City
- — inherits STATE
ZIP-level market 77441
- Rents YoY
- -1.6%
- Active inventory
- 1213
- Price-to-rent
- 9.4×
Monthly cashflow live
- Estimated rent
- $3,162 high interval (Pro) →
- Mortgage (P&I)
- −$1,688
- Tax est. 1.5%
- −$402 /mo · $4,828/yr
- Insurance
- −$134
- HOA
- −$61
- Vacancy / Maint / Mgmt
- −$664
- Net cashflow
- $212
Break-even live
UW: 25.0% down · 7.5% · 30yr · 1.5% tax · 5.0% vac · 8.0% maint · 8.0% mgmt
Financing live
Cash to close
- Down payment
- $80,475
- Closing costs
- $9,657
- Reserves months
- —
- Total cash needed
- —
Loan-product check · same deal, 3 products live
Conventional
25% down · 7.5% · 30yr
- Down + closing
- —
- Monthly P&I
- —
- Monthly cashflow
- —
- DSCR
- —
- Eligible?
- —
Personal DTI + credit; lowest rate.
DSCR
20% down · 8.5% · 30yr
- Down + closing
- —
- Monthly P&I
- —
- Monthly cashflow
- —
- DSCR
- —
- Eligible?
- —
No personal income docs; deal must DSCR.
Hard money
10% down · 12.0% · 12mo
- Down + closing
- —
- Monthly P&I
- —
- Monthly cashflow
- —
- DSCR
- —
- Eligible?
- —
Short-term bridge; refi at stabilization.
Rent comps 6 comps
| Address | Beds | Baths | Sqft | Rent | $/sqft | DOM | Units | Dist |
|---|---|---|---|---|---|---|---|---|
| 5462 Grand View Dr Unit 1568482P Pattison, TX | 5.0 | 3.5 | 2992 | $3,637 | $1.22 | 1d | 1 | 0.50mi |
| 7302 New Pecan Dr Fulshear, TX | 4.0 | 4.0 | 2844 | $3,299 | $1.16 | 43d | 1 | 0.82mi |
| 5222 Wyatt James Ln Brookshire, TX | 4.0 | 2.5 | 2487 | $3,250 | $1.31 | 12d | 1 | 0.93mi |
| 31043 Vintage Creek Ln Fulshear, TX | 4.0 | 3.5 | 2800 | $3,300 | $1.18 | 22d | 1 | 1.12mi |
| 31123 Brightwell Bnd Fulshear, TX | 4.0 | 3.0 | 2400 | $2,400 | $1.00 | 12d | 1 | 1.30mi |
| 31419 Horseshoe Meadow Bend Ln Fulshear, TX | 3.0 | 2.0 | 1588 | $2,100 | $1.32 | 43d | 1 | 1.36mi |
HOA detail
- Monthly dues
- $61 · $732/yr
Listing history 8 events
-
2026-04-27status Pending
-
2026-04-20price $354,990
-
2026-04-13price $359,990
-
2026-03-02price $367,990
-
2026-02-25status Active
-
2026-01-28historical
-
2026-01-07price $373,990
-
2025-12-23$396,990 Active
ⓘ Source: listings_history table (triggers on properties + properties_extension) + one-shot
backfill from property_details.listing_events for pre-trigger history.
Nearby sold comps map
Loading sold comps map…
Walkable amenities ~0.75 mi
Loading nearby amenities…
Taxation est. · year 1
- Rental income
- $37,939
- − Mortgage interest
- −$18,031
- − Property taxes
- −$4,828
- − Insurance
- −$1,610
- − Repairs & maintenance
- −$3,035
- − Management
- −$3,035
- − HOA
- −$732
- − Depreciation
- −$9,364
- Taxable loss
- −$2,697
- Est. tax savings @ 24.0%
- +$647
- After-tax cash flow
- $3,192/yr
For passive investors: Depreciation is non-cash, so a rental often shows a tax loss while cash-flowing — sheltering income. Rental losses are passive: they offset passive income freely, and up to $25,000/yr can offset ordinary (W-2) income if you actively participate and your MAGI is under $100k (phasing out to $0 by $150k); unused losses carry forward. On sale, claimed depreciation is recaptured at up to 25%, and gains may owe capital-gains tax (a 1031 exchange can defer both). Figures are a year-1 estimate at your 24.0% rate — not tax advice; consult a CPA.
Schools (NCES district)
- District
- Lamar CISD
- NCES district ID
- 4826580
- Math proficiency
- 50% ▼ -12.00%
- Reading proficiency
- 53% ▼ -4.00%
- Median HH income
- $75,213
- Composite
- 46.43/100
- National rank
- #2452
- State rank
- #116 of 826 in TX
Livability — Fulshear
- Score
- 69/100
- State rank
- #430
- US rank
- #8901
Category grades
Schools grade is shown separately in the Schools card above.
Census & demographics
- County
- Fort Bend County · 836,777 people
- City population
- 41,324
- Metro
- Houston-The Woodlands-Sugar Land, TX
- Population (ZIP)
- 41,324
- Household income
- $184,390
- Rent vs Own
- Severe rent burden
- 301.0
Population outlook (Fort Bend County) Hauer SSP2
- Today (2025)
- 1,004,526 people
- By 2030
- 1,153,104 · +14.8%
- By 2040
- 1,453,718 · +44.7%
- By 2050
- 1,753,781 · +74.6%
- By 2075
- 2,455,772 · +144.5%
- By 2100
- 2,930,528 · +191.7%
Race, ethnicity, and origin ACS 2023
- Neighborhood character
- Diverse neighborhood (Simpson 0.62)
- Race & ethnicity
- White 57% Hispanic / Latino 20% Two or more races 15% Asian 12% Black 6%
- Hispanic origin (detail)
- Mexican 10%
- Common ancestry
- Lithuanian 5% Romanian 2% Italian 1%
- Foreign-born
- 26% · Canada, China, Jamaica
- Languages at home
- 68% English-only · Spanish 17% German/W. Germanic 4% Chinese 4%
Political lean MEDSL · Fort Bend
- 2024 margin
- Toss-up / Even · D 49.5% · R 47.9% · Other 2.6%
- 2008→2024 swing
- +4.0pp toward D · 2008: -2.4pp · 2024: 1.6pp
- All cycles
- 2024: D+1.6 2020: D+10.6 2016: D+6.6 2012: R+6.8 2008: R+2.4
Not yet ingested
- Civics
- —
Market trends
- HPI YoY
- ▼ -154.74%
- Current HPI
- 275.8798
- Rent YoY
- ▼ -1.63%
- Metro
- Houston-The Woodlands-Sugar Land, TX
- State GDP YoY
- ▲ 3.95%
- F500 in state
- 110
Industry mix (Fortune 500 HQ in TX)
| Industry | F500 HQs | Revenue |
|---|---|---|
| Energy | 16 | $1,198B |
|
||
| Technology | 5 | $198B |
|
||
| Engineering / Construction | 4 | $72B |
|
||
| Energy Services | 3 | $60B |
|
||
| Utilities | 3 | $41B |
|
||
| Healthcare | 2 | $330B |
|
||
Price history
-10.6% since first listed8 events — show timeline
- 2026-04-27 Pending — HARMLS
- 2026-04-20 Price Changed $354,990 HARMLS
- 2026-04-13 Price Changed $359,990 HARMLS
- 2026-03-02 Price Changed $367,990 HARMLS
- 2026-02-25 Relisted — HARMLS
- 2026-01-28 Listing Removed — HARMLS
- 2026-01-07 Price Changed $373,990 HARMLS
- 2025-12-23 Listed $396,990 HARMLS
Cash-flow waterfall
monthlySold comps — $/sqft
last 12 mo · ≤1 miLoading sold comps…