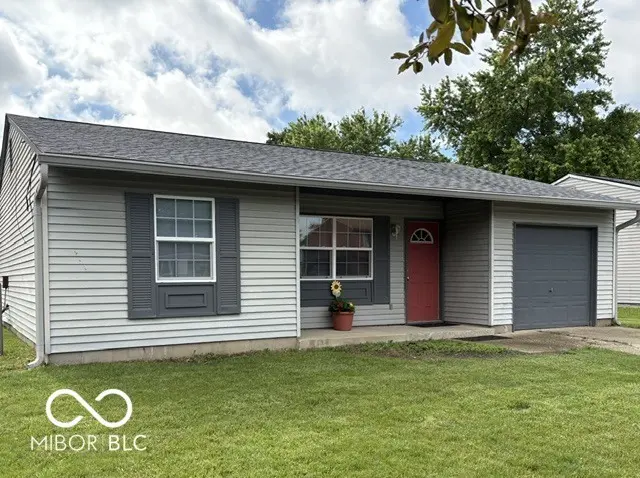
5120 Pappas Dr · Indianapolis city (balance), IN
Flood risk 1/10 · Minimal
- FEMA flood zone
- X (unshaded)
- Chance of flooding over 30 yrs
- 0.0%
- Est. flood insurance / yr
- $507 – $1,088
Fire risk 1/10 · Minimal
- Est. fire insurance / yr
- $717 – $1,331
Heat risk 4/10 · Minor
- Hot days now (above 102°F)
- 7 days/yr
- Hot days in 30 yrs
- 19 days/yr
Wind risk 2/10 · Minimal
- Chance of severe wind over 30 yrs
- 1.0%
Air-quality risk 3/10 · Minor
- Unhealthy air days now
- 2 days/yr
- Unhealthy air days in 30 yrs
- 3 days/yr
Risk factors via First Street. Map © Google.
Why this score? — see what drove the D- grade
The composite is a weighted blend of 9 inputs, each scored 0–100. Each bar is that input's sub-score; the figure is the points it added to the 100-point composite (weight × sub-score).
- Cash flow +12.7/30.0
- Schools +4.0/10.0
- DSCR +3.8/10.0
- 1% rule +3.6/10.0
- Rent growth +3.4/5.0
- ARV discount +2.6/15.0
- Livability +2.5/5.0
- Condition / age +2.5/5.0
- Appreciation +0.0/10.0
$199,900
🖨 Deal sheet 📄 Offer letter ✓ Due diligence
Listing remarks
Delightfully updated, Move-in ready, Total electric 3 Bedroom home in popular Franklin Township. Updates galore including New Roof, New Windows, New Furnace and Central Air, New Carpet and Vinyl Plank Floors, New Interior Paint, Kitchen features New Electric Range and Refinished Cabinets, newer gutters & more! Super family friendly fenced back yard with mini barn for additional storage. Seller to provide landscaping allowance and Home Warranty at closing.
Key facts
- New furnace
- New carpet
- Vinyl plank floors
Tags
Property features AI
Exterior
- Parking: Attached garage (1 car)
- Utilities: Public water; Municipal sewer connected; Municipal solid waste service
- Home design: Single-family residence; One story
- Construction: Aluminum siding; Slab foundation
- Exterior features: Mini barn; Curbs and sidewalks
Interior
- Kitchen: Dishwasher; Disposal; Electric oven; Range hood; Refrigerator
- Bedrooms: 3 bedrooms on the main level
- Bathrooms: 1 full bathroom on the main level
- Heating & cooling: Forced air heating; Central air conditioning
- Interior features: Attic access; Woodwork stained/painted; Utility room
- Laundry & utility: Main-level laundry room
Neighborhood map
What this means for you Summary
Snapshot
- This is a 3-bed/1.5-bath single-family listed at $200k.
Deal economics
- At list price, monthly cash flow is $-21 ($-256/yr) — negative.
- To cash-flow at today's rent, offer at most $196k (1.9% below list).
- To meet the 1% rule (rent ≥ 1% of price), the offer needs to be $173k (13.6% below list).
- Recommended offer: $173k (13.6% below list) — sets the bar for 1% rule.
- Cap rate 6.2% vs local median 4.4% in Indianapolis city (balance) — top-decile yield for the area; either an underpriced asset or a hidden risk that comps aren't pricing in. Stress-test before assuming the spread holds.
Location & tenants
- Location reads: area grade D — affects rentability + tenant quality, not the cash-flow math above.
- Franklin Township Community School Corporation (urban): math 42% / reading 47% proficiency, ranked #87 of 301 in IN (top 29%) — families likely to look elsewhere, expect single-tenant / working-renter base with shorter leases.
- Market conditions: Rents rising (+3.8%/yr); 261 active listings in the ZIP; 9 comparable units currently listed for rent nearby; rentals leasing fast (median 3d on market — plan ~1-2 weeks tenant-placement turnaround); solid renter incomes; 1,906 units permitted in Marion County in 2024 (621 in 5+ unit buildings).
Forward outlook
- Local home prices are declining (-3.0%/yr); year-one equity from $1k of loan paydown is wiped out by about $6k of value loss. Plan a longer hold.
- Marion County population projected at +18% by 2050 — long-run rental-demand tailwind backs the buy-and-hold thesis.
Negotiation context
- It's been on market 21 days — a 2% lower offer ($197k) is reasonable based on typical stale-listing flexibility.
- 4 sale attempts since 19y ago with the ask held roughly flat each time — persistent listings suggest the price (not the market) is what's stuck; bring a comps-based counter.
Questions for the listing agent
- What do current leases actually rent for vs. the listed asking? Can we see a recent rent roll and the last 12 months of T-12 income?
- Is there a deadline driving the sale (1031 exchange, divorce, estate, relocation)? That informs how much negotiation room exists.
- The area grade is low — what's the realistic commute time and amenity access for the typical tenant pool here? Any planned neighborhood developments (good or bad) we should know about?
- What's the average days-on-market for RENTAL listings here right now (not sales)? A rising rental-DOM trend means longer vacancies and softer asking-rent achievability than the comps imply.
- What's the recent tenant-quality profile in this submarket — average credit score on applications, eviction rate, late-payment / NSF rate, and stable-employment percentage? A property-management company in the area should have these aggregated.
- How much new for-sale + rental construction is in the pipeline within 1–3 miles? Heavy new supply typically softens prices + rents 12–24 months out; constrained supply supports both.
Investment metrics
- 1% rule
- 0.86% ✗
- Cap rate
- 6.16%
- Cash-on-cash
- -0.46%
- DSCR
- 0.98
- GRM
- 9.7
CMA / ARV
- ARV (on-the-fly)
- $180,320
- Comps found
- 12
Show comp detail 12 sales within ~0.75 mi
| Address | Dist | Beds/Ba | Sqft | Sold | Price | $/sf | Match |
|---|---|---|---|---|---|---|---|
| 5179 Laredo St | 0.07mi | 3/1.0 | 912 (-1%) | 1mo | $184,300 | $202 | 93 |
| 5117 Bahia Dr | 0.13mi | 3/1.5 | 910 (-1%) | 12mo | $215,000 | $236 | 82 |
| 5249 Straw Hat Dr | 0.33mi | 3/1.0 | 936 (+2%) | 4mo | $157,000 | $168 | 77 |
| 5427 Straw Hat Dr | 0.35mi | 3/1.5 | 936 (+2%) | 6mo | $179,500 | $192 | 76 |
| 5338 Straw Hat Ct | 0.41mi | 3/1.0 | 936 (+2%) | 4mo | $183,000 | $196 | 73 |
| 5334 Straw Hat Ct | 0.42mi | 3/1.5 | 960 (+4%) | 2mo | $184,900 | $193 | 72 |
| 5416 Straw Hat Dr | 0.35mi | 3/1.5 | 936 (+2%) | 12mo | $207,900 | $222 | 70 |
| 5147 Antigua Trl | 0.09mi | 3/1.0 | 1,056 (+15%) | 1mo | $195,000 | $185 | 68 |
| 5855 La Fleur Ct | 0.28mi | 3/1.0 | 1,014 (+10%) | 13mo | $213,000 | $210 | 57 |
| 5404 Yucatan Dr | 0.24mi | 3/1.5 | 1,056 (+15%) | 9mo | $218,000 | $206 | 56 |
| 5326 Brazos Dr | 0.53mi | 2/1.0 (-1) | 980 (+6%) | 12mo | $190,000 | $194 | 47 |
| 5737 Misty Ridge Cir | 0.62mi | 2/1.0 (-1) | 1,018 (+11%) | 13mo | $188,000 | $185 | 35 |
Match score weights: distance 35% · size 25% · config 20% · recency 20%. Top-matched comps best support the ARV.
Projected returns pro-forma
-3.0% appreciation · 3.78% rent growth · sell at horizon
- IRR
- -16.2%
- Equity multiple
- 0.42×
- Total profit
- $-32,360
- Equity at exit
- $29,806
- IRR
- -6.5%
- Equity multiple
- 0.57×
- Total profit
- $-24,125
- Equity at exit
- $17,284
Cash invested: $55,972 (down + closing). Projections, not guarantees.
Landlord ↔ Tenant lean methodology
- Overall (STATE)
- 90 Strongly Landlord-Friendly
- State Indiana
- 90 Strongly Landlord-Friendly · R+11
- County
- — inherits STATE
- City
- — inherits STATE
ZIP-level market 46237
- Rents YoY
- 3.8%
- Active inventory
- 261
- Price-to-rent
- 9.7×
Monthly cashflow live
- Estimated rent
- $1,726 high interval (Pro) →
- Mortgage (P&I)
- −$1,048
- Tax from tax record
- −$253 /mo · $3,042/yr
- Insurance
- −$83
- HOA
- −$0
- Vacancy / Maint / Mgmt
- −$362
- Net cashflow
- $-21
Break-even live
UW: 25.0% down · 7.5% · 30yr · 1.5% tax · 5.0% vac · 8.0% maint · 8.0% mgmt
Financing live
Cash to close
- Down payment
- $49,975
- Closing costs
- $5,997
- Reserves months
- —
- Total cash needed
- —
Loan-product check · same deal, 3 products live
Conventional
25% down · 7.5% · 30yr
- Down + closing
- —
- Monthly P&I
- —
- Monthly cashflow
- —
- DSCR
- —
- Eligible?
- —
Personal DTI + credit; lowest rate.
DSCR
20% down · 8.5% · 30yr
- Down + closing
- —
- Monthly P&I
- —
- Monthly cashflow
- —
- DSCR
- —
- Eligible?
- —
No personal income docs; deal must DSCR.
Hard money
10% down · 12.0% · 12mo
- Down + closing
- —
- Monthly P&I
- —
- Monthly cashflow
- —
- DSCR
- —
- Eligible?
- —
Short-term bridge; refi at stabilization.
Rent comps 9 comps
| Address | Beds | Baths | Sqft | Rent | $/sqft | DOM | Units | Dist |
|---|---|---|---|---|---|---|---|---|
| 5334 Padre Ln Indianapolis, IN | 3.0 | 1.5 | 1016 | $1,695 | $1.67 | 15d | 1 | 0.29mi |
| 4901 S Emerson Ave Indianapolis, IN | 1.0–4.0 | 1.0–2.0 | 998 | $1,712 | $1.71 | 2d | 10 | 0.50mi |
| 5140 Emerson Village Pl Indianapolis, IN | 1.0–2.0 | 1.0–2.0 | 805 | $1,360 | $1.69 | 2d | 16 | 0.57mi |
| 416 Ada Ln Beech Grove, IN | 3.0 | 2.0 | 1043 | $1,661 | $1.59 | 2d | 1 | 1.13mi |
| 240 Grovewood Pl Unit 228 Beech Grove, IN | 2.0 | 1.0 | 900 | $1,110 | $1.23 | 22d | 1 | 1.23mi |
| 240 Grovewood Pl Unit 228 Beech Grove, IN | 2.0 | 1.0 | 900 | $1,215 | $1.35 | 44d | 1 | 1.23mi |
| 4880 Willow Glen Dr Beech Grove, IN | 1.0–3.0 | 1.0–1.5 | 971 | $1,695 | $1.75 | 2d | 34 | 1.33mi |
| 6543 E Hanna Ave Indianapolis, IN | 2.0–4.0 | 2.0 | 1452 | $1,479 | $1.02 | 12d | 1 | 1.45mi |
| 4649 Strawbridge St Indianapolis, IN | 2.0–3.0 | 1.0–1.5 | 983 | $1,175 | $1.19 | 2d | 11 | 1.48mi |
Listing history 22 events
-
2026-06-18days on market $199,900 Active 21 DOM
-
2026-06-17days on market $199,900 Active 20 DOM
-
2026-06-16days on market $199,900 Active 19 DOM
-
2026-06-15days on market $199,900 Active 18 DOM
-
2026-06-13days on market $199,900 Active 16 DOM
-
2026-06-09days on market $199,900 Active 12 DOM
-
2026-06-08days on market $199,900 Active 11 DOM
-
2026-06-07days on market $199,900 Active 10 DOM
-
2026-06-03days on market $199,900 Active 6 DOM
-
2026-06-02days on market $199,900 Active 5 DOM
-
2026-06-01days on market $199,900 Active 4 DOM
-
2026-05-31days on market $199,900 Active 3 DOM
-
2026-05-28$199,900 Active
-
2026-03-17historical
-
2026-02-26price $194,900
-
2026-01-13price $199,900
-
2026-01-13status Active
-
2025-12-08historical
-
2025-12-01price $189,900
-
2025-11-18$199,900 Active
-
2007-07-20historical
-
2007-01-24$74,900
ⓘ Source: listings_history table (triggers on properties + properties_extension) + one-shot
backfill from property_details.listing_events for pre-trigger history.
Tax reassessment forecast IN · Partial reset (capped growth)
- Current annual tax
- $3,042 · $253/mo
- Projected year-2 tax
- $3,042 · $253/mo
- Expected delta
- $0/yr ($0/mo · 0.0%)
ⓘ Screening estimate from a state-policy table — verify with the county assessor before closing.
Climate risk First Street
- Flood 1/10 Low FEMA zone X (unshaded) · 0% chance over 30 yrs
- Wildfire 1/10 Low
- Heat 4/10 Moderate 7 d/yr ≥102°F today · 19 d/yr by 30 yrs out
- Wind 2/10 Low 100% chance of damaging wind over 30 yrs
- Air quality 3/10 Moderate 2 unhealthy d/yr today · 3 by 30 yrs out
Nearby sold comps map
Loading sold comps map…
Walkable amenities ~0.75 mi
Loading nearby amenities…
Taxation est. · year 1
- Rental income
- $20,714
- − Mortgage interest
- −$11,198
- − Property taxes
- −$3,042
- − Insurance
- −$1,000
- − Repairs & maintenance
- −$1,657
- − Management
- −$1,657
- − Depreciation
- −$5,815
- Taxable loss
- −$3,654
- Est. tax savings @ 24.0%
- +$877
- After-tax cash flow
- $620/yr
For passive investors: Depreciation is non-cash, so a rental often shows a tax loss while cash-flowing — sheltering income. Rental losses are passive: they offset passive income freely, and up to $25,000/yr can offset ordinary (W-2) income if you actively participate and your MAGI is under $100k (phasing out to $0 by $150k); unused losses carry forward. On sale, claimed depreciation is recaptured at up to 25%, and gains may owe capital-gains tax (a 1031 exchange can defer both). Figures are a year-1 estimate at your 24.0% rate — not tax advice; consult a CPA.
Schools (NCES district)
- District
- Franklin Township Community School Corporation
- NCES district ID
- 1803750
- Math proficiency
- 42% ▼ -12.00%
- Reading proficiency
- 47% ▼ -6.00%
- Median HH income
- $67,825
- Composite
- 39.91/100
- National rank
- #3852
- State rank
- #87 of 301 in IN
Livability — Indianapolis city (balance)
No livability data for this city. (Only ~50 U.S. cities are tracked.)
Census & demographics
- Census place
- Indianapolis city (balance), IN
- County
- Marion County · 998,460 people
- City population
- 881,119
- Metro
- Indianapolis-Carmel-Anderson, IN
- Population (ZIP)
- 43,473
- Household income
- $79,078
- Rent vs Own
- Severe rent burden
- 1245.0
Population outlook (Marion County) Hauer SSP2
- Today (2025)
- 1,025,572 people
- By 2030
- 1,065,727 · +3.9%
- By 2040
- 1,141,577 · +11.3%
- By 2050
- 1,208,920 · +17.9%
- By 2075
- 1,367,288 · +33.3%
- By 2100
- 1,438,201 · +40.2%
Race, ethnicity, and origin ACS 2023
- Neighborhood character
- Predominantly White (71%)
- Race & ethnicity
- White 71% Asian 13% Hispanic / Latino 7% Two or more races 6% Black 5%
- Hispanic origin (detail)
- Mexican 6%
- Common ancestry
- Italian 2% Lithuanian 2% Romanian 2%
- Foreign-born
- 12% · Canada, Philippines
- Languages at home
- 84% English-only · Other Asian/Pacific 5% Spanish 5% Other Indo-European 4%
Political lean MEDSL · Marion
- 2024 margin
- Strong D (+27.7) · D 63.0% · R 35.3% · Other 1.7%
- 2008→2024 swing
- -0.7pp no change · 2008: 28.4pp · 2024: 27.7pp
- All cycles
- 2024: D+27.7 2020: D+29.1 2016: D+22.8 2012: D+22.2 2008: D+28.4
Not yet ingested
- Civics
- —
Market trends
- HPI YoY
- ▼ -180.33%
- Current HPI
- 238.9661
- Rent YoY
- ▲ 3.78%
- Metro
- Indianapolis-Carmel-Anderson, IN
- State GDP YoY
- ▲ 2.90%
- F500 in state
- 18
Industry mix (Fortune 500 HQ in IN)
| Industry | F500 HQs | Revenue |
|---|---|---|
| Industrial Machinery | 2 | $37B |
|
||
| Healthcare | 1 | $177B |
|
||
| Pharmaceuticals | 1 | $45B |
|
||
| Metals / Steel | 1 | $18B |
|
||
| Agriculture | 1 | $17B |
|
||
| Packaging | 1 | $12B |
|
||
Price history
+166.9% since first listed10 events — show timeline
- 2026-05-28 Listed $199,900 MIBOR as Distributed by MLS Grid
- 2026-03-17 Listing Removed — MIBOR as Distributed by MLS Grid
- 2026-02-26 Price Changed $194,900 MIBOR as Distributed by MLS Grid
- 2026-01-13 Price Changed $199,900 MIBOR as Distributed by MLS Grid
- 2026-01-13 Relisted — MIBOR as Distributed by MLS Grid
- 2025-12-08 Listing Removed — MIBOR as Distributed by MLS Grid
- 2025-12-01 Price Changed $189,900 MIBOR as Distributed by MLS Grid
- 2025-11-18 Listed $199,900 MIBOR as Distributed by MLS Grid
- 2007-07-20 Listing Removed — MIBOR as Distributed by MLS Grid
- 2007-01-24 Listed $74,900 MIBOR as Distributed by MLS Grid
Property tax history
+7.0%/yrLatest (2025): $3,042 · +13.3% YoY. Source: county tax records.
Cash-flow waterfall
monthlySold comps — $/sqft
last 12 mo · ≤1 miLoading sold comps…