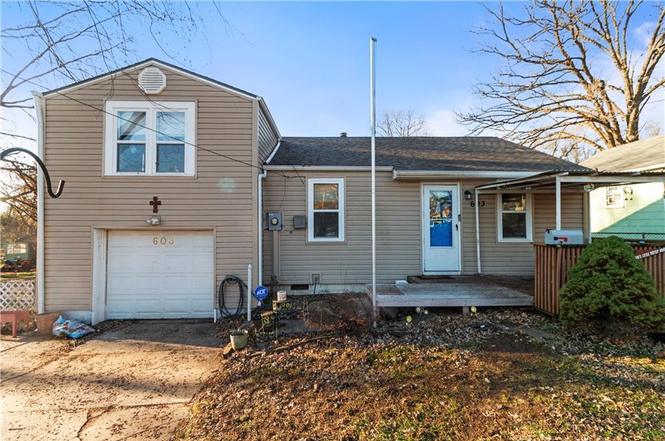
603 E Myrtle St · Independence, MO
Flood risk 1/10 · Minimal
- FEMA flood zone
- X (unshaded)
- Chance of flooding over 30 yrs
- 0.0%
- Est. flood insurance / yr
- $507 – $1,088
Fire risk 1/10 · Minimal
- Est. fire insurance / yr
- $1,054 – $1,958
Heat risk 4/10 · Minor
- Hot days now (above 106°F)
- 7 days/yr
- Hot days in 30 yrs
- 17 days/yr
Wind risk 2/10 · Minimal
- Chance of severe wind over 30 yrs
- —
Air-quality risk 3/10 · Minor
- Unhealthy air days now
- 3 days/yr
- Unhealthy air days in 30 yrs
- 3 days/yr
Risk factors via First Street. Map © Google.
Why this score? — see what drove the C+ grade
The composite is a weighted blend of 9 inputs, each scored 0–100. Each bar is that input's sub-score; the figure is the points it added to the 100-point composite (weight × sub-score).
- Cash flow +23.1/30.0
- ARV discount +15.0/15.0
- DSCR +7.4/10.0
- 1% rule +5.3/10.0
- Livability +4.1/5.0
- Rent growth +3.8/5.0
- Schools +2.7/10.0
- Condition / age +2.5/5.0
- Appreciation +0.0/10.0
$130,000
🖨 Deal sheet (PDF) 📄 Offer letter ✓ Due diligence
Listing remarks MLS
Clean and Cute - Super Cozy 2 Bd, 1 1/2 bath boasting a nice sized living room with connecting formal dining room offering a great space for entertaining. Kitchen features clean countertops, cabinets and a gas range. Off the kitchen you will find a family room for cozy nights next to the fire. Nice-sized bedrooms, awesome workshop off garage along with a laundry room are an even bigger bonus. Fenced yard features porch area in front and shed in back. Come take a look! This one won't last long!
Key facts
- 6,835 sq ft lot
- Garage
- Built 1945
Neighborhood map
What this means for you Summary
Snapshot
- This is a 2-bed/1.0-bath single-family listed at $130k.
Deal economics
- At list price, monthly cash flow is $233 ($3k/yr) — positive.
- The deal already cash-flows at list — no discount required.
- Meets the 1% rule at list price ($1k rent vs $130k).
- Recommended offer: $126k (3.0% below list) — sets the bar for market timing.
- Cap rate 8.4% vs local median 5.0% in Independence — top-decile yield for the area; either an underpriced asset or a hidden risk that comps aren't pricing in. Stress-test before assuming the spread holds.
Location & tenants
- Location reads 82/100 on livability (#10 in MO, #1,296 nationally) — a professional / high-income tenant draw. Strengths: amenities A+, commute A+, cost of living A+; Watch: employment D+, crime F.
- Independence 30 (suburban): math 26% / reading 38% proficiency, ranked #252 of 324 in MO (top 78%) — families likely to look elsewhere, expect single-tenant / working-renter base with shorter leases.
- Zoned schools: Sycamore Hills Elem. (math 42% / reading 47%, grade F, #413 of 1,115 statewide, top 42%, 543 students, 55% FRL); Truman High (math 18% / reading 34%, grade F, #430 of 521 statewide, top 83%, 1,662 students, 52% FRL) — zoned schools at 54% FRL track the district average.
- Market conditions: Rents rising fast (+5.1%/yr); 200 active listings in the ZIP; 14 comparable units currently listed for rent nearby; rentals at typical pace (median 24d on market — plan ~3-4 weeks tenant-placement turnaround); 43% of comp listings sitting > 30 days — soft ceiling on asking rent; 4,002 units permitted in Jackson County in 2024 (2,271 in 5+ unit buildings).
Forward outlook
- Local home prices are declining (-3.0%/yr); year-one equity from $899 of loan paydown is wiped out by about $4k of value loss. Plan a longer hold.
- Jackson County population projected at +4% by 2050 — modest demand growth; plan on rents tracking national, not racing it.
- At projected returns (-3.0% appreciation + 5.1% rent growth), your $36k cash investment doubles in ~10 years — after that, you're playing with house money.
Negotiation context
- It's been on market 47 days — a 3% lower offer ($126k) is reasonable based on typical stale-listing flexibility.
- 5 sale attempts since 28y ago; this cycle's ask has dropped $15k (10%) from the opening price — seller is motivated, your offer sets the floor, not the list.
Risks & watch-outs
- Watch-outs: built in 1945 — expect roof / HVAC / electrical / plumbing capex.
Questions for the listing agent
- It's been on market 47 days. Have you received any prior offers? Is the seller open to a 3% concession, seller financing, or rate buy-down credit?
- Built in 1945 — when were the roof, HVAC, electrical panel, plumbing, and water heater last replaced?
- Is there a deadline driving the sale (1031 exchange, divorce, estate, relocation)? That informs how much negotiation room exists.
- Crime grade is F in this area — have there been break-ins, vandalism, or insurance claims at this property in the last 3 years? What carrier currently insures it and at what premium?
- What's the average days-on-market for RENTAL listings here right now (not sales)? A rising rental-DOM trend means longer vacancies and softer asking-rent achievability than the comps imply.
- What's the recent tenant-quality profile in this submarket — average credit score on applications, eviction rate, late-payment / NSF rate, and stable-employment percentage? A property-management company in the area should have these aggregated.
- How much new for-sale + rental construction is in the pipeline within 1–3 miles? Heavy new supply typically softens prices + rents 12–24 months out; constrained supply supports both.
Investment metrics
- 1% rule
- 1.03% ✓
- Cap rate
- 8.44%
- Cash-on-cash
- 7.67%
- DSCR
- 1.34
- GRM
- 8.1
CMA / ARV
- ARV (on-the-fly)
- $178,684
- Comps found
- 12
Show comp detail 12 sales within ~0.75 mi
| Address | Dist | Beds/Ba | Sqft | Sold | Price | $/sf | Match |
|---|---|---|---|---|---|---|---|
| 603 E Myrtle St | 0.00mi | 2/1.5 | 1,364 (0%) | 1mo | $130,000 | $95 | 97 |
| 1347 S Hocker Ave | 0.08mi | 3/1.5 (+1) | 1,324 (-3%) | 1mo | $125,000 | $94 | 84 |
| 1120 S Leslie St | 0.25mi | 3/2.0 (+1) | 1,372 (+1%) | 3mo | $184,900 | $135 | 76 |
| 660 E Red Rd | 0.50mi | 3/1.0 (+1) | 1,380 (+1%) | 2mo | $239,900 | $174 | 68 |
| 1312 S Pearl St | 0.20mi | 2/2.0 | 1,220 (-11%) | 2mo | $159,500 | $131 | 67 |
| 1340 S Emery Ave | 0.05mi | 3/1.0 (+1) | 1,160 (-15%) | 2mo | $95,000 | $82 | 66 |
| 804 E Gudgell Ave | 0.35mi | 3/1.0 (+1) | 1,262 (-8%) | 5mo | $119,900 | $95 | 62 |
| 930 S Leslie St | 0.38mi | 3/2.5 (+1) | 1,276 (-6%) | 2mo | $200,000 | $157 | 59 |
| 916 S Hocker Ave | 0.43mi | 3/1.0 (+1) | 1,260 (-8%) | 6mo | $25,000 | $20 | 57 |
| 1040 Stone St | 0.50mi | 2/2.0 | 1,176 (-14%) | 1mo | $209,900 | $178 | 49 |
| 1211 S Osage St | 0.62mi | 3/2.0 (+1) | 1,236 (-9%) | 2mo | $163,000 | $132 | 45 |
| 926 S Washington St | 0.66mi | 3/1.0 (+1) | 1,558 (+14%) | 5mo | $168,000 | $108 | 36 |
Match score weights: distance 35% · size 25% · config 20% · recency 20%. Top-matched comps best support the ARV.
Projected returns pro-forma
-3.0% appreciation · 5.09% rent growth · sell at horizon
- IRR
- -2.4%
- Equity multiple
- 0.91×
- Total profit
- $-3,398
- Equity at exit
- $19,383
- IRR
- 9.3%
- Equity multiple
- 1.78×
- Total profit
- $28,321
- Equity at exit
- $11,240
Cash invested: $36,400 (down + closing). Projections, not guarantees.
Landlord ↔ Tenant lean methodology
- Overall (STATE)
- 81 Strongly Landlord-Friendly
- State Missouri
- 81 Strongly Landlord-Friendly · R+10
- County
- — inherits STATE
- City
- — inherits STATE
ZIP-level market 64055
- Rents YoY
- 5.1%
- Active inventory
- 200
- Price-to-rent
- 8.1×
Monthly cashflow live
- Estimated rent
- $1,338 high interval (Pro) →
- Mortgage (P&I)
- −$682
- Tax from tax record
- −$88 /mo · $1,059/yr
- Insurance
- −$54
- HOA
- −$0
- Vacancy / Maint / Mgmt
- −$281
- Net cashflow
- $233
Break-even live
Sensitivity live
| Price | -10% $306 | -5% $269 | +0% $233 | +5% $196 | +10% $159 |
|---|---|---|---|---|---|
| Rent | -10% $127 | -5% $180 | +0% $233 | +5% $286 | +10% $338 |
| Rate | -1.0pp $298 | -0.5pp $266 | base $233 | +0.5pp $199 | +1.0pp $165 |
UW: 25.0% down · 7.5% · 30yr · 1.5% tax · 5.0% vac · 8.0% maint · 8.0% mgmt
Financing live
Cash to close
- Down payment
- $32,500
- Closing costs
- $3,900
- Reserves months
- —
- Total cash needed
- —
Loan-product check · same deal, 3 products live
Conventional
25% down · 7.5% · 30yr
- Down + closing
- —
- Monthly P&I
- —
- Monthly cashflow
- —
- DSCR
- —
- Eligible?
- —
Personal DTI + credit; lowest rate.
DSCR
20% down · 8.5% · 30yr
- Down + closing
- —
- Monthly P&I
- —
- Monthly cashflow
- —
- DSCR
- —
- Eligible?
- —
No personal income docs; deal must DSCR.
Hard money
10% down · 12.0% · 12mo
- Down + closing
- —
- Monthly P&I
- —
- Monthly cashflow
- —
- DSCR
- —
- Eligible?
- —
Short-term bridge; refi at stabilization.
Rent comps 14 comps
| Address | Beds | Baths | Sqft | Rent | $/sqft | DOM | Units | Dist |
|---|---|---|---|---|---|---|---|---|
| 1118 S Pope Ave Independence, MO | 2.0 | 1.0 | 988 | $1,195 | $1.21 | 17d | 1 | 0.28mi |
| 321 W South Ave Unit 11 Independence, MO | 3.0 | 2.0 | 1000 | $1,275 | $1.27 | 22d | 1 | 0.74mi |
| 321 W South Ave Unit 9 Independence, MO | 2.0 | 1.5 | 980 | $1,295 | $1.32 | 44d | 1 | 0.74mi |
| 321 W South Ave Unit 8 Independence, MO | 2.0 | 1.5 | 980 | $1,895 | $1.93 | 2d | 1 | 0.74mi |
| 1502 S Pleasant St Independence, MO | 3.0 | 2.0 | 1200 | $1,399 | $1.17 | 44d | 1 | 0.78mi |
| 315 S Crane St Unit A Independence, MO | 3.0 | 1.0 | 1150 | $1,250 | $1.09 | 24d | 1 | 0.94mi |
| 315 S Crane St Unit A Independence, MO | 3.0 | 1.0 | 1150 | $1,250 | $1.09 | 44d | 1 | 0.94mi |
| 2905 S Lee's Summit Rd Independence, MO | 1.0–3.0 | 1.0–2.0 | 853 | $1,330 | $1.56 | 2d | 48 | 1.19mi |
| 724 S Grand Ave Independence, MO | 2.0 | 2.0 | 1000 | $1,149 | $1.15 | 44d | 1 | 1.26mi |
| 523 W Maple Ave Unit 2 A Independence, MO | 3.0 | 2.0 | 964 | $995 | $1.03 | 44d | 1 | 1.39mi |
| 16421 E 29th Ter S Independence, MO | 3.0 | 2.0 | 1225 | $1,606 | $1.31 | 44d | 1 | 1.41mi |
| 3501 S Osage St Independence, MO | 3.0 | 1.0 | 1300 | $1,495 | $1.15 | 17d | 1 | 1.47mi |
| 3501 S Osage St Independence, MO | 3.0 | 1.0 | 1300 | $1,495 | $1.15 | 20d | 1 | 1.47mi |
| 523 S Crysler Ave Unit A Independence, MO | 2.0 | 1.0 | 900 | $650 | $0.72 | 24d | 1 | 1.49mi |
Listing history 19 events
-
2026-04-27status Pending
-
2026-04-23price $130,000
-
2026-03-12$145,000 Active
-
2026-03-05historical $145,000
-
2023-03-29soldstatus
-
2023-03-27soldstatus Closed 498-char remark
Show marketing remark (498 chars)
Clean and Cute - Super Cozy 2 Bd, 1 1/2 bath boasting a nice sized living room with connecting formal dining room offering a great space for entertaining. Kitchen features clean countertops, cabinets and a gas range. Off the kitchen you will find a family room for cozy nights next to the fire. Nice-sized bedrooms, awesome workshop off garage along with a laundry room are an even bigger bonus. Fenced yard features porch area in front and shed in back. Come take a look! This one won't last long!
-
2023-03-07status Pending 498-char remark
Show marketing remark (498 chars)
Clean and Cute - Super Cozy 2 Bd, 1 1/2 bath boasting a nice sized living room with connecting formal dining room offering a great space for entertaining. Kitchen features clean countertops, cabinets and a gas range. Off the kitchen you will find a family room for cozy nights next to the fire. Nice-sized bedrooms, awesome workshop off garage along with a laundry room are an even bigger bonus. Fenced yard features porch area in front and shed in back. Come take a look! This one won't last long!
-
2023-03-05$126,800 Active 498-char remark
Show marketing remark (498 chars)
Clean and Cute - Super Cozy 2 Bd, 1 1/2 bath boasting a nice sized living room with connecting formal dining room offering a great space for entertaining. Kitchen features clean countertops, cabinets and a gas range. Off the kitchen you will find a family room for cozy nights next to the fire. Nice-sized bedrooms, awesome workshop off garage along with a laundry room are an even bigger bonus. Fenced yard features porch area in front and shed in back. Come take a look! This one won't last long!
-
2015-07-21soldstatus
-
2009-10-21soldstatus 395-char remark
Show marketing remark (395 chars)
Sold as is, no contingencies, proof of funds or preapproval with offer, EM from certified funds, sizes from taxes, 2 bedroom, 1 1/2 bath, 1.5 story, has formal dining, one garage and fireplace in the family room. close to 23rd street. crawl space Purchace this property for as little as 3% down. This property is approved for HomePath Renovation Mortgage financing. See HomePath.com for details.
-
2009-05-12$39,900 395-char remark
Show marketing remark (395 chars)
Sold as is, no contingencies, proof of funds or preapproval with offer, EM from certified funds, sizes from taxes, 2 bedroom, 1 1/2 bath, 1.5 story, has formal dining, one garage and fireplace in the family room. close to 23rd street. crawl space Purchace this property for as little as 3% down. This property is approved for HomePath Renovation Mortgage financing. See HomePath.com for details.
-
2007-12-04soldstatus
-
2002-09-16soldstatus
-
2002-09-13soldstatus
-
2002-08-09$65,000
-
1998-07-30soldstatus
-
1998-07-29soldstatus
-
1998-06-08$59,500
-
1989-07-13soldstatus
ⓘ Source: listings_history table (triggers on properties + properties_extension) + one-shot
backfill from property_details.listing_events for pre-trigger history.
Tax reassessment forecast MO · Resets to sale price
- Current annual tax
- $1,059 · $88/mo
- Projected year-2 tax
- $1,261 · $105/mo
- Expected delta
- +$202/yr (+$17/mo · 19.0%)
ⓘ Screening estimate from a state-policy table — verify with the county assessor before closing.
Climate risk First Street
- Flood 1/10 Low FEMA zone X (unshaded) · 0% chance over 30 yrs
- Wildfire 1/10 Low
- Heat 4/10 Moderate 7 d/yr ≥106°F today · 17 d/yr by 30 yrs out
- Wind 2/10 Low
- Air quality 3/10 Moderate 3 unhealthy d/yr today · 3 by 30 yrs out
Nearby sold comps map
Loading sold comps map…
Walkable amenities ~0.75 mi
Loading nearby amenities…
Taxation est. · year 1
- Rental income
- $16,054
- − Mortgage interest
- −$7,282
- − Property taxes
- −$1,059
- − Insurance
- −$650
- − Repairs & maintenance
- −$1,284
- − Management
- −$1,284
- − Depreciation
- −$3,782
- Taxable income
- $712
- Est. tax owed @ 24.0%
- −$171
- After-tax cash flow
- $2,621/yr
For passive investors: Depreciation is non-cash, so a rental often shows a tax loss while cash-flowing — sheltering income. Rental losses are passive: they offset passive income freely, and up to $25,000/yr can offset ordinary (W-2) income if you actively participate and your MAGI is under $100k (phasing out to $0 by $150k); unused losses carry forward. On sale, claimed depreciation is recaptured at up to 25%, and gains may owe capital-gains tax (a 1031 exchange can defer both). Figures are a year-1 estimate at your 24.0% rate — not tax advice; consult a CPA.
Schools (NCES district)
- District
- Independence 30
- NCES district ID
- 2915480
- Math proficiency
- 26% ▼ -8.00%
- Reading proficiency
- 38% ▼ -5.00%
- Median HH income
- $41,843
- Composite
- 27.04/100
- National rank
- #7054
- State rank
- #252 of 324 in MO
Livability — Independence
- Score
- 82/100
- State rank
- #10
- US rank
- #1296
Category grades
Schools grade is shown separately in the Schools card above.
Census & demographics
- Census place
- Independence, MO
- County
- Jackson County · 687,798 people
- City population
- 117,675
- Metro
- Kansas City, MO-KS
- Population (ZIP)
- 35,960
- Household income
- $62,439
- Rent vs Own
- Severe rent burden
- 1404.0
Population outlook (Jackson County) Hauer SSP2
- Today (2025)
- 719,589 people
- By 2030
- 731,456 · +1.6%
- By 2040
- 746,689 · +3.8%
- By 2050
- 749,289 · +4.1%
- By 2075
- 736,227 · +2.3%
- By 2100
- 668,210 · -7.1%
Race, ethnicity, and origin ACS 2023
- Neighborhood character
- Predominantly White (71%)
- Race & ethnicity
- White 71% Black 13% Hispanic / Latino 10% Two or more races 8% Asian 1%
- Hispanic origin (detail)
- Mexican 7% Puerto Rican 2%
- Common ancestry
- Italian 9% Lithuanian 2% Slovak 2%
- Foreign-born
- 4% · Canada
- Languages at home
- 94% English-only · Spanish 4%
Political lean MEDSL · Jackson
- 2024 margin
- D (+19.3) · D 58.9% · R 39.5% · Other 1.6%
- 2008→2024 swing
- -6.1pp toward R · 2008: 25.4pp · 2024: 19.3pp
- All cycles
- 2024: D+19.3 2020: D+22.0 2016: D+16.6 2012: D+19.0 2008: D+25.4
Not yet ingested
- Civics
- —
Market trends
- HPI YoY
- ▼ -180.54%
- Current HPI
- 245.3636
- Rent YoY
- ▲ 5.09%
- Metro
- Kansas City, MO-KS
- State GDP YoY
- ▲ 1.84%
- F500 in state
- 20
Industry mix (Fortune 500 HQ in MO)
| Industry | F500 HQs | Revenue |
|---|---|---|
| Healthcare | 1 | $163B |
|
||
| Insurance | 1 | $21B |
|
||
| Industrial Technology | 1 | $17B |
|
||
| Retail | 1 | $16B |
|
||
| Industrial Distribution | 1 | $10B |
|
||
| Utilities | 1 | $9B |
|
||
Price history
+118.5% since first listed19 events — show timeline
- 2026-04-27 Pending — Heartland MLS as Distributed by MLS Grid
- 2026-04-23 Price Changed $130,000 Heartland MLS as Distributed by MLS Grid
- 2026-03-12 Listed $145,000 Heartland MLS as Distributed by MLS Grid
- 2026-03-05 Coming Soon $145,000 Heartland MLS as Distributed by MLS Grid
- 2023-03-29 Sold (Public Records) — Public Records
- 2023-03-27 Sold (MLS) — Heartland MLS as Distributed by MLS Grid
- 2023-03-07 Pending — Heartland MLS as Distributed by MLS Grid
- 2023-03-05 Listed $126,800 Heartland MLS as Distributed by MLS Grid
- 2015-07-21 Sold (Public Records) — Public Records
- 2009-10-21 Sold (MLS) — Heartland MLS as Distributed by MLS Grid
- 2009-05-12 Listed $39,900 Heartland MLS as Distributed by MLS Grid
- 2007-12-04 Sold (Public Records) — Public Records
- 2002-09-16 Sold (Public Records) — Public Records
- 2002-09-13 Sold (MLS) — Heartland MLS as Distributed by MLS Grid
- 2002-08-09 Listed $65,000 Heartland MLS as Distributed by MLS Grid
- 1998-07-30 Sold (Public Records) — Public Records
- 1998-07-29 Sold (MLS) — Heartland MLS as Distributed by MLS Grid
- 1998-06-08 Listed $59,500 Heartland MLS as Distributed by MLS Grid
- 1989-07-13 Sold (Public Records) — Public Records
Property tax history
+2.6%/yrLatest (2025): $1,059 · -36.2% YoY. Source: county tax records.
Cash-flow waterfall
monthlySold comps — $/sqft
last 12 mo · ≤1 miLoading sold comps…