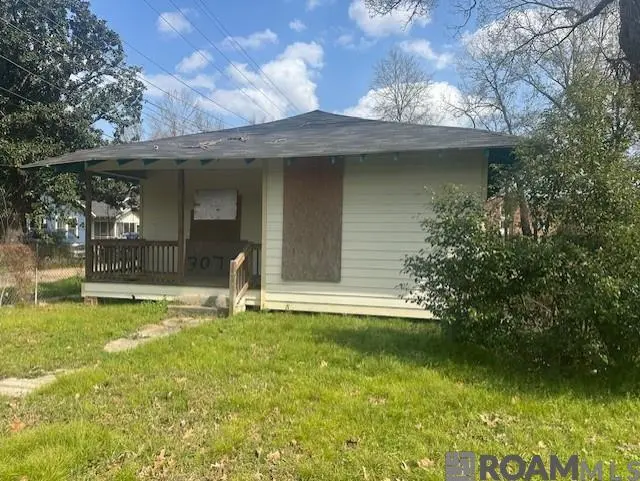
3070 Hiawatha St · Baton Rouge, LA
Flood risk 1/10 · Minimal
- FEMA flood zone
- X (unshaded)
- Chance of flooding over 30 yrs
- 0.0%
- Est. flood insurance / yr
- $507 – $1,088
Fire risk 1/10 · Minimal
- Est. fire insurance / yr
- $1,269 – $2,357
Heat risk 8/10 · Major
- Hot days now (above 108°F)
- 6 days/yr
- Hot days in 30 yrs
- 16 days/yr
Wind risk 9/10 · Severe
- Chance of severe wind over 30 yrs
- 99.0%
Air-quality risk 2/10 · Minimal
- Unhealthy air days now
- 1 days/yr
- Unhealthy air days in 30 yrs
- 1 days/yr
Risk factors via First Street. Map © Google.
Why this score? — see what drove the B+ grade
The composite is a weighted blend of 9 inputs, each scored 0–100. Each bar is that input's sub-score; the figure is the points it added to the 100-point composite (weight × sub-score).
- Cash flow +30.0/30.0
- ARV discount +15.0/15.0
- 1% rule +10.0/10.0
- DSCR +10.0/10.0
- Livability +3.7/5.0
- Condition / age +2.5/5.0
- Schools +2.4/10.0
- Rent growth +2.2/5.0
- Appreciation +0.0/10.0
$49,900
🖨 Deal sheet (PDF) 📄 Offer letter ✓ Due diligence
Listing remarks MLS
CALLING ALL INVESTOR/ OR HOMEOWNER WITH A RENOVATION LOAN! Home is fully gutted; a blank canvas awaits your touch. The home sits on 2 lots and has so much potential. While the interior may need renovation, the exterior is in great condition. New windows, new exterior doors, new hardy plank siding, new subfloors, foundation leveled, 100 sq. ft. front porch and a rear porch that extend along the entire backside of the home. With 3 bedrooms, 2 full baths, 9 ft. ceiling, office, indoor utility room and a formal living & dining room.
Key facts
- New exterior doors
- 2 lots
- Foundation leveled
Tags
Neighborhood map
What this means for you Summary
Snapshot
- This is a 3-bed/2.0-bath single-family listed at $50k.
Deal economics
- At list price, monthly cash flow is $585 ($7k/yr) — positive.
- The deal already cash-flows at list — no discount required.
- Meets the 1% rule at list price ($1k rent vs $50k).
- Recommended offer: $45k (9.0% below list) — sets the bar for market timing.
- Cap rate 20.4% vs local median 4.3% in Baton Rouge — top-decile yield for the area; either an underpriced asset or a hidden risk that comps aren't pricing in. Stress-test before assuming the spread holds.
Location & tenants
- Location reads 74/100 on livability (#24 in LA, #4,535 nationally) — a middle-class / working-renter tenant base. Strengths: commute A+, cost of living A+, health & safety A+; Watch: amenities D, crime F, employment D-.
- East Baton Rouge Parish (urban): math 22% / reading 34% proficiency, ranked #47 of 98 in LA (top 48%) — low school quality limits family demand, transient renter base, plan for 1-2y turnover; 77% free/reduced lunch — lower-income household profile, screen leases tightly.
- Market conditions: Rents soft (-1.2%/yr); 155 active listings in the ZIP; 23 comparable units currently listed for rent nearby; rentals at typical pace (median 24d on market — plan ~3-4 weeks tenant-placement turnaround); lower-income renter base — watch delinquency; 2,252 units permitted in East Baton Rouge Parish in 2024 (440 in 5+ unit buildings).
- At $1,172/mo this rent would consume 55% of the median local household income ($25k/yr) (locally 1980% of renters already pay >50% of income on rent) — very limited rent-growth headroom before tenants either downsize or default.
Forward outlook
- Local home prices are declining (-3.0%/yr); year-one equity from $345 of loan paydown is wiped out by about $1k of value loss. Plan a longer hold.
- East Baton Rouge County population projected at +4% by 2050 — modest demand growth; plan on rents tracking national, not racing it.
- At projected returns (-3.0% appreciation + 0.0% rent growth), your $14k cash investment doubles in ~3 years — after that, you're playing with house money.
Negotiation context
- It's been on market 118 days — a 9% lower offer ($45k) is reasonable based on typical stale-listing flexibility.
- 10 sale attempts since 27y ago with the ask held roughly flat each time — persistent listings suggest the price (not the market) is what's stuck; bring a comps-based counter.
- Current owner paid $3k; list at $50k implies a 1454% gain — meaningful room to come down on a strong offer.
Risks & watch-outs
- Watch-outs: built in 1949 — expect roof / HVAC / electrical / plumbing capex.
- Climate carrying-cost: severe wind risk, 99% chance of damaging wind over 30y; extreme-heat days projected 6→16/yr by 2055 (HVAC capex compounding) — expect insurance premiums to compound above CPI over the hold.
Questions for the listing agent
- It's been on market 118 days. Have you received any prior offers? Is the seller open to a 9% concession, seller financing, or rate buy-down credit?
- Built in 1949 — when were the roof, HVAC, electrical panel, plumbing, and water heater last replaced?
- Why hasn't it sold? Are there any deal-killer items the seller is aware of (foundation, flood, title, zoning, code violations)?
- Is there a deadline driving the sale (1031 exchange, divorce, estate, relocation)? That informs how much negotiation room exists.
- Crime grade is F in this area — have there been break-ins, vandalism, or insurance claims at this property in the last 3 years? What carrier currently insures it and at what premium?
- What's the average days-on-market for RENTAL listings here right now (not sales)? A rising rental-DOM trend means longer vacancies and softer asking-rent achievability than the comps imply.
- What's the recent tenant-quality profile in this submarket — average credit score on applications, eviction rate, late-payment / NSF rate, and stable-employment percentage? A property-management company in the area should have these aggregated.
- How much new for-sale + rental construction is in the pipeline within 1–3 miles? Heavy new supply typically softens prices + rents 12–24 months out; constrained supply supports both.
Investment metrics
- 1% rule
- 2.35% ✓
- Cap rate
- 20.35%
- Cash-on-cash
- 50.22%
- DSCR
- 3.23
- GRM
- 3.5
CMA / ARV
- ARV (median comp)
- $72,221
- List price
- $49,900
- Delta
- -30.91%
- Verdict
- UNDERPRICED
- Comps
- 20 within 1.0 mi
Show comp detail 12 sales within ~0.75 mi
| Address | Dist | Beds/Ba | Sqft | Sold | Price | $/sf | Match |
|---|---|---|---|---|---|---|---|
| 2927 Tecumseh St | 0.10mi | 3/2.0 | 1,245 (-3%) | 3mo | $182,500 | $147 | 87 |
| 3017 Winbourne Ave | 0.45mi | 3/2.0 | 1,307 (+2%) | 9mo | $19,900 | $15 | 69 |
| 3235 Alliquippa St | 0.26mi | 2/1.0 (-1) | 1,200 (-7%) | 5mo | $80,000 | $67 | 63 |
| 3805 Pocasset St | 0.54mi | 3/2.0 | 1,330 (+3%) | 9mo | $32,000 | $24 | 62 |
| 3825 Keokuk St | 0.65mi | 4/2.0 (+1) | 1,265 (-2%) | 5mo | $59,500 | $47 | 58 |
| 3008 Seneca St | 0.57mi | 3/1.0 | 1,350 (+5%) | 9mo | $64,900 | $48 | 54 |
| 2908 Adams Ave | 0.67mi | 3/1.0 | 1,232 (-4%) | 9mo | $100,000 | $81 | 50 |
| 2711 Jackson Ave | 0.74mi | 3/2.0 | 1,200 (-7%) | 7mo | $79,000 | $66 | 48 |
| 3430 Oswego St | 0.73mi | 2/1.0 (-1) | 1,180 (-8%) | 1mo | $95,900 | $81 | 42 |
| 2526 Adams Ave | 0.56mi | 3/1.0 | 1,124 (-13%) | 13mo | $130,000 | $116 | 38 |
| 3135 Monroe Ave | 0.70mi | 2/1.0 (-1) | 1,205 (-6%) | 13mo | $70,000 | $58 | 36 |
| 2733 Jackson Ave | 0.74mi | 3/1.0 | 1,151 (-11%) | 13mo | $63,829 | $55 | 33 |
Match score weights: distance 35% · size 25% · config 20% · recency 20%. Top-matched comps best support the ARV.
Projected returns pro-forma
-3.0% appreciation · 0.0% rent growth · sell at horizon
- IRR
- 44.5%
- Equity multiple
- 2.84×
- Total profit
- $25,735
- Equity at exit
- $7,440
- IRR
- 49.1%
- Equity multiple
- 5.09×
- Total profit
- $57,152
- Equity at exit
- $4,314
Cash invested: $13,972 (down + closing). Projections, not guarantees.
Landlord ↔ Tenant lean methodology
- Overall (STATE)
- 90 Strongly Landlord-Friendly
- State Louisiana
- 90 Strongly Landlord-Friendly · R+12
- County
- — inherits STATE
- City
- — inherits STATE
ZIP-level market 70805
- Rents YoY
- -1.2%
- Active inventory
- 155
- Price-to-rent
- 3.5×
Monthly cashflow live
- Estimated rent
- $1,172 high interval (Pro) →
- Mortgage (P&I)
- −$262
- Tax from tax record
- −$59 /mo · $703/yr
- Insurance
- −$21
- HOA
- −$0
- Vacancy / Maint / Mgmt
- −$246
- Net cashflow
- $585
Break-even live
Sensitivity live
| Price | -10% $613 | -5% $599 | +0% $585 | +5% $571 | +10% $556 |
|---|---|---|---|---|---|
| Rent | -10% $492 | -5% $538 | +0% $585 | +5% $631 | +10% $677 |
| Rate | -1.0pp $610 | -0.5pp $597 | base $585 | +0.5pp $572 | +1.0pp $559 |
UW: 25.0% down · 7.5% · 30yr · 1.5% tax · 5.0% vac · 8.0% maint · 8.0% mgmt
Financing live
Cash to close
- Down payment
- $12,475
- Closing costs
- $1,497
- Reserves months
- —
- Total cash needed
- —
Loan-product check · same deal, 3 products live
Conventional
25% down · 7.5% · 30yr
- Down + closing
- —
- Monthly P&I
- —
- Monthly cashflow
- —
- DSCR
- —
- Eligible?
- —
Personal DTI + credit; lowest rate.
DSCR
20% down · 8.5% · 30yr
- Down + closing
- —
- Monthly P&I
- —
- Monthly cashflow
- —
- DSCR
- —
- Eligible?
- —
No personal income docs; deal must DSCR.
Hard money
10% down · 12.0% · 12mo
- Down + closing
- —
- Monthly P&I
- —
- Monthly cashflow
- —
- DSCR
- —
- Eligible?
- —
Short-term bridge; refi at stabilization.
Rent comps 23 comps
| Address | Beds | Baths | Sqft | Rent | $/sqft | DOM | Units | Dist |
|---|---|---|---|---|---|---|---|---|
| 2645 Seneca St Baton Rouge, LA | 3.0 | 2.0 | 1650 | $1,550 | $0.94 | 24d | 1 | 0.45mi |
| 3160 Wyandotte St Baton Rouge, LA | 2.0 | 1.0 | 1100 | $800 | $0.73 | 44d | 1 | 0.68mi |
| 2606 Weller Ave Baton Rouge, LA | 2.0 | 1.0 | 1000 | $650 | $0.65 | 44d | 1 | 0.68mi |
| 3567 Charles St Baton Rouge, LA | 3.0 | 1.0 | 1400 | $1,250 | $0.89 | 44d | 1 | 0.87mi |
| 1847 N 16th St Baton Rouge, LA | 3.0 | 2.0 | 909 | $1,250 | $1.38 | 15d | 1 | 0.87mi |
| 2852 Dayton St Baton Rouge, LA | 2.0 | 1.0 | 1020 | $850 | $0.83 | 24d | 1 | 0.90mi |
| 3725 Winbourne Ave Baton Rouge, LA | 4.0 | 1.5 | 1800 | $1,495 | $0.83 | 19d | 1 | 0.90mi |
| 2933 Dayton St Baton Rouge, LA | 4.0 | 2.0 | 1800 | $1,350 | $0.75 | 24d | 1 | 0.95mi |
| 3936 Dalton St Baton Rouge, LA | 2.0 | 1.0 | 900 | $750 | $0.83 | 19d | 1 | 0.99mi |
| 3888 Charles St Baton Rouge, LA | 3.0 | 2.0 | 1650 | $1,425 | $0.86 | 24d | 1 | 1.04mi |
| 3888 Charles St Baton Rouge, LA | 3.0 | 2.0 | 1600 | $1,500 | $0.94 | 19d | 1 | 1.04mi |
| 1404 N 29th St Baton Rouge, LA | 3.0 | 2.0 | 1120 | $1,100 | $0.98 | 44d | 1 | 1.09mi |
| 1336 N 29th St Baton Rouge, LA | 3.0 | 2.0 | 1400 | $1,450 | $1.04 | 15d | 1 | 1.12mi |
| 1305 N 30th St Baton Rouge, LA | 2.0 | 1.0 | 1000 | $900 | $0.90 | 24d | 1 | 1.14mi |
| 3906 S Barrow Dr Baton Rouge, LA | 3.0 | 2.0 | 1523 | $1,295 | $0.85 | 24d | 1 | 1.19mi |
| 2347 Rhodes Ave Baton Rouge, LA | 2.0 | 1.0 | 1250 | $950 | $0.76 | 19d | 1 | 1.21mi |
| 1409 N 35th St Baton Rouge, LA | 3.0 | 2.0 | 912 | $750 | $0.82 | 24d | 1 | 1.26mi |
| 4912 Breckenridge Ave Baton Rouge, LA | 3.0 | 2.0 | 1800 | $1,075 | $0.60 | 15d | 1 | 1.26mi |
| 4809 Longfellow Dr Baton Rouge, LA | 3.0 | 2.0 | 1786 | $1,900 | $1.06 | 15d | 1 | 1.31mi |
| 4236 Delaware St Baton Rouge, LA | 3.0 | 2.0 | 1600 | $1,500 | $0.94 | 24d | 1 | 1.32mi |
| 1348 N 37th St Baton Rouge, LA | 3.0 | 1.0 | 1100 | $1,200 | $1.09 | 44d | 1 | 1.34mi |
| 3647 Mission Dr Baton Rouge, LA | 3.0 | 1.0 | 900 | $895 | $0.99 | 24d | 1 | 1.35mi |
| 4380 Mohican-Prescott Crossover Baton Rouge, LA | 2.0 | 2.0 | 910 | $1,055 | $1.16 | 44d | 1 | 1.46mi |
Listing history 27 events
-
2026-06-18days on market $49,900 Active 118 DOM
-
2026-06-17days on market $49,900 Active 117 DOM
-
2026-06-16days on market $49,900 Active 116 DOM
-
2026-06-15days on market $49,900 Active 115 DOM
-
2026-06-14days on market $49,900 Active 113 DOM
-
2026-06-10days on market $49,900 Active 110 DOM
-
2026-06-09days on market $49,900 Active 109 DOM
-
2026-06-08days on market $49,900 Active 108 DOM
-
2026-06-07days on market $49,900 Active 107 DOM
-
2026-06-05days on market $49,900 Active 104 DOM
-
2026-06-03days on market $49,900 Active 103 DOM
-
2026-06-02days on market $49,900 Active 102 DOM
-
2026-06-01days on market $49,900 Active 101 DOM
-
2026-05-31days on market $49,900 Active 100 DOM
-
2026-05-31days on market $49,900 Active 99 DOM
-
2026-02-20$49,900 Active 541-char remark
Show marketing remark (538 chars)
CALLING ALL INVESTOR/ OR HOMEOWNER WITH A RENOVATION LOAN! Home is fully gutted; a blank canvas awaits your touch. The home sits on 2 lots and has so much potential. While the interior may need renovation, the exterior is in great condition. New windows, new exterior doors, new hardy plank siding, new subfloors, foundation leveled, 100 sq. ft. front porch and a rear porch that extend along the entire backside of the home. With 3 bedrooms, 2 full baths, 9 ft. ceiling, office, indoor utility room and a formal living & dining room.
-
2026-02-20$49,900 Active 538-char remark
Show marketing remark (538 chars)
CALLING ALL INVESTOR/ OR HOMEOWNER WITH A RENOVATION LOAN! Home is fully gutted; a blank canvas awaits your touch. The home sits on 2 lots and has so much potential. While the interior may need renovation, the exterior is in great condition. New windows, new exterior doors, new hardy plank siding, new subfloors, foundation leveled, 100 sq. ft. front porch and a rear porch that extend along the entire backside of the home. With 3 bedrooms, 2 full baths, 9 ft. ceiling, office, indoor utility room and a formal living & dining room.
-
2024-12-11$70,000 Active
-
2024-12-11historical
-
2024-02-15$70,000 Active
-
2024-02-15$70,000 Active
-
2017-09-08soldstatus $3,211
-
2008-08-14$58,900
-
2008-08-14$58,900
-
2008-01-18$58,900
-
2008-01-18$58,900
-
1999-10-13$39,900
ⓘ Source: listings_history table (triggers on properties + properties_extension) + one-shot
backfill from property_details.listing_events for pre-trigger history.
Tax reassessment forecast LA · Resets to sale price
- Current annual tax
- $703 · $59/mo
- Projected year-2 tax
- $703 · $59/mo
- Expected delta
- $0/yr ($0/mo · 0.0%)
ⓘ Screening estimate from a state-policy table — verify with the county assessor before closing.
Climate risk First Street
- Flood 1/10 Low FEMA zone X (unshaded) · 0% chance over 30 yrs
- Wildfire 1/10 Low
- Heat 8/10 Severe 6 d/yr ≥108°F today · 16 d/yr by 30 yrs out
- Wind 9/10 Extreme 99% chance of damaging wind over 30 yrs
- Air quality 2/10 Low 1 unhealthy d/yr today · 1 by 30 yrs out
Nearby sold comps map
Loading sold comps map…
Walkable amenities ~0.75 mi
Loading nearby amenities…
Taxation est. · year 1
- Rental income
- $14,062
- − Mortgage interest
- −$2,795
- − Property taxes
- −$703
- − Insurance
- −$250
- − Repairs & maintenance
- −$1,125
- − Management
- −$1,125
- − Depreciation
- −$1,452
- Taxable income
- $6,613
- Est. tax owed @ 24.0%
- −$1,587
- After-tax cash flow
- $5,429/yr
For passive investors: Depreciation is non-cash, so a rental often shows a tax loss while cash-flowing — sheltering income. Rental losses are passive: they offset passive income freely, and up to $25,000/yr can offset ordinary (W-2) income if you actively participate and your MAGI is under $100k (phasing out to $0 by $150k); unused losses carry forward. On sale, claimed depreciation is recaptured at up to 25%, and gains may owe capital-gains tax (a 1031 exchange can defer both). Figures are a year-1 estimate at your 24.0% rate — not tax advice; consult a CPA.
Schools (NCES district)
- District
- East Baton Rouge Parish
- NCES district ID
- 2200540
- Math proficiency
- 22% ▼ -36.00%
- Reading proficiency
- 34% ▼ -31.00%
- Median HH income
- $46,263
- Composite
- 24.14/100
- National rank
- #7745
- State rank
- #47 of 98 in LA
Livability — Baton Rouge
- Score
- 74/100
- State rank
- #24
- US rank
- #4535
Category grades
Schools grade is shown separately in the Schools card above.
Census & demographics
- Census place
- Baton Rouge, LA
- County
- East Baton Rouge Parish · 399,686 people
- City population
- 351,868
- Metro
- Baton Rouge, LA
- Population (ZIP)
- 23,288
- Household income
- $25,397
- Rent vs Own
- Severe rent burden
- 1980.0
Population outlook (East Baton Rouge County) Hauer SSP2
- Today (2025)
- 464,810 people
- By 2030
- 472,137 · +1.6%
- By 2040
- 480,243 · +3.3%
- By 2050
- 484,422 · +4.2%
- By 2075
- 492,069 · +5.9%
- By 2100
- 476,347 · +2.5%
Race, ethnicity, and origin ACS 2023
- Neighborhood character
- Predominantly Black (95%)
- Race & ethnicity
- Black 95% Hispanic / Latino 2% White 2% Two or more races 1%
- Common ancestry
- Lithuanian 1%
- Foreign-born
- 1% · Canada
- Languages at home
- 98% English-only · Spanish 1%
Political lean MEDSL · East Baton Rouge
- 2024 margin
- D (+11.1) · D 54.5% · R 43.4% · Other 2.1%
- 2008→2024 swing
- +8.9pp toward D · 2008: 2.2pp · 2024: 11.1pp
- All cycles
- 2024: D+11.1 2020: D+13.1 2016: D+9.2 2012: D+5.2 2008: D+2.2
Not yet ingested
- Civics
- —
Market trends
- HPI YoY
- ▼ -110.79%
- Current HPI
- 75.7121
- Rent YoY
- ▼ -1.21%
- Metro
- Baton Rouge, LA
- State GDP YoY
- ▲ 3.29%
- F500 in state
- 10
Industry mix (Fortune 500 HQ in LA)
| Industry | F500 HQs | Revenue |
|---|---|---|
| Telecommunications | 2 | $23B |
|
||
| Utilities | 1 | $12B |
|
||
| Wholesale / Distribution | 1 | $5B |
|
||
| Advertising | 1 | $2B |
|
||
Price history
+25.1% since first listed12 events — show timeline
- 2026-02-20 Listed $49,900 GBRMLS
- 2026-02-20 Listed $49,900 AcadianaMLS
- 2024-12-11 Listed $70,000 GBRMLS
- 2024-12-11 Delisted — GBRMLS
- 2024-02-15 Listed $70,000 AcadianaMLS
- 2024-02-15 Listed $70,000 GBRMLS
- 2017-09-08 Sold (Public Records) $3,211 Public Records
- 2008-08-14 Listed $58,900 AcadianaMLS
- 2008-08-14 Listed $58,900 GBRMLS
- 2008-01-18 Listed $58,900 AcadianaMLS
- 2008-01-18 Listed $58,900 GBRMLS
- 1999-10-13 Listed $39,900 AcadianaMLS
Property tax history
+22.8%/yrLatest (2025): $703 · +4.7% YoY. Source: county tax records.
Cash-flow waterfall
monthlySold comps — $/sqft
last 12 mo · ≤1 miLoading sold comps…