8330 S Brighton Loop Rd · Brighton, UT
Flood risk 5/10 · Moderate
- FEMA flood zone
- X (unshaded)
- Chance of flooding over 30 yrs
- 0.66%
- Est. flood insurance / yr
- $507 – $1,088
Fire risk 5/10 · Moderate
- Est. fire insurance / yr
- $453 – $841
Heat risk 1/10 · Minimal
- Hot days now (above 78°F)
- 9 days/yr
- Hot days in 30 yrs
- 24 days/yr
Wind risk 1/10 · Minimal
- Chance of severe wind over 30 yrs
- —
Air-quality risk 2/10 · Minimal
- Unhealthy air days now
- 2 days/yr
- Unhealthy air days in 30 yrs
- 2 days/yr
Risk factors via First Street. Map © Google.
Why this score? — see what drove the C+ grade
The composite is a weighted blend of 9 inputs, each scored 0–100. Each bar is that input's sub-score; the figure is the points it added to the 100-point composite (weight × sub-score).
- Cash flow +25.9/30.0
- DSCR +8.7/10.0
- ARV discount +7.5/15.0
- 1% rule +6.9/10.0
- Schools +4.6/10.0
- Rent growth +2.6/5.0
- Livability +2.5/5.0
- Condition / age +2.5/5.0
- Appreciation +0.0/10.0
$199,000
🖨 Deal sheet (PDF) 📄 Offer letter ✓ Due diligence
Listing remarks
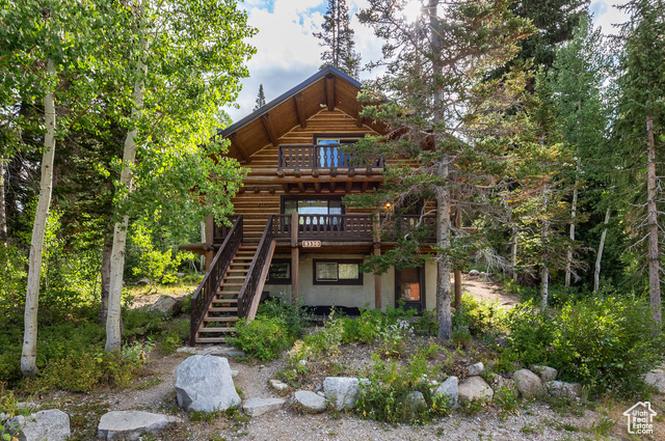
Here's your chance to Own a Ski property! This is a 1/8 fractional ownership of this Traditional Log cabin retreat on the Brighton Loop. You're literally steps from Brighton Ski Resort, so you can ski or snowboard without ever getting in your car. This 1/8 fractional ownership offers true mountain living with year round recreation right out your door. The Brighton Loop offers a unique mix of natural beauty and year-round outdoor access. Trails, ski lifts, and scenic views are all close by, and even though it feels tucked away, you're only about 3040 minutes from Salt Lake City. The log cabin is solidly built and thoughtfully updated, featuring an open-concept kitchen with granite countertop
Key facts
- Open-concept kitchen
- Granite countertops
- Ski property
Tags
Property features AI
Finance
- Other: Has view; Above-grade finished area reported
- HOA & community: Subdivision: RESERVE #4
Exterior
- Parking: 4 total parking spaces (4 open)
- Utilities: Natural gas connected; Electricity connected; Public sewer connected; Culinary (public) water connected
- Home design: Cabin-style home; Fractional ownership; Used for recreational purposes; Built in 2007
- Construction: Log construction; Metal roof; Built/standing condition
- Exterior features: Balcony; Covered deck; Open patio; Double-pane windows; Mountain view; Wooded lot with mature trees; Mountain terrain
Interior
- Kitchen: Disposal; Free-standing range/oven; Granite countertops
- Bedrooms: 1 main-level bedroom
- Flooring: Carpet; Linoleum
- Bathrooms: 2 full bathrooms
- Heating & cooling: Forced air heating (gas central); Natural ventilation cooling
- Interior features: Disposal; Free-standing range/oven; Granite countertops; Drapes
Neighborhood map
What this means for you Summary
Snapshot
- This is a 3-bed/2.0-bath other listed at $199k.
Deal economics
- At list price, monthly cash flow is $488 ($6k/yr) — positive.
- The deal already cash-flows at list — no discount required.
- Meets the 1% rule at list price ($2k rent vs $199k).
- Recommended offer: $175k (12.0% below list) — sets the bar for market timing.
Location & tenants
- Location reads: area grade C — affects rentability + tenant quality, not the cash-flow math above.
- Canyons District (suburban): math 49% / reading 53% proficiency, ranked #12 of 80 in UT (top 15%) — acceptable for families but not a draw, mixed tenant base, ~2y average lease.
- Zoned schools: Butler School (math 68% / reading 64%, grade B+, #20 of 585 statewide, top 3%, 605 students, 14% FRL); Butler Middle (math 58% / reading 64%, grade B+, #5 of 138 statewide, top 3%, 895 students, 18% FRL); Brighton High (math 38% / reading 69%, grade C-, #19 of 171 statewide, top 11%, 2,360 students, 14% FRL).
- Market conditions: Rents flat; 212 active listings in the ZIP; high-income renter base; 4,970 units permitted in Salt Lake County in 2024 (1,963 in 5+ unit buildings).
Forward outlook
- Local home prices are declining (-3.0%/yr); year-one equity from $1k of loan paydown is wiped out by about $6k of value loss. Plan a longer hold.
- Salt Lake County population projected at +37% by 2050 — long-run rental-demand tailwind backs the buy-and-hold thesis.
Negotiation context
- It's been on market 439 days — a 12% lower offer ($175k) is reasonable based on typical stale-listing flexibility.
- 2 sale attempts; this cycle's ask has dropped $201k (50%) from the opening price — seller is motivated, your offer sets the floor, not the list.
Risks & watch-outs
- Climate carrying-cost: moderate flood risk; moderate wildfire risk — expect insurance premiums to compound above CPI over the hold.
Questions for the listing agent
- It's been on market 439 days. Have you received any prior offers? Is the seller open to a 12% concession, seller financing, or rate buy-down credit?
- Built in 1976 — when were the roof, HVAC, electrical panel, plumbing, and water heater last replaced?
- Why hasn't it sold? Are there any deal-killer items the seller is aware of (foundation, flood, title, zoning, code violations)?
- Is there a deadline driving the sale (1031 exchange, divorce, estate, relocation)? That informs how much negotiation room exists.
- What's the average days-on-market for RENTAL listings here right now (not sales)? A rising rental-DOM trend means longer vacancies and softer asking-rent achievability than the comps imply.
- What's the recent tenant-quality profile in this submarket — average credit score on applications, eviction rate, late-payment / NSF rate, and stable-employment percentage? A property-management company in the area should have these aggregated.
- How much new for-sale + rental construction is in the pipeline within 1–3 miles? Heavy new supply typically softens prices + rents 12–24 months out; constrained supply supports both.
Investment metrics
- 1% rule
- 1.19% ✓
- Cap rate
- 9.24%
- Cash-on-cash
- 10.52%
- DSCR
- 1.47
- GRM
- 7.0
CMA / ARV
No comps found within radius.
Projected returns pro-forma
-3.0% appreciation · 0.54% rent growth · sell at horizon
- IRR
- -3.3%
- Equity multiple
- 0.88×
- Total profit
- $-6,812
- Equity at exit
- $29,672
- IRR
- 3.3%
- Equity multiple
- 1.22×
- Total profit
- $11,997
- Equity at exit
- $17,206
Cash invested: $55,720 (down + closing). Projections, not guarantees.
Landlord ↔ Tenant lean methodology
- Overall (STATE)
- 86 Strongly Landlord-Friendly
- State Utah
- 86 Strongly Landlord-Friendly · R+15
- County
- — inherits STATE
- City
- — inherits STATE
ZIP-level market 84121
- Rents YoY
- 0.5%
- Active inventory
- 212
- Price-to-rent
- 7.0×
Monthly cashflow live
- Estimated rent
- $2,359 medium interval (Pro) →
- Mortgage (P&I)
- −$1,044
- Tax est. 1.5%
- −$249 /mo · $2,985/yr
- Insurance
- −$83
- HOA
- −$0
- Vacancy / Maint / Mgmt
- −$495
- Net cashflow
- $488
Break-even live
Sensitivity live
| Price | -10% $626 | -5% $557 | +0% $488 | +5% $420 | +10% $351 |
|---|---|---|---|---|---|
| Rent | -10% $302 | -5% $395 | +0% $488 | +5% $581 | +10% $675 |
| Rate | -1.0pp $588 | -0.5pp $539 | base $488 | +0.5pp $437 | +1.0pp $384 |
UW: 25.0% down · 7.5% · 30yr · 1.5% tax · 5.0% vac · 8.0% maint · 8.0% mgmt
Financing live
Cash to close
- Down payment
- $49,750
- Closing costs
- $5,970
- Reserves months
- —
- Total cash needed
- —
Loan-product check · same deal, 3 products live
Conventional
25% down · 7.5% · 30yr
- Down + closing
- —
- Monthly P&I
- —
- Monthly cashflow
- —
- DSCR
- —
- Eligible?
- —
Personal DTI + credit; lowest rate.
DSCR
20% down · 8.5% · 30yr
- Down + closing
- —
- Monthly P&I
- —
- Monthly cashflow
- —
- DSCR
- —
- Eligible?
- —
No personal income docs; deal must DSCR.
Hard money
10% down · 12.0% · 12mo
- Down + closing
- —
- Monthly P&I
- —
- Monthly cashflow
- —
- DSCR
- —
- Eligible?
- —
Short-term bridge; refi at stabilization.
Listing history 23 events
-
2026-06-22days on market $199,000 Active 439 DOM
-
2026-06-18days on market $199,000 Active 436 DOM
-
2026-06-17days on market $199,000 Active 435 DOM
-
2026-06-16days on market $199,000 Active 434 DOM
-
2026-06-15days on market $199,000 Active 433 DOM
-
2026-06-13days on market $199,000 Active 431 DOM
-
2026-06-09days on market $199,000 Active 427 DOM
-
2026-06-08days on market $199,000 Active 426 DOM
-
2026-06-07days on market $199,000 Active 425 DOM
-
2026-06-05days on market $199,000 Active 422 DOM
-
2026-06-03days on market $199,000 Active 421 DOM
-
2026-06-02pricedays on market $199,000 Active 420 DOM
-
2026-06-01days on market $250,000 Active 419 DOM
-
2026-05-31days on market $250,000 Active 418 DOM
-
2026-03-05price $250,000
-
2026-03-05status Active
-
2026-03-01historical
-
2026-02-10price $275,000
-
2025-08-28price $299,900
-
2025-07-01price $320,000
-
2025-05-07price $350,000
-
2025-04-10price $369,000
-
2025-04-04$400,000 Active
ⓘ Source: listings_history table (triggers on properties + properties_extension) + one-shot
backfill from property_details.listing_events for pre-trigger history.
Climate risk First Street
- Flood 5/10 Major FEMA zone X (unshaded) · 66% chance over 30 yrs
- Wildfire 5/10 Major
- Heat 1/10 Low 9 d/yr ≥78°F today · 24 d/yr by 30 yrs out
- Wind 1/10 Low
- Air quality 2/10 Low 2 unhealthy d/yr today · 2 by 30 yrs out
Nearby sold comps map
Loading sold comps map…
Walkable amenities ~0.75 mi
Loading nearby amenities…
Taxation est. · year 1
- Rental income
- $28,307
- − Mortgage interest
- −$11,147
- − Property taxes
- −$2,985
- − Insurance
- −$995
- − Repairs & maintenance
- −$2,265
- − Management
- −$2,265
- − Depreciation
- −$5,789
- Taxable income
- $2,861
- Est. tax owed @ 24.0%
- −$687
- After-tax cash flow
- $5,173/yr
For passive investors: Depreciation is non-cash, so a rental often shows a tax loss while cash-flowing — sheltering income. Rental losses are passive: they offset passive income freely, and up to $25,000/yr can offset ordinary (W-2) income if you actively participate and your MAGI is under $100k (phasing out to $0 by $150k); unused losses carry forward. On sale, claimed depreciation is recaptured at up to 25%, and gains may owe capital-gains tax (a 1031 exchange can defer both). Figures are a year-1 estimate at your 24.0% rate — not tax advice; consult a CPA.
Schools (NCES district)
- District
- Canyons District
- NCES district ID
- 4900142
- Math proficiency
- 49% ▼ -5.00%
- Reading proficiency
- 53% ▼ -3.00%
- Median HH income
- $74,107
- Composite
- 45.91/100
- National rank
- #2548
- State rank
- #12 of 80 in UT
Livability — Brighton
No livability data for this city. (Only ~50 U.S. cities are tracked.)
Census & demographics
- Census place
- Brighton, UT
- County
- Salt Lake County · 1,195,750 people
- Metro
- Salt Lake City, UT
- Population (ZIP)
- 38,912
- Household income
- $115,515
- Rent vs Own
- Severe rent burden
- 713.0
Population outlook (Salt Lake County) Hauer SSP2
- Today (2025)
- 1,305,860 people
- By 2030
- 1,402,611 · +7.4%
- By 2040
- 1,594,533 · +22.1%
- By 2050
- 1,787,244 · +36.9%
- By 2075
- 2,224,138 · +70.3%
- By 2100
- 2,551,390 · +95.4%
Race, ethnicity, and origin ACS 2023
- Neighborhood character
- Predominantly White (84%)
- Race & ethnicity
- White 84% Hispanic / Latino 7% Two or more races 6% Asian 4%
- Hispanic origin (detail)
- Mexican 4%
- Common ancestry
- Slovak 5% Italian 3% Portuguese 3%
- Foreign-born
- 7% · Canada, China
- Languages at home
- 90% English-only · Spanish 3% Other Indo-European 2% Chinese 1%
Political lean MEDSL · Salt Lake
- 2024 margin
- D (+10.2) · D 53.7% · R 43.5% · Other 2.8%
- 2008→2024 swing
- +10.1pp toward D · 2008: 0.1pp · 2024: 10.2pp
- All cycles
- 2024: D+10.2 2020: D+11.0 2016: D+10.2 2012: R+19.3 2008: D+0.1
Not yet ingested
- Civics
- —
Market trends
- HPI YoY
- ▼ -604.71%
- Current HPI
- 315.128
- Rent YoY
- ▲ 0.54%
- Metro
- Salt Lake City, UT
- State GDP YoY
- ▲ 3.54%
- F500 in state
- 2
Industry mix (Fortune 500 HQ in UT)
| Industry | F500 HQs | Revenue |
|---|---|---|
| Financial Services | 1 | $3B |
|
||
Price history
-37.5% since first listed9 events — show timeline
- 2026-03-05 Price Changed $250,000 WFRMLS
- 2026-03-05 Relisted — WFRMLS
- 2026-03-01 Listing Removed — WFRMLS
- 2026-02-10 Price Changed $275,000 WFRMLS
- 2025-08-28 Price Changed $299,900 WFRMLS
- 2025-07-01 Price Changed $320,000 WFRMLS
- 2025-05-07 Price Changed $350,000 WFRMLS
- 2025-04-10 Price Changed $369,000 WFRMLS
- 2025-04-04 Listed $400,000 WFRMLS
Cash-flow waterfall
monthlySold comps — $/sqft
last 12 mo · ≤1 miLoading sold comps…