188 Pleasure Dr · Flanders, NY
Flood risk 1/10 · Minimal
- FEMA flood zone
- X (unshaded)
- Chance of flooding over 30 yrs
- 0.0%
- Est. flood insurance / yr
- $473 – $860
Fire risk 5/10 · Moderate
- Est. fire insurance / yr
- $691 – $1,283
Heat risk 4/10 · Minor
- Hot days now (above 90°F)
- 7 days/yr
- Hot days in 30 yrs
- 17 days/yr
Wind risk 8/10 · Major
- Chance of severe wind over 30 yrs
- 80.0%
Air-quality risk 3/10 · Minor
- Unhealthy air days now
- 2 days/yr
- Unhealthy air days in 30 yrs
- 3 days/yr
Risk factors via First Street. Map © Google.
Why this score? — see what drove the D- grade
The composite is a weighted blend of 9 inputs, each scored 0–100. Each bar is that input's sub-score; the figure is the points it added to the 100-point composite (weight × sub-score).
- Cash flow +11.4/30.0
- ARV discount +7.5/15.0
- Schools +3.6/10.0
- DSCR +3.3/10.0
- Livability +2.8/5.0
- Rent growth +2.5/5.0
- Condition / age +2.5/5.0
- 1% rule +2.2/10.0
- Appreciation +0.0/10.0
$1,299,000
🖨 Deal sheet 📄 Offer letter ✓ Due diligence
Listing remarks
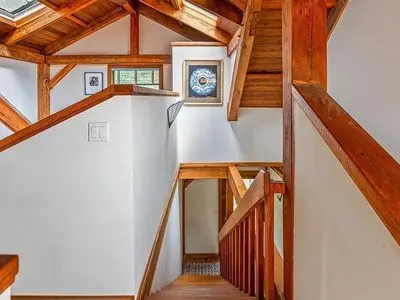
Unique Post and Beam solid Oak construction. 35 foot high ceilings. Plenty of light via sky lights . Seclusion back of Sears Bellows Park. (2) horse approval. Plenty of room for pool/Tennis court . Must see.
Key facts
- High ceilings
- Seclusion
- Room for pool
Tags
Neighborhood map
What this means for you Summary
Snapshot
- This is a 2-bed/2.0-bath single-family listed at $1.30M.
Deal economics
- At list price, monthly cash flow is $-452 ($-5k/yr) — negative.
- To cash-flow at today's rent, offer at most $1.22M (6.1% below list).
- To meet the 1% rule (rent ≥ 1% of price), the offer needs to be $937k (27.8% below list).
- Recommended offer: $937k (27.8% below list) — sets the bar for 1% rule.
Location & tenants
- Location reads 56/100 on livability (#1,107 in NY) — a working-class tenant base; expect higher turnover. Strengths: employment A+, housing A+; Watch: schools F, amenities F, commute F.
- Riverhead Central School District (suburban): math 34% / reading 48% proficiency, ranked #489 of 590 in NY (top 83%) — families likely to look elsewhere, expect single-tenant / working-renter base with shorter leases.
- Market conditions: 188 active listings in the ZIP; 2 comparable units currently listed for rent nearby; 1,366 units permitted in Suffolk County in 2024 (216 in 5+ unit buildings).
Forward outlook
- Local home prices are declining (-3.0%/yr); year-one equity from $9k of loan paydown is wiped out by about $39k of value loss. Plan a longer hold.
- Suffolk County population projected to shrink 5% by 2050 — rents likely to lag national; underwrite the cash flow, not the appreciation.
Negotiation context
- It's been on market 23 days — a 2% lower offer ($1.28M) is reasonable based on typical stale-listing flexibility.
Risks & watch-outs
- Climate carrying-cost: severe wind risk, 80% chance of damaging wind over 30y; moderate wildfire risk — expect insurance premiums to compound above CPI over the hold.
Questions for the listing agent
- What do current leases actually rent for vs. the listed asking? Can we see a recent rent roll and the last 12 months of T-12 income?
- Is there a deadline driving the sale (1031 exchange, divorce, estate, relocation)? That informs how much negotiation room exists.
- Schools are F-rated, which usually means shorter tenancies and higher turnover. Who's the typical renter profile here, and what's been the actual vacancy rate?
- The area grade is low — what's the realistic commute time and amenity access for the typical tenant pool here? Any planned neighborhood developments (good or bad) we should know about?
- What's the average days-on-market for RENTAL listings here right now (not sales)? A rising rental-DOM trend means longer vacancies and softer asking-rent achievability than the comps imply.
- What's the recent tenant-quality profile in this submarket — average credit score on applications, eviction rate, late-payment / NSF rate, and stable-employment percentage? A property-management company in the area should have these aggregated.
- How much new for-sale + rental construction is in the pipeline within 1–3 miles? Heavy new supply typically softens prices + rents 12–24 months out; constrained supply supports both.
Investment metrics
- 1% rule
- 0.72% ✗
- Cap rate
- 5.88%
- Cash-on-cash
- -1.49%
- DSCR
- 0.93
- GRM
- 11.5
CMA / ARV
No comps found within radius.
Projected returns pro-forma
-3.0% appreciation · 3.0% rent growth · sell at horizon
- IRR
- -18.8%
- Equity multiple
- 0.34×
- Total profit
- $-239,816
- Equity at exit
- $193,685
- IRR
- -11.4%
- Equity multiple
- 0.32×
- Total profit
- $-248,101
- Equity at exit
- $112,314
Cash invested: $363,720 (down + closing). Projections, not guarantees.
Landlord ↔ Tenant lean methodology
- Overall (STATE)
- 15 Strongly Tenant-Friendly
- State New York
- 15 Strongly Tenant-Friendly · D+10
- County
- — inherits STATE
- City
- — inherits STATE
ZIP-level market 11901
- Home prices YoY
- -29.5%
- Active inventory
- 188
- Price-to-rent
- 11.5×
Monthly cashflow live
- Estimated rent
- $9,375 medium interval (Pro) →
- Mortgage (P&I)
- −$6,812
- Tax from tax record
- −$505 /mo · $6,055/yr
- Insurance
- −$541
- HOA
- −$0
- Vacancy / Maint / Mgmt
- −$1,969
- Net cashflow
- $-452
Break-even live
UW: 25.0% down · 7.5% · 30yr · 1.5% tax · 5.0% vac · 8.0% maint · 8.0% mgmt
Financing live
Cash to close
- Down payment
- $324,750
- Closing costs
- $38,970
- Reserves months
- —
- Total cash needed
- —
Loan-product check · same deal, 3 products live
Conventional
25% down · 7.5% · 30yr
- Down + closing
- —
- Monthly P&I
- —
- Monthly cashflow
- —
- DSCR
- —
- Eligible?
- —
Personal DTI + credit; lowest rate.
DSCR
20% down · 8.5% · 30yr
- Down + closing
- —
- Monthly P&I
- —
- Monthly cashflow
- —
- DSCR
- —
- Eligible?
- —
No personal income docs; deal must DSCR.
Hard money
10% down · 12.0% · 12mo
- Down + closing
- —
- Monthly P&I
- —
- Monthly cashflow
- —
- DSCR
- —
- Eligible?
- —
Short-term bridge; refi at stabilization.
Rent comps 2 comps
| Address | Beds | Baths | Sqft | Rent | $/sqft | DOM | Units | Dist |
|---|---|---|---|---|---|---|---|---|
| 420 Maple Ave S Riverhead, NY | 3.0 | 3.0 | 1710 | $11,000 | $6.43 | 24d | 1 | 0.44mi |
| 42 Pine Ave Riverhead, NY | 2.0 | 2.0 | 1568 | $4,100 | $2.61 | 24d | 1 | 1.32mi |
Listing history 14 events
-
2026-06-18days on market $1,299,000 Active 23 DOM
-
2026-06-17days on market $1,299,000 Active 22 DOM
-
2026-06-16days on market $1,299,000 Active 21 DOM
-
2026-06-15days on market $1,299,000 Active 20 DOM
-
2026-06-13days on market $1,299,000 Active 18 DOM
-
2026-06-09days on market $1,299,000 Active 14 DOM
-
2026-06-08days on market $1,299,000 Active 13 DOM
-
2026-06-07days on market $1,299,000 Active 12 DOM
-
2026-06-04days on market $1,299,000 Active 9 DOM
-
2026-06-03days on market $1,299,000 Active 8 DOM
-
2026-06-02days on market $1,299,000 Active 7 DOM
-
2026-06-01days on market $1,299,000 Active 6 DOM
-
2026-05-31days on market $1,299,000 Active 5 DOM
-
2026-05-26$1,299,000 Active
ⓘ Source: listings_history table (triggers on properties + properties_extension) + one-shot
backfill from property_details.listing_events for pre-trigger history.
Tax reassessment forecast NY · Partial reset (capped growth)
- Current annual tax
- $6,055 · $505/mo
- Projected year-2 tax
- $14,004 · $1,167/mo
- Expected delta
- +$7,949/yr (+$662/mo · 131.3%)
ⓘ Screening estimate from a state-policy table — verify with the county assessor before closing.
Climate risk First Street
- Flood 1/10 Low FEMA zone X (unshaded) · 0% chance over 30 yrs
- Wildfire 5/10 Major
- Heat 4/10 Moderate 7 d/yr ≥90°F today · 17 d/yr by 30 yrs out
- Wind 8/10 Severe 80% chance of damaging wind over 30 yrs
- Air quality 3/10 Moderate 2 unhealthy d/yr today · 3 by 30 yrs out
Nearby sold comps map
Loading sold comps map…
Walkable amenities ~0.75 mi
Loading nearby amenities…
Taxation est. · year 1
- Rental income
- $112,499
- − Mortgage interest
- −$72,764
- − Property taxes
- −$6,055
- − Insurance
- −$6,495
- − Repairs & maintenance
- −$9,000
- − Management
- −$9,000
- − Depreciation
- −$37,789
- Taxable loss
- −$28,605
- Est. tax savings @ 24.0%
- +$6,865
- After-tax cash flow
- $1,443/yr
For passive investors: Depreciation is non-cash, so a rental often shows a tax loss while cash-flowing — sheltering income. Rental losses are passive: they offset passive income freely, and up to $25,000/yr can offset ordinary (W-2) income if you actively participate and your MAGI is under $100k (phasing out to $0 by $150k); unused losses carry forward. On sale, claimed depreciation is recaptured at up to 25%, and gains may owe capital-gains tax (a 1031 exchange can defer both). Figures are a year-1 estimate at your 24.0% rate — not tax advice; consult a CPA.
Schools (NCES district)
- District
- Riverhead Central School District
- NCES district ID
- 3624690
- Math proficiency
- 34% ▼ -4.00%
- Reading proficiency
- 48% ▲ 13.00%
- Median HH income
- $61,607
- Composite
- 36.38/100
- National rank
- #4683
- State rank
- #489 of 590 in NY
Livability — Flanders
- Score
- 56/100
- State rank
- #1107
- US rank
- #22674
Category grades
Schools grade is shown separately in the Schools card above.
Census & demographics
- Census place
- Flanders, NY
- Population (ZIP)
- 32,921
Population outlook (Suffolk County) Hauer SSP2
- Today (2025)
- 1,505,262 people
- By 2030
- 1,498,318 · -0.5%
- By 2040
- 1,471,101 · -2.3%
- By 2050
- 1,424,848 · -5.3%
- By 2075
- 1,337,157 · -11.2%
- By 2100
- 1,217,720 · -19.1%
Race, ethnicity, and origin ACS 2023
- Neighborhood character
- Diverse neighborhood (Simpson 0.63)
- Race & ethnicity
- White 52% Hispanic / Latino 29% Two or more races 14% Black 11% Asian 3%
- Hispanic origin (detail)
- Mexican 4%
- Common ancestry
- Romanian 8% Iranian 1% Portuguese 1%
- Foreign-born
- 25% · Canada, Jamaica
- Languages at home
- 68% English-only · Spanish 26% Other Indo-European 3% Russian/Polish/Slavic 2%
Political lean MEDSL · Suffolk
- 2024 margin
- Lean R (+10.0) · D 45.0% · R 55.0%
- 2008→2024 swing
- -16.0pp toward R · 2008: 6.0pp · 2024: -10.0pp
- All cycles
- 2024: R+10.0 2020: R+0.0 2016: R+8.2 2012: D+2.9 2008: D+6.0
Not yet ingested
- Civics
- —
Market trends
- HPI YoY
- ▼ -182.60%
- Current HPI
- 436.7781
- Rent YoY
- —
- Metro
- —
- State GDP YoY
- ▲ 2.60%
- F500 in state
- 92
Industry mix (Fortune 500 HQ in NY)
| Industry | F500 HQs | Revenue |
|---|---|---|
| Financial Services | 10 | $950B |
|
||
| Consumer Goods | 9 | $162B |
|
||
| Insurance | 4 | $225B |
|
||
| Telecommunications | 2 | $144B |
|
||
| Pharmaceuticals | 2 | $112B |
|
||
| Media / Entertainment | 2 | $69B |
|
||
Price history
1 event — show timeline
- 2026-05-26 Listed $1,299,000 FSBO.com
Property tax history
+0.9%/yrLatest (2022): $6,055 · +0.0% YoY. Source: county tax records.
Cash-flow waterfall
monthlySold comps — $/sqft
last 12 mo · ≤1 miLoading sold comps…