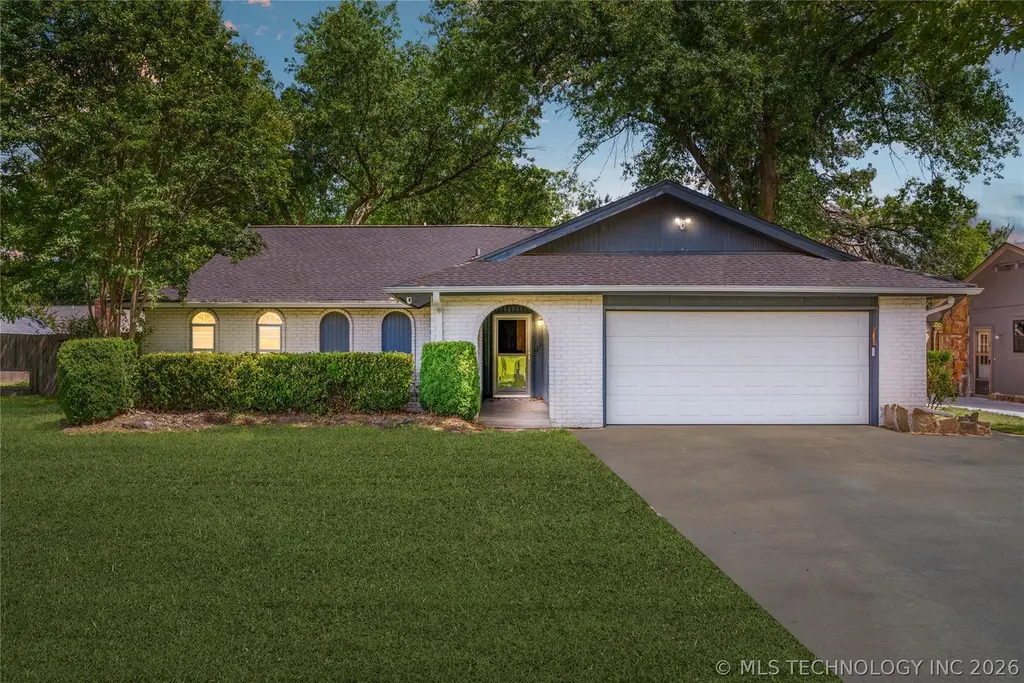
8205 S Birch Ave · Broken Arrow, OK
Flood risk 1/10 · Minimal
- FEMA flood zone
- X (unshaded)
- Chance of flooding over 30 yrs
- 0.0%
- Est. flood insurance / yr
- $473 – $860
Fire risk 5/10 · Moderate
- Est. fire insurance / yr
- $2,463 – $4,575
Heat risk 6/10 · Moderate
- Hot days now (above 111°F)
- 7 days/yr
- Hot days in 30 yrs
- 18 days/yr
Wind risk 3/10 · Minor
- Chance of severe wind over 30 yrs
- 4.0%
Air-quality risk 2/10 · Minimal
- Unhealthy air days now
- 1 days/yr
- Unhealthy air days in 30 yrs
- 1 days/yr
Risk factors via First Street. Map © Google.
Why this score? — see what drove the C- grade
The composite is a weighted blend of 9 inputs, each scored 0–100. Each bar is that input's sub-score; the figure is the points it added to the 100-point composite (weight × sub-score).
- Cash flow +19.7/30.0
- ARV discount +8.0/15.0
- DSCR +6.2/10.0
- 1% rule +4.9/10.0
- Livability +3.9/5.0
- Rent growth +3.5/5.0
- Condition / age +2.5/5.0
- Schools +2.4/10.0
- Appreciation +0.0/10.0
$245,000
🖨 Deal sheet 📄 Offer letter ✓ Due diligence
Listing remarks MLS
3/2/2 on 1/3 acre lot, ceramic tile wood look floors in living. Kitchen has granite counters – galley kitchen with breakfast bar and bay window. All beds have walk-ins. Hall bath was updated. 2nd living/flex/dining/office off living room. Vaulted living room with brick fireplace. Offering 1 yr warranty. Attic is floored, carpeted with lights.
Key facts
- Large bonus room
- 0.32 acre lot
- 2 garage spots
Tags
Property features AI
Finance
- HOA & community: Gutter(s) noted as community feature
Exterior
- Parking: Attached garage with storage, shelves and workshop; 2-car garage
- Security: Security system owned; Smoke detector(s); No safety shelter
- Utilities: Public water; Public sewer; Electricity available; Natural gas available; High speed internet available
- Home design: Single-story; Slab foundation; Has home warranty
- Construction: Brick and wood frame construction; Asphalt fiberglass roof; Built (year per public records)
- Exterior features: Concrete driveway; Covered patio and porch; Porch; Rain gutters; Satellite dish; Privacy fencing; Shed(s); Mature trees; Property faces west
Interior
- Kitchen: Granite counters; Eat-in kitchen with pantry; Dishwasher; Disposal; Microwave; Oven; Range; Stove; Refrigerator; Plumbed for ice maker; Electric oven/range connection; Gas range/oven connection
- Bedrooms: Master bedroom with private bath and walk-in closet (First floor); Bedroom with walk-in closet (First floor); Bedroom with walk-in closet (First floor)
- Flooring: Carpet; Tile; Wood veneer
- Bathrooms: Master bath: full, shower only (First floor); Hall full bath (First floor)
- Heating & cooling: Central heating (gas); Central air conditioning
- Interior features: Attic; Granite counters; High ceilings; Vaulted ceiling(s); Ceiling fan(s); High speed internet available; Cable TV; Wired for data; Storm door(s); Aluminum frame, insulated windows
- Laundry & utility: Utility room inside and separate (First floor); Washer hookup; Gas dryer hookup; Gas water heater
Neighborhood map
What this means for you Summary
Snapshot
- This is a 3-bed/2.0-bath single-family listed at $245k.
Deal economics
- At list price, monthly cash flow is $287 ($3k/yr) — positive.
- The deal already cash-flows at list — no discount required.
- To meet the 1% rule (rent ≥ 1% of price), the offer needs to be $241k (1.5% below list).
- Recommended offer: $241k (1.5% below list) — sets the bar for 1% rule.
- Cap rate 7.7% vs local median 4.0% in Broken Arrow — top-decile yield for the area; either an underpriced asset or a hidden risk that comps aren't pricing in. Stress-test before assuming the spread holds.
Location & tenants
- Location reads 78/100 on livability (#7 in OK, #2,691 nationally) — a middle-class / working-renter tenant base. Strengths: commute A+, cost of living A+, housing A+; Watch: schools D+, amenities F.
- Broken Arrow (suburban): math 23% / reading 28% proficiency, ranked #79 of 270 in OK (top 29%) — low school quality limits family demand, transient renter base, plan for 1-2y turnover.
- Market conditions: Rents rising fast (+4.1%/yr); 381 active listings in the ZIP; 5 comparable units currently listed for rent nearby; rentals leasing fast (median 3d on market — plan ~1-2 weeks tenant-placement turnaround); solid renter incomes; 2,818 units permitted in Tulsa County in 2024 (518 in 5+ unit buildings).
Forward outlook
- Local home prices are declining (-3.0%/yr); year-one equity from $2k of loan paydown is wiped out by about $7k of value loss. Plan a longer hold.
- Tulsa County population projected at +30% by 2050 — long-run rental-demand tailwind backs the buy-and-hold thesis.
Negotiation context
- Only 8 days on market — expect competitive offers; lowballing is unlikely to land.
- 5 sale attempts since 15y ago with the ask held roughly flat each time — persistent listings suggest the price (not the market) is what's stuck; bring a comps-based counter.
- Current owner paid $189k; 30% above their basis — modest negotiation headroom, anchor on the comps not their cost.
Risks & watch-outs
- Climate carrying-cost: moderate wildfire risk; extreme-heat days projected 7→18/yr by 2055 (HVAC capex compounding) — expect insurance premiums to compound above CPI over the hold.
Questions for the listing agent
- Built in 1972 — when were the roof, HVAC, electrical panel, plumbing, and water heater last replaced?
- Is there a deadline driving the sale (1031 exchange, divorce, estate, relocation)? That informs how much negotiation room exists.
- Schools are D-rated, which usually means shorter tenancies and higher turnover. Who's the typical renter profile here, and what's been the actual vacancy rate?
- What's the average days-on-market for RENTAL listings here right now (not sales)? A rising rental-DOM trend means longer vacancies and softer asking-rent achievability than the comps imply.
- What's the recent tenant-quality profile in this submarket — average credit score on applications, eviction rate, late-payment / NSF rate, and stable-employment percentage? A property-management company in the area should have these aggregated.
- How much new for-sale + rental construction is in the pipeline within 1–3 miles? Heavy new supply typically softens prices + rents 12–24 months out; constrained supply supports both.
Investment metrics
- 1% rule
- 0.99% ✗
- Cap rate
- 7.70%
- Cash-on-cash
- 5.02%
- DSCR
- 1.22
- GRM
- 8.5
CMA / ARV
- ARV (on-the-fly)
- $247,936
- Comps found
- 12
Show comp detail 12 sales within ~0.75 mi
| Address | Dist | Beds/Ba | Sqft | Sold | Price | $/sf | Match |
|---|---|---|---|---|---|---|---|
| 117 W Timberlane Ct | 0.13mi | 3/2.0 | 1,749 (+5%) | 2mo | $252,500 | $144 | 84 |
| 539 Meadowood Dr | 0.34mi | 3/2.0 | 1,711 (+3%) | 2mo | $272,000 | $159 | 78 |
| 7606 Glenwood Cir | 0.55mi | 3/2.0 | 1,634 (-2%) | 2mo | $245,000 | $150 | 69 |
| 8213 S Ash Ave | 0.13mi | 3/2.0 | 1,868 (+12%) | 6mo | $220,000 | $118 | 69 |
| 7737 S Park Ave | 0.55mi | 3/2.0 | 1,647 (-1%) | 5mo | $260,000 | $158 | 69 |
| 117 W Timberlane St | 0.17mi | 4/2.0 (+1) | 1,791 (+8%) | 9mo | $235,000 | $131 | 66 |
| 800 Millwood Rd | 0.22mi | 3/2.5 | 1,864 (+12%) | 7mo | $295,000 | $158 | 62 |
| 909 W Decatur St | 0.64mi | 3/2.0 | 1,678 (+1%) | 9mo | $250,000 | $149 | 61 |
| 809 W Glendale St | 0.43mi | 3/2.0 | 1,478 (-11%) | 4mo | $181,500 | $123 | 58 |
| 121 W Charlotte St | 0.46mi | 4/2.0 (+1) | 1,813 (+9%) | 10mo | $278,900 | $154 | 51 |
| 805 W Glenwood Ave | 0.59mi | 4/2.5 (+1) | 1,884 (+13%) | 4mo | $220,000 | $117 | 40 |
| 7005 S Birch Ave | 0.75mi | 4/2.5 (+1) | 1,902 (+14%) | 1mo | $269,200 | $142 | 33 |
Match score weights: distance 35% · size 25% · config 20% · recency 20%. Top-matched comps best support the ARV.
Projected returns pro-forma
-3.0% appreciation · 4.09% rent growth · sell at horizon
- IRR
- -7.3%
- Equity multiple
- 0.73×
- Total profit
- $-18,755
- Equity at exit
- $36,530
- IRR
- 3.5%
- Equity multiple
- 1.27×
- Total profit
- $18,396
- Equity at exit
- $21,183
Cash invested: $68,600 (down + closing). Projections, not guarantees.
Landlord ↔ Tenant lean methodology
- Overall (STATE)
- 83 Strongly Landlord-Friendly
- State Oklahoma
- 83 Strongly Landlord-Friendly · R+20
- County
- — inherits STATE
- City
- — inherits STATE
ZIP-level market 74011
- Rents YoY
- 4.1%
- Active inventory
- 381
- Price-to-rent
- 8.5×
Monthly cashflow live
- Estimated rent
- $2,414 high interval (Pro) →
- Mortgage (P&I)
- −$1,285
- Tax from tax record
- −$233 /mo · $2,794/yr
- Insurance
- −$102
- HOA
- −$0
- Vacancy / Maint / Mgmt
- −$507
- Net cashflow
- $287
Break-even live
UW: 25.0% down · 7.5% · 30yr · 1.5% tax · 5.0% vac · 8.0% maint · 8.0% mgmt
Financing live
Cash to close
- Down payment
- $61,250
- Closing costs
- $7,350
- Reserves months
- —
- Total cash needed
- —
Loan-product check · same deal, 3 products live
Conventional
25% down · 7.5% · 30yr
- Down + closing
- —
- Monthly P&I
- —
- Monthly cashflow
- —
- DSCR
- —
- Eligible?
- —
Personal DTI + credit; lowest rate.
DSCR
20% down · 8.5% · 30yr
- Down + closing
- —
- Monthly P&I
- —
- Monthly cashflow
- —
- DSCR
- —
- Eligible?
- —
No personal income docs; deal must DSCR.
Hard money
10% down · 12.0% · 12mo
- Down + closing
- —
- Monthly P&I
- —
- Monthly cashflow
- —
- DSCR
- —
- Eligible?
- —
Short-term bridge; refi at stabilization.
Rent comps 5 comps
| Address | Beds | Baths | Sqft | Rent | $/sqft | DOM | Units | Dist |
|---|---|---|---|---|---|---|---|---|
| 6308 S 1st Pl Broken Arrow, OK | 3.0 | 2.0 | 1600 | $3,400 | $2.12 | 15d | 1 | 1.04mi |
| 2008 W Huntsville Pl Broken Arrow, OK | 3.0 | 2.0 | 1568 | $2,100 | $1.34 | 2d | 1 | 1.22mi |
| 7313 S Walnut Ave Broken Arrow, OK | 3.0 | 2.0 | 1600 | $1,990 | $1.24 | 10d | 1 | 1.26mi |
| 2420 W Imperial Ct Broken Arrow, OK | 3.0 | 2.0 | 1726 | $2,415 | $1.40 | 1d | 1 | 1.49mi |
| 2421 W Imperial Ct Broken Arrow, OK | 3.0 | 2.0 | 1726 | $2,415 | $1.40 | 1d | 1 | 1.49mi |
Listing history 15 events
-
2026-05-18status Pending
-
2026-05-18status Active
-
2026-05-01status Pending
-
2026-04-23$245,000 Active
-
2021-02-26soldstatus $189,000
-
2021-02-25soldstatus $189,000 Closed 350-char remark
Show marketing remark (350 chars)
3/2/2 on 1/3 acre lot, ceramic tile wood look floors in living. Kitchen has granite counters – galley kitchen with breakfast bar and bay window. All beds have walk-ins. Hall bath was updated. 2nd living/flex/dining/office off living room. Vaulted living room with brick fireplace. Offering 1 yr warranty. Attic is floored, carpeted with lights.
-
2021-01-11status Pending 350-char remark
Show marketing remark (350 chars)
3/2/2 on 1/3 acre lot, ceramic tile wood look floors in living. Kitchen has granite counters – galley kitchen with breakfast bar and bay window. All beds have walk-ins. Hall bath was updated. 2nd living/flex/dining/office off living room. Vaulted living room with brick fireplace. Offering 1 yr warranty. Attic is floored, carpeted with lights.
-
2021-01-09$189,000 Active 350-char remark
Show marketing remark (350 chars)
3/2/2 on 1/3 acre lot, ceramic tile wood look floors in living. Kitchen has granite counters – galley kitchen with breakfast bar and bay window. All beds have walk-ins. Hall bath was updated. 2nd living/flex/dining/office off living room. Vaulted living room with brick fireplace. Offering 1 yr warranty. Attic is floored, carpeted with lights.
-
2012-07-05soldstatus $138,000
-
2012-06-29soldstatus $138,000 236-char remark
Show marketing remark (236 chars)
PRICE REDUCED! Top 10 in homes near Indian Springs golf course. Lrg living room w/ wood flrs. Updates include granite, tile & breakfast bar in kit, partial thermal windows. Large dining room w/ french doors leading to living room.
-
2012-05-22historical 236-char remark
Show marketing remark (236 chars)
PRICE REDUCED! Top 10 in homes near Indian Springs golf course. Lrg living room w/ wood flrs. Updates include granite, tile & breakfast bar in kit, partial thermal windows. Large dining room w/ french doors leading to living room.
-
2012-04-09$138,000 236-char remark
Show marketing remark (236 chars)
PRICE REDUCED! Top 10 in homes near Indian Springs golf course. Lrg living room w/ wood flrs. Updates include granite, tile & breakfast bar in kit, partial thermal windows. Large dining room w/ french doors leading to living room.
-
2012-03-29historical
-
2011-09-28$141,000
-
1987-02-09soldstatus $59,000
ⓘ Source: listings_history table (triggers on properties + properties_extension) + one-shot
backfill from property_details.listing_events for pre-trigger history.
Tax reassessment forecast OK · Resets to sale price
- Current annual tax
- $2,794 · $233/mo
- Projected year-2 tax
- $2,794 · $233/mo
- Expected delta
- $0/yr ($0/mo · 0.0%)
ⓘ Screening estimate from a state-policy table — verify with the county assessor before closing.
Climate risk First Street
- Flood 1/10 Low FEMA zone X (unshaded) · 0% chance over 30 yrs
- Wildfire 5/10 Major
- Heat 6/10 Major 7 d/yr ≥111°F today · 18 d/yr by 30 yrs out
- Wind 3/10 Moderate 4% chance of damaging wind over 30 yrs
- Air quality 2/10 Low 1 unhealthy d/yr today · 1 by 30 yrs out
Nearby sold comps map
Loading sold comps map…
Walkable amenities ~0.75 mi
Loading nearby amenities…
Taxation est. · year 1
- Rental income
- $28,963
- − Mortgage interest
- −$13,724
- − Property taxes
- −$2,794
- − Insurance
- −$1,225
- − Repairs & maintenance
- −$2,317
- − Management
- −$2,317
- − Depreciation
- −$7,127
- Taxable loss
- −$541
- Est. tax savings @ 24.0%
- +$130
- After-tax cash flow
- $3,574/yr
For passive investors: Depreciation is non-cash, so a rental often shows a tax loss while cash-flowing — sheltering income. Rental losses are passive: they offset passive income freely, and up to $25,000/yr can offset ordinary (W-2) income if you actively participate and your MAGI is under $100k (phasing out to $0 by $150k); unused losses carry forward. On sale, claimed depreciation is recaptured at up to 25%, and gains may owe capital-gains tax (a 1031 exchange can defer both). Figures are a year-1 estimate at your 24.0% rate — not tax advice; consult a CPA.
Schools (NCES district)
- District
- Broken Arrow
- NCES district ID
- 4005490
- Math proficiency
- 23% ▼ -9.00%
- Reading proficiency
- 28% ▼ -9.00%
- Median HH income
- $64,646
- Composite
- 23.86/100
- National rank
- #7801
- State rank
- #79 of 270 in OK
Livability — Broken Arrow
- Score
- 78/100
- State rank
- #7
- US rank
- #2691
Category grades
Schools grade is shown separately in the Schools card above.
Census & demographics
- Census place
- Broken Arrow, OK
- County
- Tulsa County · 640,811 people
- City population
- 144,172
- Metro
- Tulsa, OK
- Population (ZIP)
- 33,900
- Household income
- $99,157
- Rent vs Own
- Severe rent burden
- 389.0
Population outlook (Tulsa County) Hauer SSP2
- Today (2025)
- 723,846 people
- By 2030
- 766,033 · +5.8%
- By 2040
- 851,386 · +17.6%
- By 2050
- 938,389 · +29.6%
- By 2075
- 1,166,011 · +61.1%
- By 2100
- 1,350,277 · +86.5%
Race, ethnicity, and origin ACS 2023
- Neighborhood character
- Predominantly White (68%)
- Race & ethnicity
- White 68% Two or more races 15% Hispanic / Latino 10% Native American 4% Black 4% Asian 3%
- Hispanic origin (detail)
- Mexican 7%
- Common ancestry
- Lithuanian 3% Serbian 2% Slovak 2%
- Foreign-born
- 5% · Canada
- Languages at home
- 93% English-only · Spanish 5% Other Asian/Pacific 1%
Political lean MEDSL · Tulsa
- 2024 margin
- R (+15.2) · D 41.3% · R 56.5% · Other 2.2%
- 2008→2024 swing
- +9.2pp toward D · 2008: -24.5pp · 2024: -15.2pp
- All cycles
- 2024: R+15.2 2020: R+15.6 2016: R+22.9 2012: R+27.4 2008: R+24.5
Not yet ingested
- Civics
- —
Market trends
- HPI YoY
- ▼ -180.15%
- Current HPI
- 210.8302
- Rent YoY
- ▲ 4.09%
- Metro
- Tulsa, OK
- State GDP YoY
- ▲ 1.55%
- F500 in state
- 6
Industry mix (Fortune 500 HQ in OK)
| Industry | F500 HQs | Revenue |
|---|---|---|
| Energy | 3 | $48B |
|
||
Price history
+315.3% since first listed15 events — show timeline
- 2026-05-18 Pending — MLS Technology, Inc.
- 2026-05-18 Relisted — MLS Technology, Inc.
- 2026-05-01 Pending — MLS Technology, Inc.
- 2026-04-23 Listed $245,000 MLS Technology, Inc.
- 2021-02-26 Sold (Public Records) $189,000 Public Records
- 2021-02-25 Sold (MLS) $189,000 MLS Technology, Inc.
- 2021-01-11 Pending — MLS Technology, Inc.
- 2021-01-09 Listed $189,000 MLS Technology, Inc.
- 2012-07-05 Sold (Public Records) $138,000 Public Records
- 2012-06-29 Sold (MLS) $138,000 MLS Technology, Inc.
- 2012-05-22 Listing Removed — MLS Technology, Inc.
- 2012-04-09 Listed $138,000 MLS Technology, Inc.
- 2012-03-29 Listing Removed — MLS Technology, Inc.
- 2011-09-28 Listed $141,000 MLS Technology, Inc.
- 1987-02-09 Sold (Public Records) $59,000 Public Records
Property tax history
+3.1%/yrLatest (2025): $2,794 · +3.0% YoY. Source: county tax records.
Cash-flow waterfall
monthlySold comps — $/sqft
last 12 mo · ≤1 miLoading sold comps…