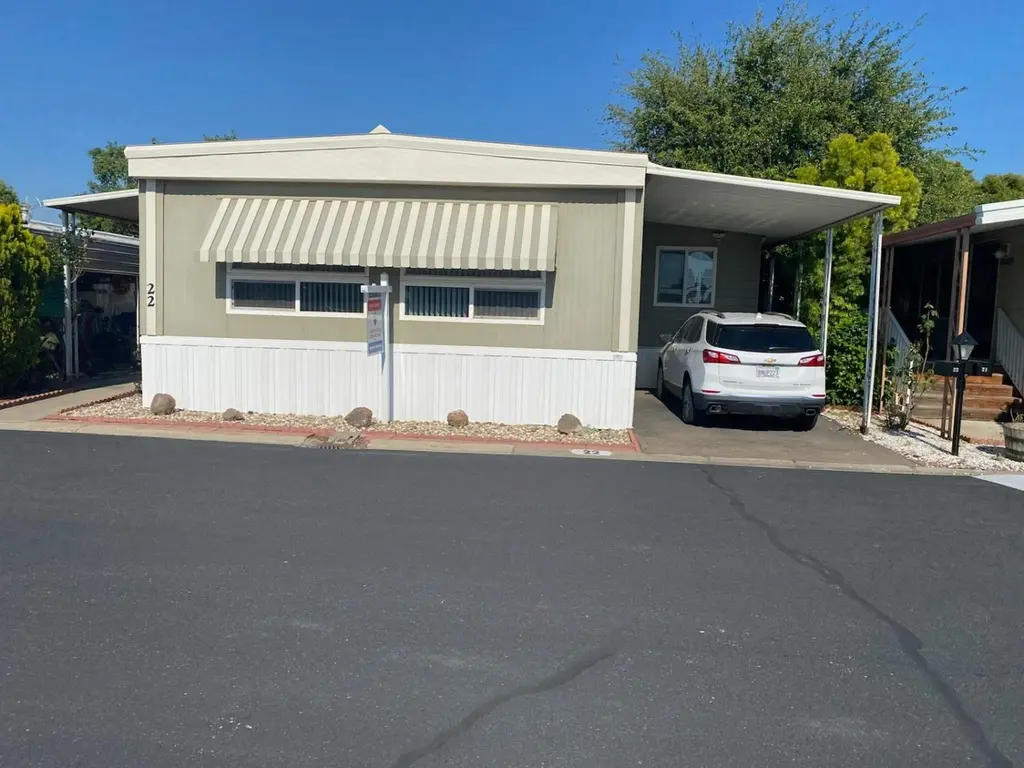
150 Pestana Ave #22 · Manteca, CA
Flood risk 1/10 · Minimal
- FEMA flood zone
- X (unshaded)
- Chance of flooding over 30 yrs
- 0.0%
- Est. flood insurance / yr
- $507 – $1,088
Fire risk 6/10 · Moderate
- Est. fire insurance / yr
- $659 – $1,223
Heat risk 7/10 · Major
- Hot days now (above 102°F)
- 7 days/yr
- Hot days in 30 yrs
- 15 days/yr
Wind risk 1/10 · Minimal
- Chance of severe wind over 30 yrs
- —
Air-quality risk 10/10 · Severe
- Unhealthy air days now
- 30 days/yr
- Unhealthy air days in 30 yrs
- 31 days/yr
Risk factors via First Street. Map © Google.
Why this score? — see what drove the B grade
The composite is a weighted blend of 9 inputs, each scored 0–100. Each bar is that input's sub-score; the figure is the points it added to the 100-point composite (weight × sub-score).
- Cash flow +30.0/30.0
- 1% rule +10.0/10.0
- DSCR +10.0/10.0
- ARV discount +8.2/15.0
- Condition / age +4.0/5.0
- Livability +3.1/5.0
- Schools +2.9/10.0
- Rent growth +2.3/5.0
- Appreciation +0.0/10.0
$130,000
🖨 Deal sheet 📄 Offer letter ✓ Due diligence
Listing remarks
Beautiful Double wide in Fabulous 55+ Almond Blossom Park. This wonderful home has 2 bedrooms, 2 baths with a 250 S. F. add on that is perfect for Office, Craft room or 3rd Bedroom. Large Living and Dining room with Updated kitchen that has beautiful white Cabinets. Washer and Dryer and Refrigerator stay with home. Wonderful Covered Front Porch for morning coffee or evening wine. Wonderful Park with friendly residents that have activities and Pot Lucks along with Beautiful new Gym and a large swimming pool and pickle ball courts for summer fun! Don't miss this wonderful opportunity.
Key facts
- Covered front porch
- Double wide
- New gym
Tags
Property features AI
Finance
- Other: Part of a community with 138 units; Directions: Yosemite to Pestana to first right into park
- Financial info: Land lease: No
- HOA & community: No association
Exterior
- Parking: Covered parking
- Utilities: Public water; Public sewer; Cable available; Internet available; 220V in laundry
- Home design: Manufactured home in park; Double-wide; Updated/remodeled; Built in 1969; Located in a senior community
- Construction: Guerdon make
- Exterior features: Metal roof; Aluminum skirting; Regular-shaped lot
Interior
- Kitchen: Hood over range; Dishwasher; Disposal; Microwave
- Bedrooms: 2 bedrooms (possible 3)
- Flooring: Carpet; Linoleum
- Bathrooms: 2 full bathrooms; Tub with shower over
- Heating & cooling: Central heating; Central air conditioning
- Interior features: Covered patio; Great room; Breakfast area; Dining/Living combo; Bonus room
- Laundry & utility: Washer included; Dryer included
Neighborhood map
What this means for you Summary
Snapshot
- This is a 2-bed/2.0-bath manufactured listed at $130k. Condition is rated good.
Deal economics
- At list price, monthly cash flow is $884 ($11k/yr) — positive.
- The deal already cash-flows at list — no discount required.
- Meets the 1% rule at list price ($2k rent vs $130k).
- Recommended offer: $126k (3.0% below list) — sets the bar for market timing.
- Cap rate 14.4% vs local median 2.7% in Manteca — top-decile yield for the area; either an underpriced asset or a hidden risk that comps aren't pricing in. Stress-test before assuming the spread holds.
Location & tenants
- Location reads 61/100 on livability (#535 in CA) — a middle-class / working-renter tenant base. Strengths: housing A+, employment A; Watch: schools D+, amenities D, commute F.
- Manteca Unified (suburban): math 15% / reading 48% proficiency, ranked #297 of 517 in CA (top 57%) — families likely to look elsewhere, expect single-tenant / working-renter base with shorter leases.
- Market conditions: Rents soft (-0.7%/yr); 270 active listings in the ZIP; 9 comparable units currently listed for rent nearby; rentals at typical pace (median 19d on market — plan ~3-4 weeks tenant-placement turnaround); solid renter incomes; 3,779 units permitted in San Joaquin County in 2024 (0 in 5+ unit buildings).
- This rent runs 30% of the median local income ($89k/yr) — at the standard rent-burdened threshold; future hikes will face affordability resistance.
Forward outlook
- Local home prices are declining (-3.0%/yr); year-one equity from $899 of loan paydown is wiped out by about $4k of value loss. Plan a longer hold.
- San Joaquin County population projected at +17% by 2050 — long-run rental-demand tailwind backs the buy-and-hold thesis.
- At projected returns (-3.0% appreciation + 0.0% rent growth), your $36k cash investment doubles in ~5 years — after that, you're playing with house money.
Negotiation context
- It's been on market 42 days — a 3% lower offer ($126k) is reasonable based on typical stale-listing flexibility.
Risks & watch-outs
- Climate carrying-cost: major wildfire risk; extreme-heat days projected 7→15/yr by 2055 (HVAC capex compounding) — expect insurance premiums to compound above CPI over the hold.
Questions for the listing agent
- It's been on market 42 days. Have you received any prior offers? Is the seller open to a 3% concession, seller financing, or rate buy-down credit?
- Built in 1969 — when were the roof, HVAC, electrical panel, plumbing, and water heater last replaced?
- Is there a deadline driving the sale (1031 exchange, divorce, estate, relocation)? That informs how much negotiation room exists.
- Schools are D-rated, which usually means shorter tenancies and higher turnover. Who's the typical renter profile here, and what's been the actual vacancy rate?
- What's the average days-on-market for RENTAL listings here right now (not sales)? A rising rental-DOM trend means longer vacancies and softer asking-rent achievability than the comps imply.
- What's the recent tenant-quality profile in this submarket — average credit score on applications, eviction rate, late-payment / NSF rate, and stable-employment percentage? A property-management company in the area should have these aggregated.
- How much new for-sale + rental construction is in the pipeline within 1–3 miles? Heavy new supply typically softens prices + rents 12–24 months out; constrained supply supports both.
Investment metrics
- 1% rule
- 1.74% ✓
- Cap rate
- 14.45%
- Cash-on-cash
- 29.13%
- DSCR
- 2.30
- GRM
- 4.8
CMA / ARV
- ARV (median comp)
- $132,081
- List price
- $130,000
- Delta
- -1.58%
- Verdict
- FAIR
- Comps
- 12 within 1.0 mi
Show comp detail 12 sales within ~0.75 mi
| Address | Dist | Beds/Ba | Sqft | Sold | Price | $/sf | Match |
|---|---|---|---|---|---|---|---|
| 1830 E Yosemite #128 | 0.29mi | 2/2.0 | 1,440 (0%) | 2mo | $100,000 | $69 | 84 |
| 150 Pestana Ave #25 | 0.01mi | 3/2.0 (+1) | 1,440 (0%) | 16mo | $125,000 | $87 | 81 |
| 150 Pestana #34 | 0.04mi | 3/2.0 (+1) | 1,440 (0%) | 19mo | $149,888 | $104 | 77 |
| 1830 Yosemite Ave #4 | 0.30mi | 2/2.0 | 1,344 (-7%) | 1mo | $131,000 | $97 | 74 |
| 1830 E Yosemite Ave #275 | 0.30mi | 2/2.0 | 1,500 (+4%) | 7mo | $114,000 | $76 | 73 |
| 1830 E Yosemite Ave #1 | 0.34mi | 2/2.0 | 1,444 (+0%) | 14mo | $232,000 | $161 | 72 |
| 150 Pestana #21 | 0.00mi | 2/1.5 | 1,248 (-13%) | 5mo | $87,000 | $70 | 71 |
| 1830 E Yosemite Ave #257 | 0.30mi | 2/2.0 | 1,488 (+3%) | 11mo | $143,500 | $96 | 71 |
| 1830 E Yosemite #207 | 0.30mi | 2/2.0 | 1,536 (+7%) | 7mo | $148,000 | $96 | 69 |
| 1830 E Yosemite Ave #137 | 0.30mi | 3/2.0 (+1) | 1,440 (0%) | 17mo | $125,000 | $87 | 67 |
| 1830 E Yosemite Ave #68 | 0.29mi | 2/2.0 | 1,300 (-10%) | 6mo | $135,000 | $104 | 65 |
| 1830 Yosemite Ave #118 | 0.27mi | 2/2.0 | 1,624 (+13%) | 10mo | $207,000 | $127 | 57 |
Match score weights: distance 35% · size 25% · config 20% · recency 20%. Top-matched comps best support the ARV.
Projected returns pro-forma
-3.0% appreciation · 0.0% rent growth · sell at horizon
- IRR
- 20.1%
- Equity multiple
- 1.79×
- Total profit
- $28,637
- Equity at exit
- $19,383
- IRR
- 26.2%
- Equity multiple
- 2.98×
- Total profit
- $71,996
- Equity at exit
- $11,240
Cash invested: $36,400 (down + closing). Projections, not guarantees.
Landlord ↔ Tenant lean methodology
- Overall (STATE)
- 18 Strongly Tenant-Friendly
- State California
- 18 Strongly Tenant-Friendly · D+13
- County
- — inherits STATE
- City
- — inherits STATE
ZIP-level market 95336
- Rents YoY
- -0.7%
- Active inventory
- 270
- Price-to-rent
- 4.8×
Monthly cashflow live
- Estimated rent
- $2,256 high interval (Pro) →
- Mortgage (P&I)
- −$682
- Tax est. 1.5%
- −$162 /mo · $1,950/yr
- Insurance
- −$54
- HOA
- −$0
- Vacancy / Maint / Mgmt
- −$474
- Net cashflow
- $884
Break-even live
UW: 25.0% down · 7.5% · 30yr · 1.5% tax · 5.0% vac · 8.0% maint · 8.0% mgmt
Financing live
Cash to close
- Down payment
- $32,500
- Closing costs
- $3,900
- Reserves months
- —
- Total cash needed
- —
Loan-product check · same deal, 3 products live
Conventional
25% down · 7.5% · 30yr
- Down + closing
- —
- Monthly P&I
- —
- Monthly cashflow
- —
- DSCR
- —
- Eligible?
- —
Personal DTI + credit; lowest rate.
DSCR
20% down · 8.5% · 30yr
- Down + closing
- —
- Monthly P&I
- —
- Monthly cashflow
- —
- DSCR
- —
- Eligible?
- —
No personal income docs; deal must DSCR.
Hard money
10% down · 12.0% · 12mo
- Down + closing
- —
- Monthly P&I
- —
- Monthly cashflow
- —
- DSCR
- —
- Eligible?
- —
Short-term bridge; refi at stabilization.
Rent comps 9 comps
| Address | Beds | Baths | Sqft | Rent | $/sqft | DOM | Units | Dist |
|---|---|---|---|---|---|---|---|---|
| 1815 Azure Ct Unit C Manteca, CA | 2.0 | 2.0 | 1400 | $1,800 | $1.29 | 19d | 1 | 0.09mi |
| 2054 Hyannis Cir Manteca, CA | 3.0 | 2.0 | 1664 | $2,495 | $1.50 | 19d | 1 | 0.16mi |
| 200 Northwoods Ave Manteca, CA | 2.0 | 1.0 | 900 | $1,675 | $1.86 | 3d | 1 | 0.36mi |
| 1634 Sierra Creek Dr Manteca, CA | 3.0 | 2.0 | 1411 | $3,100 | $2.20 | 19d | 1 | 0.57mi |
| 311 Charles Ave Manteca, CA | 3.0 | 2.0 | 1092 | $2,750 | $2.52 | 23d | 1 | 0.80mi |
| 794 Button Ave Manteca, CA | 2.0 | 2.0 | 1075 | $2,300 | $2.14 | 14d | 1 | 0.87mi |
| 522 Dawn Dr Manteca, CA | 3.0 | 2.5 | 1687 | $2,500 | $1.48 | 43d | 1 | 1.25mi |
| 225 N Fremont St Manteca, CA | 2.0 | 2.0 | 926 | $1,875 | $2.02 | 43d | 1 | 1.34mi |
| 708 Meadow Way Manteca, CA | 3.0 | 2.0 | 1843 | $2,750 | $1.49 | 14d | 1 | 1.35mi |
Listing history 15 events
-
2026-06-18days on market $130,000 Active 42 DOM
-
2026-06-17days on market $130,000 Active 41 DOM
-
2026-06-16days on market $130,000 Active 40 DOM
-
2026-06-15days on market $130,000 Active 39 DOM
-
2026-06-14days on market $130,000 Active 37 DOM
-
2026-06-13days on market $130,000 Active 36 DOM
-
2026-06-10days on market $130,000 Active 34 DOM
-
2026-06-09days on market $130,000 Active 33 DOM
-
2026-06-08days on market $130,000 Active 32 DOM
-
2026-06-07days on market $130,000 Active 31 DOM
-
2026-06-05days on market $130,000 Active 28 DOM
-
2026-06-03days on market $130,000 Active 27 DOM
-
2026-06-03days on market $130,000 Active 26 DOM
-
2026-06-01days on market $130,000 Active 25 DOM
-
2026-05-31days on market $130,000 Active 24 DOM
ⓘ Source: listings_history table (triggers on properties + properties_extension) + one-shot
backfill from property_details.listing_events for pre-trigger history.
Climate risk First Street
- Flood 1/10 Low FEMA zone X (unshaded) · 0% chance over 30 yrs
- Wildfire 6/10 Major
- Heat 7/10 Severe 7 d/yr ≥102°F today · 15 d/yr by 30 yrs out
- Wind 1/10 Low
- Air quality 10/10 Extreme 30 unhealthy d/yr today · 31 by 30 yrs out
Nearby sold comps map
Loading sold comps map…
Walkable amenities ~0.75 mi
Loading nearby amenities…
Taxation est. · year 1
- Rental income
- $27,069
- − Mortgage interest
- −$7,282
- − Property taxes
- −$1,950
- − Insurance
- −$650
- − Repairs & maintenance
- −$2,166
- − Management
- −$2,166
- − Depreciation
- −$3,782
- Taxable income
- $9,074
- Est. tax owed @ 24.0%
- −$2,178
- After-tax cash flow
- $8,426/yr
For passive investors: Depreciation is non-cash, so a rental often shows a tax loss while cash-flowing — sheltering income. Rental losses are passive: they offset passive income freely, and up to $25,000/yr can offset ordinary (W-2) income if you actively participate and your MAGI is under $100k (phasing out to $0 by $150k); unused losses carry forward. On sale, claimed depreciation is recaptured at up to 25%, and gains may owe capital-gains tax (a 1031 exchange can defer both). Figures are a year-1 estimate at your 24.0% rate — not tax advice; consult a CPA.
Condition & rehab AI · 30 photos
This well-maintained mobile home in a 55+ community is move-in ready with updated kitchens and bathrooms. It offers a good investment opportunity with potential for rental or resale.
Value-add opportunities
- Resale Paint exterior siding — Enhances curb appeal and property value.
- Rental Clean gutters — Keeps property in good condition and reduces maintenance costs.
Renovation cost estimate screening
Value-add ROI direction
- Resale Paint exterior siding — Enhances curb appeal and property value. ↑
- Rental Clean gutters — Keeps property in good condition and reduces maintenance costs. ↑
ⓘ Cost ranges are severity-bucket heuristics (US national rule-of-thumb). Get contractor quotes + a written scope before underwriting a rehab budget.
Schools (NCES district)
- District
- Manteca Unified
- NCES district ID
- 0623610
- Math proficiency
- 15% ▼ -14.00%
- Reading proficiency
- 48% ▬ 0.00%
- Median HH income
- $62,426
- Composite
- 28.5/100
- National rank
- #6737
- State rank
- #297 of 517 in CA
Livability — Manteca
- Score
- 61/100
- State rank
- #535
- US rank
- #17877
Category grades
Schools grade is shown separately in the Schools card above.
Census & demographics
- Census place
- Manteca, CA
- County
- San Joaquin County · 729,570 people
- City population
- 98,916
- Metro
- Stockton, CA
- Population (ZIP)
- 50,185
- Household income
- $89,172
- Rent vs Own
- Severe rent burden
- 876.0
Population outlook (San Joaquin County) Hauer SSP2
- Today (2025)
- 796,965 people
- By 2030
- 828,849 · +4.0%
- By 2040
- 885,611 · +11.1%
- By 2050
- 929,798 · +16.7%
- By 2075
- 994,578 · +24.8%
- By 2100
- 971,291 · +21.9%
Race, ethnicity, and origin ACS 2023
- Neighborhood character
- Diverse neighborhood (Simpson 0.63)
- Race & ethnicity
- Hispanic / Latino 43% White 42% Two or more races 18% Asian 7% Black 2%
- Hispanic origin (detail)
- Mexican 37%
- Common ancestry
- Russian 3% Lithuanian 2% Slovak 1%
- Foreign-born
- 17% · Canada
- Languages at home
- 69% English-only · Spanish 23% Other Asian/Pacific 3% Other Indo-European 2%
Political lean MEDSL · San Joaquin
- 2024 margin
- Toss-up / Even · D 48.0% · R 48.9% · Other 3.0%
- 2008→2024 swing
- -11.6pp toward R · 2008: 10.7pp · 2024: -0.9pp
- All cycles
- 2024: R+0.9 2020: D+13.9 2016: D+12.9 2012: D+8.9 2008: D+10.7
Not yet ingested
- Civics
- —
Market trends
- HPI YoY
- ▼ -407.05%
- Current HPI
- 268.5708
- Rent YoY
- ▼ -0.68%
- Metro
- Stockton, CA
- State GDP YoY
- ▲ 3.21%
- F500 in state
- 116
Industry mix (Fortune 500 HQ in CA)
| Industry | F500 HQs | Revenue |
|---|---|---|
| Technology | 27 | $1,492B |
|
||
| Financial Services | 3 | $174B |
|
||
| Retail | 3 | $44B |
|
||
| Insurance | 3 | $26B |
|
||
| Media / Entertainment | 2 | $115B |
|
||
| Pharmaceuticals / Biotech | 2 | $62B |
|
||
Cash-flow waterfall
monthlySold comps — $/sqft
last 12 mo · ≤1 miLoading sold comps…