 Multi-family
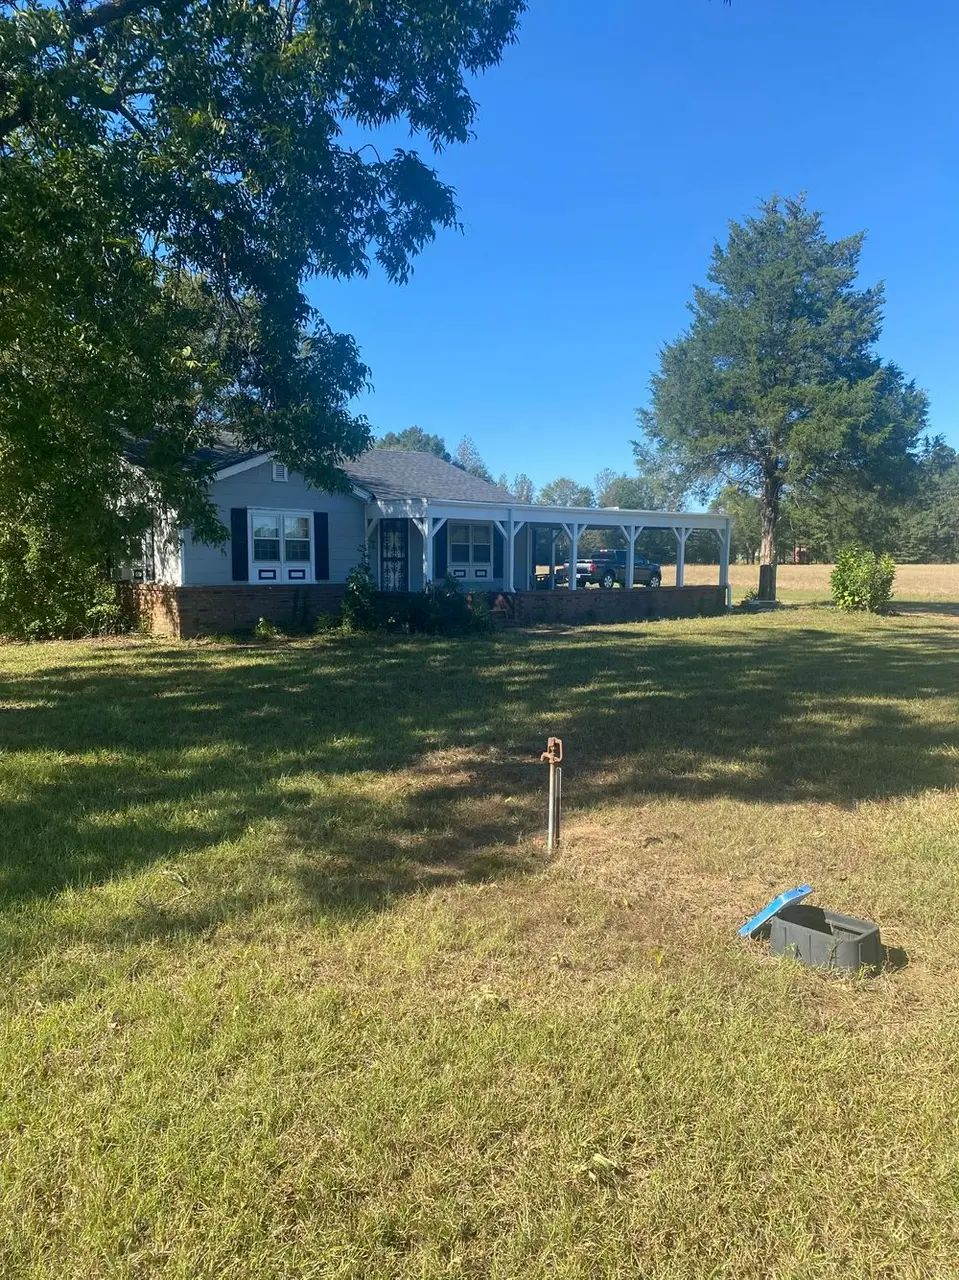
40369 Old Highway 45 · New Hamilton, MS
Flood risk No data
- FEMA flood zone
- —
- Chance of flooding over 30 yrs
- —
- Est. flood insurance / yr
- —
Fire risk No data
- Est. fire insurance / yr
- —
Heat risk No data
- Hot days now (above threshold)
- —
- Hot days in 30 yrs
- —
Wind risk No data
- Chance of severe wind over 30 yrs
- —
Air-quality risk No data
- Unhealthy air days now
- —
- Unhealthy air days in 30 yrs
- —
Risk factors via First Street. Map © Google.
Why this score? — see what drove the D+ grade
The composite is a weighted blend of 9 inputs, each scored 0–100. Each bar is that input's sub-score; the figure is the points it added to the 100-point composite (weight × sub-score).
- Cash flow +13.9/30.0
- Appreciation +7.6/10.0
- ARV discount +7.5/15.0
- DSCR +4.2/10.0
- Schools +4.1/10.0
- 1% rule +3.9/10.0
- Livability +3.2/5.0
- Rent growth +2.5/5.0
- Condition / age +2.2/5.0
$109,500
🖨 Deal sheet 📄 Offer letter ✓ Due diligence
Multi-family units
County records classify this as Multi-Family (2-4 Unit). Listing-text estimate: 1 unit. estimate disagrees with records
Listing remarks MLS
3 acres of land, Home and shop are for sale. Farm land on both sides. Location, spacious yard, ready for your own vison, workshop with upper level has additional living space; kitchenette and bath. Home and shop are both in sound condition with storage and space. If you are looking for investing opportunity and small home with ultimate potential this is the one. Call for more details. More land is owned by us that could also be for sale with the home up to 20 acres total.
Key facts
- Spacious yard
- Storage and space
- Kitchenette and bath
Tags
Neighborhood map
What this means for you Summary
Snapshot
- This is a 2-bed/1.0-bath multifamily listed at $110k. Condition is rated fair.
Deal economics
- At list price, monthly cash flow is $12 ($141/yr) — positive.
- The deal already cash-flows at list — no discount required.
- To meet the 1% rule (rent ≥ 1% of price), the offer needs to be $97k (11.2% below list).
- Recommended offer: $97k (11.2% below list) — sets the bar for 1% rule.
Location & tenants
- Location reads 63/100 on livability (#157 in MS) — a middle-class / working-renter tenant base. Strengths: crime A+, cost of living A+, housing A+; Watch: schools D-, amenities F, commute F.
- Monroe County School District (rural): math 55% / reading 42% proficiency, ranked #17 of 130 in MS (top 13%) — families likely to look elsewhere, expect single-tenant / working-renter base with shorter leases.
- Market conditions: 7 active listings in the ZIP; 18 units permitted in Monroe County in 2024 (0 in 5+ unit buildings).
Forward outlook
- In year one you build about $6k of equity ($757 loan paydown + $6k appreciation (5.1% local appreciation)).
- Monroe County population projected at -21% by 2050 — secular population decline; favor cash flow + early exit over multi-decade hold.
- At projected returns (5.1% appreciation + 3.0% rent growth), your $31k cash investment doubles in ~5 years — after that, you're playing with house money.
- By year 6, paydown + projected appreciation supports a ~$34k cash-out refi (75% LTV) — recoverable capital for the next deal without selling this one.
Negotiation context
- It's been on market 117 days — a 9% lower offer ($100k) is reasonable based on typical stale-listing flexibility.
Questions for the listing agent
- It's been on market 117 days. Have you received any prior offers? Is the seller open to a 11% concession, seller financing, or rate buy-down credit?
- Have any recent inspections been done? Can we get a copy of the seller's disclosures and any deferred-maintenance estimates?
- Why hasn't it sold? Are there any deal-killer items the seller is aware of (foundation, flood, title, zoning, code violations)?
- Is there a deadline driving the sale (1031 exchange, divorce, estate, relocation)? That informs how much negotiation room exists.
- Schools are D-rated, which usually means shorter tenancies and higher turnover. Who's the typical renter profile here, and what's been the actual vacancy rate?
- The area grade is low — what's the realistic commute time and amenity access for the typical tenant pool here? Any planned neighborhood developments (good or bad) we should know about?
- What's the average days-on-market for RENTAL listings here right now (not sales)? A rising rental-DOM trend means longer vacancies and softer asking-rent achievability than the comps imply.
- What's the recent tenant-quality profile in this submarket — average credit score on applications, eviction rate, late-payment / NSF rate, and stable-employment percentage? A property-management company in the area should have these aggregated.
- How much new apartment / multifamily construction is in the pipeline within 1–3 miles? Heavy new supply (>2% of stock underway) typically softens rents 12–24 months out; light construction supports rent growth.
Investment metrics
- 1% rule
- 0.89% ✗
- Cap rate
- 6.42%
- Cash-on-cash
- 0.46%
- DSCR
- 1.02
- GRM
- 9.4
CMA / ARV
No comps found within radius.
Projected returns pro-forma
5.11% appreciation · 3.0% rent growth · sell at horizon
- IRR
- 13.5%
- Equity multiple
- 1.87×
- Total profit
- $26,669
- Equity at exit
- $62,761
- IRR
- 14.3%
- Equity multiple
- 3.60×
- Total profit
- $79,714
- Equity at exit
- $108,908
Cash invested: $30,660 (down + closing). Projections, not guarantees.
Landlord ↔ Tenant lean methodology
- Overall (STATE)
- 90 Strongly Landlord-Friendly
- State Mississippi
- 90 Strongly Landlord-Friendly · R+11
- County
- — inherits STATE
- City
- — inherits STATE
ZIP-level market 39746
- Home prices YoY
- 3.9%
- Active inventory
- 7
- Price-to-rent
- 9.4×
Monthly cashflow live
- Estimated rent
- $973 medium interval (Pro) →
- Mortgage (P&I)
- −$574
- Tax est. 1.5%
- −$137 /mo · $1,642/yr
- Insurance
- −$46
- HOA
- −$0
- Vacancy / Maint / Mgmt
- −$204
- Net cashflow
- $12
Break-even live
UW: 25.0% down · 7.5% · 30yr · 1.5% tax · 5.0% vac · 8.0% maint · 8.0% mgmt
Financing live
Cash to close
- Down payment
- $27,375
- Closing costs
- $3,285
- Reserves months
- —
- Total cash needed
- —
Loan-product check · same deal, 3 products live
Conventional
25% down · 7.5% · 30yr
- Down + closing
- —
- Monthly P&I
- —
- Monthly cashflow
- —
- DSCR
- —
- Eligible?
- —
Personal DTI + credit; lowest rate.
DSCR
20% down · 8.5% · 30yr
- Down + closing
- —
- Monthly P&I
- —
- Monthly cashflow
- —
- DSCR
- —
- Eligible?
- —
No personal income docs; deal must DSCR.
Hard money
10% down · 12.0% · 12mo
- Down + closing
- —
- Monthly P&I
- —
- Monthly cashflow
- —
- DSCR
- —
- Eligible?
- —
Short-term bridge; refi at stabilization.
Listing history 6 events
-
2026-06-04days on market $109,500 Active 117 DOM
-
2026-06-02days on market $109,500 Active 116 DOM
-
2026-06-01days on market $109,500 Active 115 DOM
-
2026-05-31days on market $109,500 Active 114 DOM
-
2026-02-07price $109,500 476-char remark
Show marketing remark (476 chars)
3 acres of land, Home and shop are for sale. Farm land on both sides. Location, spacious yard, ready for your own vison, workshop with upper level has additional living space; kitchenette and bath. Home and shop are both in sound condition with storage and space. If you are looking for investing opportunity and small home with ultimate potential this is the one. Call for more details. More land is owned by us that could also be for sale with the home up to 20 acres total.
-
2026-02-06$112,000 Active 476-char remark
Show marketing remark (476 chars)
3 acres of land, Home and shop are for sale. Farm land on both sides. Location, spacious yard, ready for your own vison, workshop with upper level has additional living space; kitchenette and bath. Home and shop are both in sound condition with storage and space. If you are looking for investing opportunity and small home with ultimate potential this is the one. Call for more details. More land is owned by us that could also be for sale with the home up to 20 acres total.
ⓘ Source: listings_history table (triggers on properties + properties_extension) + one-shot
backfill from property_details.listing_events for pre-trigger history.
Nearby sold comps map
Loading sold comps map…
Walkable amenities ~0.75 mi
Loading nearby amenities…
Taxation est. · year 1
- Rental income
- $11,673
- − Mortgage interest
- −$6,134
- − Property taxes
- −$1,642
- − Insurance
- −$548
- − Repairs & maintenance
- −$934
- − Management
- −$934
- − Depreciation
- −$3,185
- Taxable loss
- −$1,703
- Est. tax savings @ 24.0%
- +$409
- After-tax cash flow
- $550/yr
For passive investors: Depreciation is non-cash, so a rental often shows a tax loss while cash-flowing — sheltering income. Rental losses are passive: they offset passive income freely, and up to $25,000/yr can offset ordinary (W-2) income if you actively participate and your MAGI is under $100k (phasing out to $0 by $150k); unused losses carry forward. On sale, claimed depreciation is recaptured at up to 25%, and gains may owe capital-gains tax (a 1031 exchange can defer both). Figures are a year-1 estimate at your 24.0% rate — not tax advice; consult a CPA.
Condition & rehab AI · 12 photos
The home requires moderate renovations to update the kitchen and bathroom, and minor repairs to the exterior. Upgrading these areas would significantly increase its value for both resale and rental.
Repairs flagged
- Major kitchen appliances — outdated and worn
- Major cabinetry — worn and outdated
- Minor bathroom fixtures — basic and simple
Value-add opportunities
- Both update kitchen appliances and cabinetry — modernizing the kitchen would appeal to both buyers and renters
- Both upgrade bathroom fixtures — improving the bathroom would enhance the home's overall appeal
- Both paint interior walls and replace flooring — these updates would improve the home's appearance and functionality
- Both repair and paint exterior siding — aesthetic improvements to the exterior would attract more buyers and renters
Renovation cost estimate screening
| Repair item | Severity | Est. cost |
|---|---|---|
| kitchen appliances · outdated and worn | Major | $15,000–50,000 |
| cabinetry · worn and outdated | Major | $15,000–50,000 |
| bathroom fixtures · basic and simple | Minor | $500–3,000 |
| Total estimated repair cost · 3 items | $30,500–103,000 |
Value-add ROI direction
- Both update kitchen appliances and cabinetry — modernizing the kitchen would appeal to both buyers and renters ↑
- Both upgrade bathroom fixtures — improving the bathroom would enhance the home's overall appeal ↑
- Both paint interior walls and replace flooring — these updates would improve the home's appearance and functionality ↑
- Both repair and paint exterior siding — aesthetic improvements to the exterior would attract more buyers and renters ↑
ⓘ Cost ranges are severity-bucket heuristics (US national rule-of-thumb). Get contractor quotes + a written scope before underwriting a rehab budget.
Schools (NCES district)
- District
- Monroe County School District
- NCES district ID
- 2802940
- Math proficiency
- 55% ▬ 0.00%
- Reading proficiency
- 42% ▼ -9.00%
- Median HH income
- $44,077
- Composite
- 41.04/100
- National rank
- #3579
- State rank
- #17 of 130 in MS
Livability — New Hamilton
- Score
- 63/100
- State rank
- #157
- US rank
- #15392
Category grades
Schools grade is shown separately in the Schools card above.
Census & demographics
- Population (ZIP)
- 2,731
Population outlook (Monroe County) Hauer SSP2
- Today (2025)
- 33,903 people
- By 2030
- 32,612 · -3.8%
- By 2040
- 29,761 · -12.2%
- By 2050
- 26,788 · -21.0%
- By 2075
- 20,058 · -40.8%
- By 2100
- 14,566 · -57.0%
Race, ethnicity, and origin ACS 2023
- Neighborhood character
- Predominantly White (79%)
- Race & ethnicity
- White 79% Black 15% Two or more races 4% Hispanic / Latino 4% Asian 3%
- Common ancestry
- Italian 3%
- Foreign-born
- 3% · Vietnam, Canada
- Languages at home
- 96% English-only · Vietnamese 3% Spanish 1%
Political lean MEDSL · Monroe
- 2024 margin
- Solid R (+35.9) · D 31.7% · R 67.6%
- 2008→2024 swing
- -18.7pp toward R · 2008: -17.2pp · 2024: -35.9pp
- All cycles
- 2024: R+35.9 2020: R+30.7 2016: R+29.3 2012: R+15.9 2008: R+17.2
Not yet ingested
- Civics
- —
Market trends
- HPI YoY
- ▲ 5.11%
- Current HPI
- 136.5149
- Rent YoY
- —
- Metro
- —
- State GDP YoY
- —
- F500 in state
- 0
Price history
-2.2% since first listed2 events — show timeline
- 2026-02-07 Price Changed $109,500 ForSaleByOwner.com
- 2026-02-06 Listed $112,000 ForSaleByOwner.com
Cash-flow waterfall
monthlySold comps — $/sqft
last 12 mo · ≤1 miLoading sold comps…