 Duplex
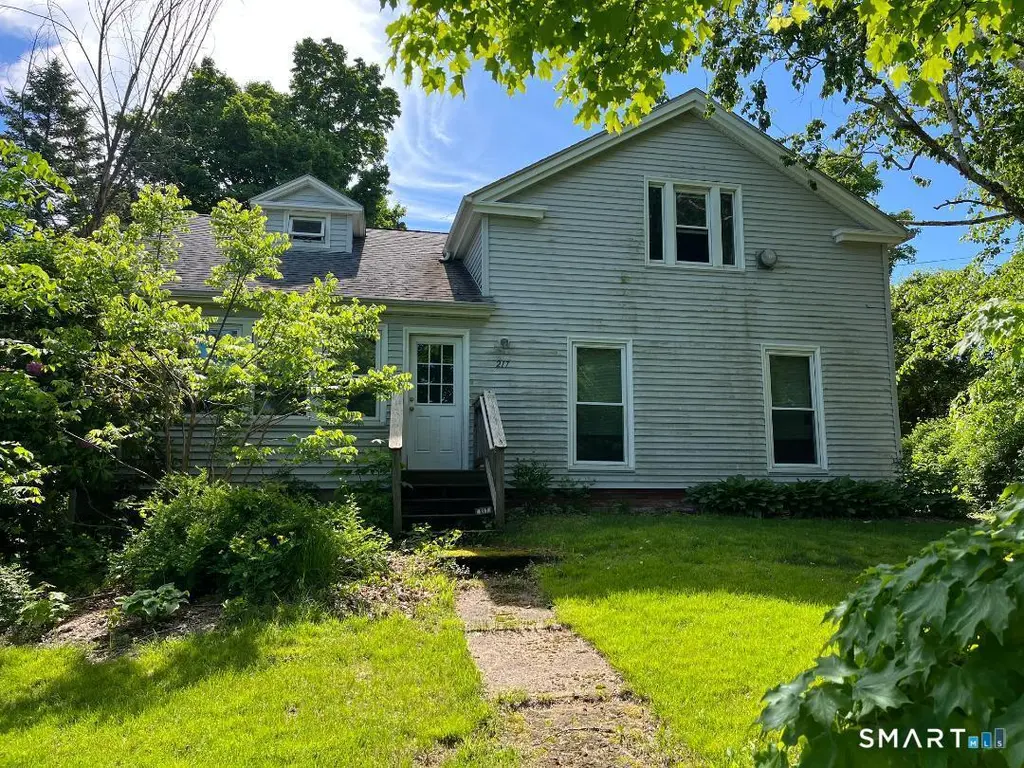
217 West Rd · Ellington, CT
Flood risk 1/10 · Minimal
- FEMA flood zone
- X
- Chance of flooding over 30 yrs
- 0.0%
- Est. flood insurance / yr
- $473 – $860
Fire risk 3/10 · Minor
- Est. fire insurance / yr
- $829 – $1,539
Heat risk 4/10 · Minor
- Hot days now (above 94°F)
- 7 days/yr
- Hot days in 30 yrs
- 17 days/yr
Wind risk 6/10 · Moderate
- Chance of severe wind over 30 yrs
- 27.0%
Air-quality risk 3/10 · Minor
- Unhealthy air days now
- 3 days/yr
- Unhealthy air days in 30 yrs
- 4 days/yr
Risk factors via First Street. Map © Google.
Why this score? — see what drove the B grade
The composite is a weighted blend of 9 inputs, each scored 0–100. Each bar is that input's sub-score; the figure is the points it added to the 100-point composite (weight × sub-score).
- Cash flow +30.0/30.0
- DSCR +10.0/10.0
- 1% rule +9.7/10.0
- ARV discount +7.5/15.0
- Schools +5.6/10.0
- Rent growth +2.5/5.0
- Livability +2.5/5.0
- Condition / age +2.5/5.0
- Appreciation +0.0/10.0
$306,900
🖨 Deal sheet 📄 Offer letter ✓ Due diligence
Multi-family units
County records classify this as Multi-Family (2-4 Unit). Listing-text estimate: 2 units. confirmed
Listing remarks MLS
Hard to find two family near the center of town. Located on a corner lot across the street from Kloter farms. Updates to plumbing and electrical. Buderus boiler and Buderus high efficient indirect hot water heater installed in 2009 for the first floor. Windows, roof and siding all done in 2009. Interior still needs updating but has very nice floor plan. Two bedrooms on the first floor, enclosed porch in the front, open porch in the back along with two attached storage areas. Very pretty lot with beautiful gardens. 2nd floor1 Bedroom Apartment has propane heat, but the propane tank has been removed. Home to be sold "as is, where is" condition.
Key facts
- 0.93 acre lot
- Built 1834
- Listed 13 days
Neighborhood map
What this means for you Summary
Snapshot
- This is a 2 × 3-bed/2.0-bath units multifamily listed at $307k.
Deal economics
- At list price, monthly cash flow is $1k ($17k/yr) — positive. Per door: $721/mo.
- The deal already cash-flows at list — no discount required.
- Meets the 1% rule at list price ($5k rent vs $307k).
Location & tenants
- Location reads: area grade B — affects rentability + tenant quality, not the cash-flow math above.
- Ellington School District (suburban): math 58% / reading 66% proficiency, ranked #38 of 153 in CT (top 25%) — acceptable for families but not a draw, mixed tenant base, ~2y average lease; only 8% free/reduced lunch — higher-income household profile.
- Market conditions: 47 active listings in the ZIP; high-income renter base; 1,867 units permitted in Capitol Planning Region in 2024 (1,399 in 5+ unit buildings).
- This rent runs 42% of the median local income ($129k/yr) — at the standard rent-burdened threshold; future hikes will face affordability resistance.
Forward outlook
- Local home prices are declining (-3.0%/yr); year-one equity from $2k of loan paydown is wiped out by about $9k of value loss. Plan a longer hold.
- At projected returns (-3.0% appreciation + 3.0% rent growth), your $86k cash investment doubles in ~7 years — after that, you're playing with house money.
Negotiation context
- Only 13 days on market — expect competitive offers; lowballing is unlikely to land.
Risks & watch-outs
- Watch-outs: built in 1834 — expect roof / HVAC / electrical / plumbing capex.
- Climate carrying-cost: major wind risk, 27% chance of damaging wind over 30y — expect insurance premiums to compound above CPI over the hold.
Questions for the listing agent
- Can we see the unit-by-unit rent roll, current vacancy, and any below-market leases? What's the average tenancy length?
- What capital expenditures (roof, boiler, parking lot, exteriors) have been made in the last 5 years, and what's planned in the next 2?
- Built in 1834 — when were the roof, HVAC, electrical panel, plumbing, and water heater last replaced?
- Is there a deadline driving the sale (1031 exchange, divorce, estate, relocation)? That informs how much negotiation room exists.
- What's the average days-on-market for RENTAL listings here right now (not sales)? A rising rental-DOM trend means longer vacancies and softer asking-rent achievability than the comps imply.
- What's the recent tenant-quality profile in this submarket — average credit score on applications, eviction rate, late-payment / NSF rate, and stable-employment percentage? A property-management company in the area should have these aggregated.
- How much new apartment / multifamily construction is in the pipeline within 1–3 miles? Heavy new supply (>2% of stock underway) typically softens rents 12–24 months out; light construction supports rent growth.
Investment metrics
- 1% rule
- 1.47% ✓
- Cap rate
- 11.93%
- Cash-on-cash
- 20.14%
- DSCR
- 1.90
- GRM
- 5.7
CMA / ARV
No comps found within radius.
Projected returns pro-forma
-3.0% appreciation · 3.0% rent growth · sell at horizon
- IRR
- 12.4%
- Equity multiple
- 1.49×
- Total profit
- $42,210
- Equity at exit
- $45,760
- IRR
- 21.3%
- Equity multiple
- 2.81×
- Total profit
- $155,353
- Equity at exit
- $26,535
Cash invested: $85,932 (down + closing). Projections, not guarantees.
Landlord ↔ Tenant lean methodology
- Overall (STATE)
- 27 Tenant-Leaning
- State Connecticut
- 27 Tenant-Leaning · D+7
- County
- — inherits STATE
- City
- — inherits STATE
ZIP-level market 06029
- Active inventory
- 47
- Price-to-rent
- 11.3×
Monthly cashflow live
- Estimated rent
- $4,525 medium interval (Pro) →
- Mortgage (P&I)
- −$1,609
- Tax from tax record
- −$395 /mo · $4,741/yr
- Insurance
- −$128
- HOA
- −$0
- Vacancy / Maint / Mgmt
- −$950
- Net cashflow
- $1,442
Break-even live
2-unit breakdown (identical units grouped — click to expand)
| Units | Beds | Baths | Est. rent |
|---|---|---|---|
| 2× units | 3 | 2 | $4,524 |
| #1 | 3 | 2 | $2,262 |
| #2 | 3 | 2 | $2,262 |
| Total (2 units) | $4,525 | ||
UW: 25.0% down · 7.5% · 30yr · 1.5% tax · 5.0% vac · 8.0% maint · 8.0% mgmt
Financing live
Cash to close
- Down payment
- $76,725
- Closing costs
- $9,207
- Reserves months
- —
- Total cash needed
- —
Loan-product check · same deal, 3 products live
Conventional
25% down · 7.5% · 30yr
- Down + closing
- —
- Monthly P&I
- —
- Monthly cashflow
- —
- DSCR
- —
- Eligible?
- —
Personal DTI + credit; lowest rate.
DSCR
20% down · 8.5% · 30yr
- Down + closing
- —
- Monthly P&I
- —
- Monthly cashflow
- —
- DSCR
- —
- Eligible?
- —
No personal income docs; deal must DSCR.
Hard money
10% down · 12.0% · 12mo
- Down + closing
- —
- Monthly P&I
- —
- Monthly cashflow
- —
- DSCR
- —
- Eligible?
- —
Short-term bridge; refi at stabilization.
Listing history 15 events
-
2026-06-17status $306,900 Under Contract 13 DOM
-
2026-06-17days on market $306,900 Active 13 DOM
-
2026-06-16days on market $306,900 Active 12 DOM
-
2026-06-15days on market $306,900 Active 11 DOM
-
2026-06-13days on market $306,900 Active 9 DOM
-
2026-06-13days on market $306,900 Active 8 DOM
-
2026-06-10days on market $306,900 Active 6 DOM
-
2026-06-09days on market $306,900 Active 5 DOM
-
2026-06-08days on market $306,900 Active 4 DOM
-
2026-06-07statusdays on market $306,900 Active 3 DOM
-
2026-06-03days on market $306,900 Coming Soon 7 DOM
-
2026-06-02days on market $306,900 Coming Soon 6 DOM
-
2026-06-01days on market $306,900 Coming Soon 5 DOM
-
2026-05-31days on market $306,900 Coming Soon 4 DOM
-
2026-05-27historical $306,900 660-char remark
Show marketing remark (660 chars)
Hard to find two family near the center of town. Located on a corner lot across the street from Kloter farms. Updates to plumbing and electrical. Buderus boiler and Buderus high efficient indirect hot water heater installed in 2009 for the first floor. Windows, roof and siding all done in 2009. Interior still needs updating but has very nice floor plan. Two bedrooms on the first floor, enclosed porch in the front, open porch in the back along with two attached storage areas. Very pretty lot with beautiful gardens. 2nd floor1 Bedroom Apartment has propane heat, but the propane tank has been removed. Home to be sold "as is, where is" condition.
ⓘ Source: listings_history table (triggers on properties + properties_extension) + one-shot
backfill from property_details.listing_events for pre-trigger history.
Tax reassessment forecast CT · Partial reset (capped growth)
- Current annual tax
- $4,741 · $395/mo
- Projected year-2 tax
- $5,654 · $471/mo
- Expected delta
- +$913/yr (+$76/mo · 19.3%)
ⓘ Screening estimate from a state-policy table — verify with the county assessor before closing.
Climate risk First Street
- Flood 1/10 Low FEMA zone X · 0% chance over 30 yrs
- Wildfire 3/10 Moderate
- Heat 4/10 Moderate 7 d/yr ≥94°F today · 17 d/yr by 30 yrs out
- Wind 6/10 Major 27% chance of damaging wind over 30 yrs
- Air quality 3/10 Moderate 3 unhealthy d/yr today · 4 by 30 yrs out
Nearby sold comps map
Loading sold comps map…
Walkable amenities ~0.75 mi
Loading nearby amenities…
Taxation est. · year 1
- Rental income
- $54,300
- − Mortgage interest
- −$17,191
- − Property taxes
- −$4,741
- − Insurance
- −$1,534
- − Repairs & maintenance
- −$4,344
- − Management
- −$4,344
- − Depreciation
- −$8,928
- Taxable income
- $13,217
- Est. tax owed @ 24.0%
- −$3,172
- After-tax cash flow
- $14,136/yr
For passive investors: Depreciation is non-cash, so a rental often shows a tax loss while cash-flowing — sheltering income. Rental losses are passive: they offset passive income freely, and up to $25,000/yr can offset ordinary (W-2) income if you actively participate and your MAGI is under $100k (phasing out to $0 by $150k); unused losses carry forward. On sale, claimed depreciation is recaptured at up to 25%, and gains may owe capital-gains tax (a 1031 exchange can defer both). Figures are a year-1 estimate at your 24.0% rate — not tax advice; consult a CPA.
Schools (NCES district)
- District
- Ellington School District
- NCES district ID
- 0901440
- Math proficiency
- 58% ▼ -2.00%
- Reading proficiency
- 66% ▼ -2.00%
- Median HH income
- $81,612
- Composite
- 55.73/100
- National rank
- #1220
- State rank
- #38 of 153 in CT
Livability — Ellington
No livability data for this city. (Only ~50 U.S. cities are tracked.)
Census & demographics
- County
- Tolland County · 46,815 people
- City population
- 16,238
- Metro
- Hartford-East Hartford-Middletown, CT
- Population (ZIP)
- 16,238
- Household income
- $129,331
- Rent vs Own
- Severe rent burden
- 339.0
Population outlook (Capitol County) Hauer SSP2
- By 2040
- 1,063,519
Race, ethnicity, and origin ACS 2023
- Neighborhood character
- Predominantly White (82%)
- Race & ethnicity
- White 82% Asian 6% Two or more races 5% Hispanic / Latino 4% Black 3%
- Common ancestry
- Romanian 8% Lithuanian 7% Russian 3%
- Foreign-born
- 7% · Canada, Vietnam, South Korea
- Languages at home
- 91% English-only · Spanish 3% Other Asian/Pacific 2% Other Indo-European 1%
Political lean MEDSL · Capitol
- 2024 margin
- Strong D (+21.9) · D 60.1% · R 38.2% · Other 1.7%
- All cycles
- 2024: D+21.9
Not yet ingested
- Civics
- —
Market trends
- HPI YoY
- ▼ -163.04%
- Current HPI
- 179.3303
- Rent YoY
- —
- Metro
- Hartford-East Hartford-Middletown, CT
- State GDP YoY
- ▲ 1.06%
- F500 in state
- 38
Industry mix (Fortune 500 HQ in CT)
| Industry | F500 HQs | Revenue |
|---|---|---|
| Industrial Machinery | 4 | $38B |
|
||
| Insurance | 3 | $71B |
|
||
| Financial Services | 2 | $25B |
|
||
| Transportation / Logistics | 2 | $18B |
|
||
| Healthcare | 1 | $247B |
|
||
| Telecommunications | 1 | $55B |
|
||
Price history
1 event — show timeline
- 2026-05-27 Coming Soon $306,900 Smart MLS
Property tax history
+2.9%/yrLatest (2023): $4,741 · +5.5% YoY. Source: county tax records.
Cash-flow waterfall
monthlySold comps — $/sqft
last 12 mo · ≤1 miLoading sold comps…