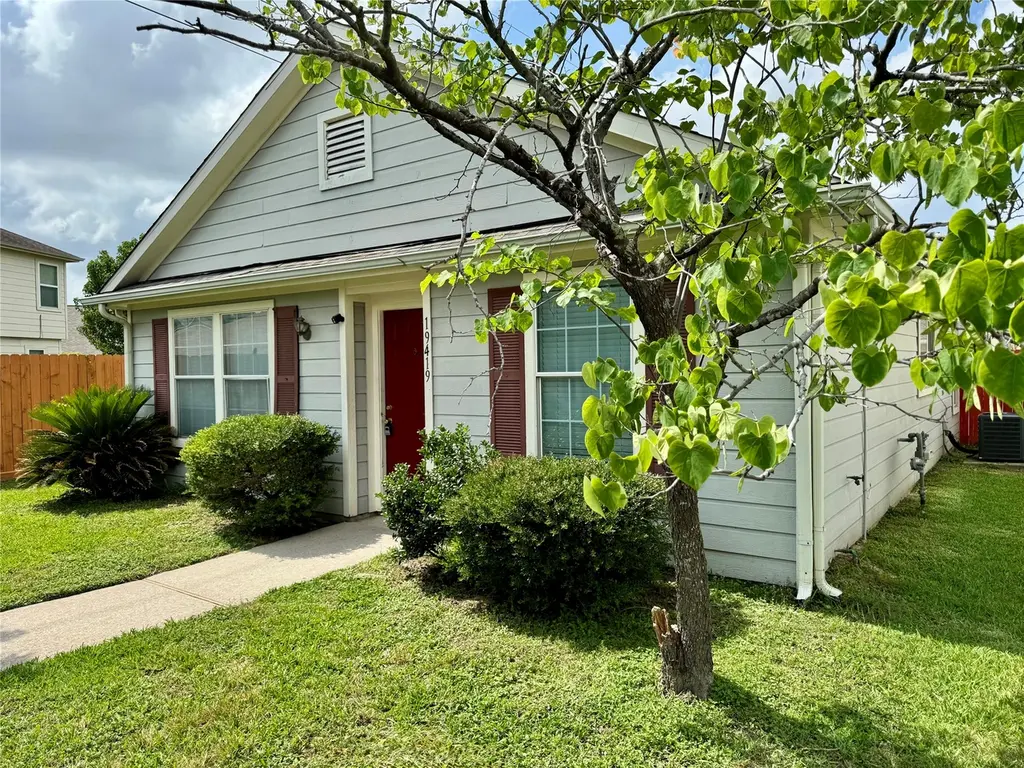
19419 Richland Springs Dr · Houston, TX
Flood risk 7/10 · Major
- FEMA flood zone
- X (unshaded)
- Chance of flooding over 30 yrs
- 0.99%
- Est. flood insurance / yr
- $507 – $1,088
Fire risk 1/10 · Minimal
- Est. fire insurance / yr
- $1,222 – $2,270
Heat risk 9/10 · Severe
- Hot days now (above 110°F)
- 7 days/yr
- Hot days in 30 yrs
- 25 days/yr
Wind risk 9/10 · Severe
- Chance of severe wind over 30 yrs
- 99.0%
Air-quality risk 3/10 · Minor
- Unhealthy air days now
- 3 days/yr
- Unhealthy air days in 30 yrs
- 3 days/yr
Risk factors via First Street. Map © Google.
Why this score? — see what drove the D+ grade
The composite is a weighted blend of 9 inputs, each scored 0–100. Each bar is that input's sub-score; the figure is the points it added to the 100-point composite (weight × sub-score).
- Cash flow +11.1/30.0
- ARV discount +10.1/15.0
- 1% rule +5.3/10.0
- Appreciation +4.7/10.0
- Livability +3.7/5.0
- DSCR +3.2/10.0
- Rent growth +2.7/5.0
- Condition / age +2.5/5.0
- Schools +2.0/10.0
$175,000
🖨 Deal sheet 📄 Offer letter ✓ Due diligence
Listing remarks MLS
Charming one story, 3/2/2 home located in the Remington Ranch community. This open concept home features tile floors throughout, a kitchen island, an attached two car garage with a fenced backyard. The Remington Ranch subdivision is surrounded by restaurants, education opportunities, entertainment and shopping. It's location is convenient to George Bush intercontinental Airport, Downton and The Woodlands.
Key facts
- Central island
- Walk-in closet
- Tile flooring
Tags
Property features AI
Finance
- Other: Municipal Utility District disclosure available; Seller disclosure available
- HOA & community: Association managed by Crest Management Company; Annual association fee of $650; Community playground
Exterior
- Parking: Attached garage for 2 cars
- Utilities: Public water; Public sewer
- Home design: Residential property; Faces south; Built in 2005; One-story (entry level: first floor)
- Construction: Cement siding; Composition roof; Slab foundation
- Exterior features: Back yard fence; Other lot features; Concrete road surface
Interior
- Kitchen: Garbage disposal
- Bedrooms: Primary bedroom (first floor) — 13 x 12; Bedroom (first floor) — 10 x 10; Bedroom (first floor) — 10 x 10
- Flooring: Tile
- Bathrooms: 2 full bathrooms
- Heating & cooling: Central heat (gas); Central electric air conditioning
- Interior features: Breakfast bar; Laminate counters; Pantry; Tub with shower; Ceiling fans; Kitchen/dining combo; Living/dining room
- Laundry & utility: Washer hookup; Electric dryer hookup
Neighborhood map
What this means for you Summary
Snapshot
- This is a 3-bed/2.0-bath single-family listed at $175k.
Deal economics
- At list price, monthly cash flow is $-137 ($-2k/yr) — negative.
- To cash-flow at today's rent, offer at most $151k (13.8% below list).
- Meets the 1% rule at list price ($2k rent vs $175k).
- Recommended offer: $151k (13.8% below list) — sets the bar for cash-flow.
- Cap rate 5.8% vs local median 3.2% in Houston — top-decile yield for the area; either an underpriced asset or a hidden risk that comps aren't pricing in. Stress-test before assuming the spread holds.
Location & tenants
- Location reads 74/100 on livability (#184 in TX, #4,771 nationally) — a middle-class / working-renter tenant base. Strengths: amenities A+, cost of living A+, housing A+; Watch: crime F.
- Spring ISD (suburban): math 19% / reading 26% proficiency, ranked #730 of 826 in TX (top 88%) — low school quality limits family demand, transient renter base, plan for 1-2y turnover; 66% free/reduced lunch — lower-income household profile, screen leases tightly.
- Zoned schools: Milton Cooper El (math 25% / reading 24%, grade F, #3,052 of 4,322 statewide, top 74%, 660 students, 88% FRL); Dueitt Middle (math 12% / reading 23%, grade F, #1,507 of 1,662 statewide, top 91%, 773 students, 84% FRL); Andy Dekaney H S (math 5% / reading 13%, grade F, #1,599 of 1,632 statewide, top 98%, 2,401 students, 82% FRL) — zoned schools average 85% FRL vs 66% district-wide (18 pts higher); higher-poverty schools than district average — tighter screening recommended.
- Market conditions: Rents flat; 159 active listings in the ZIP; 2 comparable units currently listed for rent nearby; solid renter incomes; 29,883 units permitted in Harris County in 2024 (8,621 in 5+ unit buildings).
Forward outlook
- In year one you build about $24 of equity ($1k loan paydown + $-1k appreciation (-0.7% local appreciation)).
- Harris County population projected at +47% by 2050 — long-run rental-demand tailwind backs the buy-and-hold thesis.
Negotiation context
- It's been on market 16 days — a 2% lower offer ($172k) is reasonable based on typical stale-listing flexibility.
- 3 sale attempts since 5y ago with the ask held roughly flat each time — persistent listings suggest the price (not the market) is what's stuck; bring a comps-based counter.
Risks & watch-outs
- Watch-outs: property tax is 3.1% of price; flood insurance adds $66/mo.
- Climate carrying-cost: major flood risk; severe wind risk, 99% chance of damaging wind over 30y; extreme-heat days projected 7→25/yr by 2055 (HVAC capex compounding) — expect insurance premiums to compound above CPI over the hold.
Questions for the listing agent
- What do current leases actually rent for vs. the listed asking? Can we see a recent rent roll and the last 12 months of T-12 income?
- Property tax is high relative to price — has the assessment been appealed recently, and will the sale trigger a re-assessment?
- What's the actual annual flood-insurance premium (NFIP or private), and is the property in a SFHA with mandatory coverage?
- What does the HOA fee cover, when was the last increase, and are there any pending special assessments or reserve-fund shortfalls?
- Is there a deadline driving the sale (1031 exchange, divorce, estate, relocation)? That informs how much negotiation room exists.
- Schools are D-rated, which usually means shorter tenancies and higher turnover. Who's the typical renter profile here, and what's been the actual vacancy rate?
- Crime grade is F in this area — have there been break-ins, vandalism, or insurance claims at this property in the last 3 years? What carrier currently insures it and at what premium?
- The area grade is low — what's the realistic commute time and amenity access for the typical tenant pool here? Any planned neighborhood developments (good or bad) we should know about?
- What's the average days-on-market for RENTAL listings here right now (not sales)? A rising rental-DOM trend means longer vacancies and softer asking-rent achievability than the comps imply.
- What's the recent tenant-quality profile in this submarket — average credit score on applications, eviction rate, late-payment / NSF rate, and stable-employment percentage? A property-management company in the area should have these aggregated.
- How much new for-sale + rental construction is in the pipeline within 1–3 miles? Heavy new supply typically softens prices + rents 12–24 months out; constrained supply supports both.
Investment metrics
- 1% rule
- 1.03% ✓
- Cap rate
- 5.81%
- Cash-on-cash
- -1.73%
- DSCR
- 0.92
- GRM
- 8.1
CMA / ARV
- ARV (on-the-fly)
- $185,808
- Comps found
- 11
Show comp detail 11 sales within ~0.75 mi
| Address | Dist | Beds/Ba | Sqft | Sold | Price | $/sf | Match |
|---|---|---|---|---|---|---|---|
| 951 Verde Trails Dr | 0.30mi | 3/2.0 | 1,184 (+1%) | 9mo | $169,900 | $143 | 78 |
| 18927 Remington Bend Dr | 0.42mi | 3/2.0 | 1,208 (+3%) | 2mo | $214,900 | $178 | 74 |
| 967 Verde Trails Dr | 0.32mi | 3/2.0 | 1,173 (-0%) | 14mo | $176,900 | $151 | 73 |
| 539 Silky Leaf Dr | 0.42mi | 2/2.0 (-1) | 1,164 (-1%) | 2mo | $185,000 | $159 | 72 |
| 251 Silky Leaf Dr | 0.44mi | 2/2.0 (-1) | 1,136 (-3%) | 9mo | $177,000 | $156 | 62 |
| 310 Remington Creek Dr | 0.39mi | 2/2.0 (-1) | 1,070 (-9%) | 4mo | $173,000 | $162 | 59 |
| 19505 Wann Park Dr | 0.08mi | 3/2.0 | 1,308 (+11%) | 24mo | $212,000 | $162 | 58 |
| 1219 Verde Trails Dr | 0.57mi | 3/2.0 | 1,194 (+2%) | 16mo | $189,000 | $158 | 57 |
| 1091 Verde Trails Dr | 0.42mi | 3/2.5 | 1,340 (+14%) | 10mo | $194,900 | $145 | 47 |
| 1015 Verde Trails Dr | 0.34mi | 3/2.0 | 1,008 (-14%) | 21mo | $175,000 | $174 | 43 |
| 19010 Remington Bend Dr | 0.41mi | 3/2.0 | 1,334 (+13%) | 20mo | $210,000 | $157 | 42 |
Match score weights: distance 35% · size 25% · config 20% · recency 20%. Top-matched comps best support the ARV.
Projected returns pro-forma
-0.68% appreciation · 0.69% rent growth · sell at horizon
- IRR
- -10.9%
- Equity multiple
- 0.53×
- Total profit
- $-23,197
- Equity at exit
- $44,963
- IRR
- -6.8%
- Equity multiple
- 0.40×
- Total profit
- $-29,534
- Equity at exit
- $49,574
Cash invested: $49,000 (down + closing). Projections, not guarantees.
Landlord ↔ Tenant lean methodology
- Overall (STATE)
- 87 Strongly Landlord-Friendly
- State Texas
- 87 Strongly Landlord-Friendly · R+5
- County
- — inherits STATE
- City
- — inherits STATE
ZIP-level market 77073
- Home prices YoY
- -0.3%
- Rents YoY
- 0.7%
- Active inventory
- 159
- Price-to-rent
- 8.1×
Monthly cashflow live
- Estimated rent
- $1,797 medium interval (Pro) →
- Mortgage (P&I)
- −$918
- Tax from tax record
- −$446 /mo · $5,348/yr
- Insurance
- −$73
- Flood insurance flood zone
- −$66 /mo · $798/yr
- HOA
- −$54
- Vacancy / Maint / Mgmt
- −$377
- Net cashflow
- $-137
Break-even live
UW: 25.0% down · 7.5% · 30yr · 1.5% tax · 5.0% vac · 8.0% maint · 8.0% mgmt
Financing live
Cash to close
- Down payment
- $43,750
- Closing costs
- $5,250
- Reserves months
- —
- Total cash needed
- —
Loan-product check · same deal, 3 products live
Conventional
25% down · 7.5% · 30yr
- Down + closing
- —
- Monthly P&I
- —
- Monthly cashflow
- —
- DSCR
- —
- Eligible?
- —
Personal DTI + credit; lowest rate.
DSCR
20% down · 8.5% · 30yr
- Down + closing
- —
- Monthly P&I
- —
- Monthly cashflow
- —
- DSCR
- —
- Eligible?
- —
No personal income docs; deal must DSCR.
Hard money
10% down · 12.0% · 12mo
- Down + closing
- —
- Monthly P&I
- —
- Monthly cashflow
- —
- DSCR
- —
- Eligible?
- —
Short-term bridge; refi at stabilization.
Rent comps 2 comps
| Address | Beds | Baths | Sqft | Rent | $/sqft | DOM | Units | Dist |
|---|---|---|---|---|---|---|---|---|
| 920 Century Plaza Dr Houston, TX | 3.0–4.0 | 2.0 | 1298 | $1,199 | $0.92 | 1d | 1 | 0.74mi |
| 1514 Glasholm Dr Houston, TX | 3.0 | 2.0 | 1400 | $1,300 | $0.93 | 22d | 1 | 0.86mi |
HOA detail
- Monthly dues
- $54 · $648/yr
Listing history 13 events
-
2026-06-04days on market $175,000 Pending 16 DOM
-
2026-06-03days on market $175,000 Pending 15 DOM
-
2026-06-02days on market $175,000 Pending 14 DOM
-
2026-06-01days on market $175,000 Pending 13 DOM
-
2026-05-31days on market $175,000 Pending 12 DOM
-
2026-05-19$175,000 Active
-
2021-05-03soldstatus
-
2021-04-29soldstatus Sold 408-char remark
Show marketing remark (408 chars)
Charming one story, 3/2/2 home located in the Remington Ranch community. This open concept home features tile floors throughout, a kitchen island, an attached two car garage with a fenced backyard. The Remington Ranch subdivision is surrounded by restaurants, education opportunities, entertainment and shopping. It's location is convenient to George Bush intercontinental Airport, Downton and The Woodlands.
-
2021-04-01status Pending 408-char remark
Show marketing remark (408 chars)
Charming one story, 3/2/2 home located in the Remington Ranch community. This open concept home features tile floors throughout, a kitchen island, an attached two car garage with a fenced backyard. The Remington Ranch subdivision is surrounded by restaurants, education opportunities, entertainment and shopping. It's location is convenient to George Bush intercontinental Airport, Downton and The Woodlands.
-
2021-03-23status Option Pending 408-char remark
Show marketing remark (408 chars)
Charming one story, 3/2/2 home located in the Remington Ranch community. This open concept home features tile floors throughout, a kitchen island, an attached two car garage with a fenced backyard. The Remington Ranch subdivision is surrounded by restaurants, education opportunities, entertainment and shopping. It's location is convenient to George Bush intercontinental Airport, Downton and The Woodlands.
-
2021-03-23status Active 408-char remark
Show marketing remark (408 chars)
Charming one story, 3/2/2 home located in the Remington Ranch community. This open concept home features tile floors throughout, a kitchen island, an attached two car garage with a fenced backyard. The Remington Ranch subdivision is surrounded by restaurants, education opportunities, entertainment and shopping. It's location is convenient to George Bush intercontinental Airport, Downton and The Woodlands.
-
2021-03-16status Option Pending 408-char remark
Show marketing remark (408 chars)
Charming one story, 3/2/2 home located in the Remington Ranch community. This open concept home features tile floors throughout, a kitchen island, an attached two car garage with a fenced backyard. The Remington Ranch subdivision is surrounded by restaurants, education opportunities, entertainment and shopping. It's location is convenient to George Bush intercontinental Airport, Downton and The Woodlands.
-
2021-03-10$145,000 Active 408-char remark
Show marketing remark (408 chars)
Charming one story, 3/2/2 home located in the Remington Ranch community. This open concept home features tile floors throughout, a kitchen island, an attached two car garage with a fenced backyard. The Remington Ranch subdivision is surrounded by restaurants, education opportunities, entertainment and shopping. It's location is convenient to George Bush intercontinental Airport, Downton and The Woodlands.
ⓘ Source: listings_history table (triggers on properties + properties_extension) + one-shot
backfill from property_details.listing_events for pre-trigger history.
Tax reassessment forecast TX · Resets to sale price
- Current annual tax
- $5,348 · $446/mo
- Projected year-2 tax
- $5,348 · $446/mo
- Expected delta
- $0/yr ($0/mo · 0.0%)
ⓘ Screening estimate from a state-policy table — verify with the county assessor before closing.
Climate risk First Street
- Flood 7/10 Severe FEMA zone X (unshaded) · 99% chance over 30 yrs
- Wildfire 1/10 Low
- Heat 9/10 Extreme 7 d/yr ≥110°F today · 25 d/yr by 30 yrs out
- Wind 9/10 Extreme 99% chance of damaging wind over 30 yrs
- Air quality 3/10 Moderate 3 unhealthy d/yr today · 3 by 30 yrs out
Nearby sold comps map
Loading sold comps map…
Walkable amenities ~0.75 mi
Loading nearby amenities…
Taxation est. · year 1
- Rental income
- $21,563
- − Mortgage interest
- −$9,803
- − Property taxes
- −$5,348
- − Insurance
- −$1,672
- − Repairs & maintenance
- −$1,725
- − Management
- −$1,725
- − HOA
- −$648
- − Depreciation
- −$5,091
- Taxable loss
- −$4,449
- Est. tax savings @ 24.0%
- +$1,068
- After-tax cash flow
- $-578/yr
For passive investors: Depreciation is non-cash, so a rental often shows a tax loss while cash-flowing — sheltering income. Rental losses are passive: they offset passive income freely, and up to $25,000/yr can offset ordinary (W-2) income if you actively participate and your MAGI is under $100k (phasing out to $0 by $150k); unused losses carry forward. On sale, claimed depreciation is recaptured at up to 25%, and gains may owe capital-gains tax (a 1031 exchange can defer both). Figures are a year-1 estimate at your 24.0% rate — not tax advice; consult a CPA.
Schools (NCES district)
- District
- Spring ISD
- NCES district ID
- 4841220
- Math proficiency
- 19% ▼ -13.00%
- Reading proficiency
- 26% ▼ -6.00%
- Median HH income
- $51,584
- Composite
- 20.12/100
- National rank
- #8643
- State rank
- #730 of 826 in TX
Livability — Houston
- Score
- 74/100
- State rank
- #184
- US rank
- #4771
Category grades
Schools grade is shown separately in the Schools card above.
Census & demographics
- County
- Harris County · 4,702,590 people
- City population
- 3,226,434
- Metro
- Houston-The Woodlands-Sugar Land, TX
- Population (ZIP)
- 46,084
- Household income
- $78,592
- Rent vs Own
- Severe rent burden
- 1297.0
Population outlook (Harris County) Hauer SSP2
- Today (2025)
- 5,571,493 people
- By 2030
- 6,089,821 · +9.3%
- By 2040
- 7,142,806 · +28.2%
- By 2050
- 8,185,864 · +46.9%
- By 2075
- 10,574,329 · +89.8%
- By 2100
- 12,109,958 · +117.4%
Race, ethnicity, and origin ACS 2023
- Neighborhood character
- Diverse neighborhood (Simpson 0.57)
- Race & ethnicity
- Hispanic / Latino 59% Black 27% Two or more races 24% White 9% Native American 2% Asian 2%
- Hispanic origin (detail)
- Mexican 38% Cuban 2%
- Common ancestry
- Lithuanian 1%
- Foreign-born
- 29% · Canada, Jamaica
- Languages at home
- 44% English-only · Spanish 53% French/Haitian/Cajun 2% Other Indo-European 1%
Political lean MEDSL · Harris
- 2024 margin
- Lean D (+5.5) · D 52.0% · R 46.4% · Other 1.6%
- 2008→2024 swing
- +3.9pp toward D · 2008: 1.6pp · 2024: 5.5pp
- All cycles
- 2024: D+5.5 2020: D+13.3 2016: D+12.4 2012: D+0.1 2008: D+1.6
Not yet ingested
- Civics
- —
Market trends
- HPI YoY
- ▼ -0.68%
- Current HPI
- 215.8688
- Rent YoY
- ▲ 0.69%
- Metro
- Houston-The Woodlands-Sugar Land, TX
- State GDP YoY
- ▲ 3.95%
- F500 in state
- 110
Industry mix (Fortune 500 HQ in TX)
| Industry | F500 HQs | Revenue |
|---|---|---|
| Energy | 16 | $1,198B |
|
||
| Technology | 5 | $198B |
|
||
| Engineering / Construction | 4 | $72B |
|
||
| Energy Services | 3 | $60B |
|
||
| Utilities | 3 | $41B |
|
||
| Healthcare | 2 | $330B |
|
||
Price history
+20.7% since first listed8 events — show timeline
- 2026-05-19 Listed $175,000 HARMLS
- 2021-05-03 Sold (Public Records) — Public Records
- 2021-04-29 Sold (MLS) — HARMLS
- 2021-04-01 Pending — HARMLS
- 2021-03-23 Pending — HARMLS
- 2021-03-23 Relisted — HARMLS
- 2021-03-16 Pending — HARMLS
- 2021-03-10 Listed $145,000 HARMLS
Property tax history
+4.2%/yrLatest (2025): $5,348 · +0.7% YoY. Source: county tax records.
Cash-flow waterfall
monthlySold comps — $/sqft
last 12 mo · ≤1 miLoading sold comps…