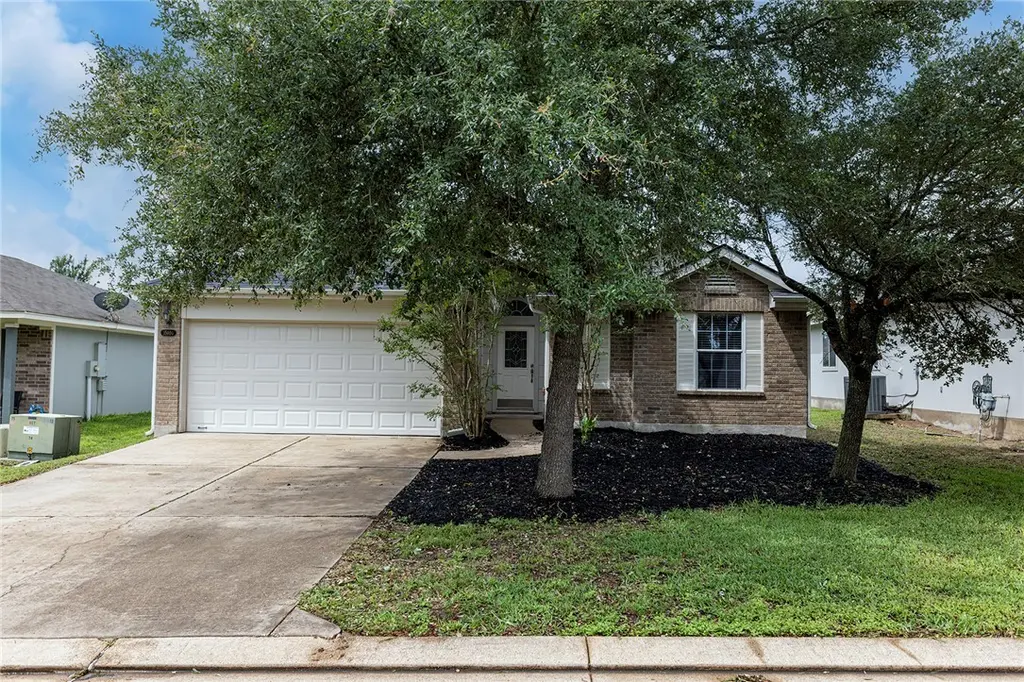
15104 Meredith Ln · College Station, TX
Flood risk 1/10 · Minimal
- FEMA flood zone
- X (unshaded)
- Chance of flooding over 30 yrs
- 0.0%
- Est. flood insurance / yr
- $507 – $1,088
Fire risk 5/10 · Moderate
- Est. fire insurance / yr
- $1,222 – $2,270
Heat risk 8/10 · Major
- Hot days now (above 110°F)
- 7 days/yr
- Hot days in 30 yrs
- 25 days/yr
Wind risk 8/10 · Major
- Chance of severe wind over 30 yrs
- 92.0%
Air-quality risk 1/10 · Minimal
- Unhealthy air days now
- 0 days/yr
- Unhealthy air days in 30 yrs
- 0 days/yr
Risk factors via First Street. Map © Google.
Why this score? — see what drove the D+ grade
The composite is a weighted blend of 9 inputs, each scored 0–100. Each bar is that input's sub-score; the figure is the points it added to the 100-point composite (weight × sub-score).
- ARV discount +12.5/15.0
- Cash flow +11.9/30.0
- Schools +4.7/10.0
- Livability +4.2/5.0
- 1% rule +3.6/10.0
- DSCR +3.5/10.0
- Rent growth +3.3/5.0
- Condition / age +2.5/5.0
- Appreciation +0.0/10.0
$289,000
🖨 Deal sheet (PDF) 📄 Offer letter ✓ Due diligence
Listing remarks
Discover refined comfort at 15104 Meredith Lane in the sought-after Meadowcreek subdivision. This beautifully maintained 4-bedroom, 2-bath home offers 1,703 sq ft of thoughtfully designed living space with exceptional functionality throughout. Fresh interior paint, updated luxury vinyl plank flooring in the entry, formal dining, and living areas, newer bedroom carpet, and updated lighting create a warm yet sophisticated feel. The open-concept layout features split bedrooms for added privacy, two dining areas, and a flexible secondary bedroom adjacent to the primary suite—ideal for a private office or nursery. The inviting living area centers around a fireplace with gas assist and flow
Key facts
- Inviting living area
- Open-concept layout
- 6,250 sq ft lot
Tags
Property features AI
Finance
- HOA & community: Homeowners association with annual fee (about $408.67/year, approx. $34.06/month); Association amenities include pool and maintained grounds
Exterior
- Parking: Attached 2-car garage with garage door opener; 2 covered parking spaces
- Security: Smoke detectors
- Utilities: Public water; Public sewer; Electricity available; Propane available; Cable available; Underground utilities; Ventilation system; Thermostat
- Home design: Single-family residence; One story
- Construction: Brick and HardiPlank exterior; Composition roof; Slab foundation; Built as residential single-family
- Exterior features: Covered patio/porch; Privacy fencing; Community pool; Playground; Maintenance of grounds (association)
Interior
- Kitchen: Dishwasher; Garbage disposal; Gas range; Microwave; Gas water heater
- Flooring: Carpet; Tile; Vinyl
- Bathrooms: 2 full bathrooms
- Heating & cooling: Central heating (natural gas); Central air conditioning (electric); Ceiling fans
- Interior features: Bar; Dry bar; High ceilings; Ceiling fans; Pantry; Window treatments; Gas and wood-burning fireplace
- Laundry & utility: Washer hookup; Water heater
Neighborhood map
What this means for you Summary
Snapshot
- This is a 4-bed/2.0-bath single-family listed at $289k.
Deal economics
- At list price, monthly cash flow is $-72 ($-866/yr) — negative.
- To cash-flow at today's rent, offer at most $276k (4.4% below list).
- To meet the 1% rule (rent ≥ 1% of price), the offer needs to be $249k (13.8% below list).
- Recommended offer: $249k (13.8% below list) — sets the bar for 1% rule.
- Cap rate 6.0% vs local median 3.3% in College Station — top-decile yield for the area; either an underpriced asset or a hidden risk that comps aren't pricing in. Stress-test before assuming the spread holds.
Location & tenants
- Location reads 83/100 on livability (#11 in TX, #994 nationally) — a professional / high-income tenant draw. Strengths: amenities A+, commute A+, crime A-; Watch: employment C-.
- College Station ISD (urban): math 58% / reading 54% proficiency, ranked #113 of 826 in TX (top 14%) — acceptable for families but not a draw, mixed tenant base, ~2y average lease.
- Zoned schools: Greens Prairie El (math 62% / reading 57%, grade B-, #409 of 4,322 statewide, top 10%, 557 students, 14% FRL); College Station Middle (math 51% / reading 56%, grade C+, #275 of 1,662 statewide, top 17%, 645 students, 46% FRL); College Station H S (math 78% / reading 61%, grade B, #119 of 1,632 statewide, top 9%, 2,134 students, 35% FRL).
- Market conditions: Rents rising (+3.1%/yr); 1179 active listings in the ZIP; 5 comparable units currently listed for rent nearby; rentals at typical pace (median 16d on market — plan ~3-4 weeks tenant-placement turnaround); solid renter incomes; 2,211 units permitted in Brazos County in 2024 (768 in 5+ unit buildings).
- This rent runs 34% of the median local income ($89k/yr) — at the standard rent-burdened threshold; future hikes will face affordability resistance.
Forward outlook
- Local home prices are declining (-3.0%/yr); year-one equity from $2k of loan paydown is wiped out by about $9k of value loss. Plan a longer hold.
- Brazos County population projected at +55% by 2050 — long-run rental-demand tailwind backs the buy-and-hold thesis.
Negotiation context
- It's been on market 16 days — a 2% lower offer ($285k) is reasonable based on typical stale-listing flexibility.
- 5 sale attempts since 10y ago with the ask held roughly flat each time — persistent listings suggest the price (not the market) is what's stuck; bring a comps-based counter.
Risks & watch-outs
- Climate carrying-cost: severe wind risk, 92% chance of damaging wind over 30y; moderate wildfire risk; extreme-heat days projected 7→25/yr by 2055 (HVAC capex compounding) — expect insurance premiums to compound above CPI over the hold.
Questions for the listing agent
- What do current leases actually rent for vs. the listed asking? Can we see a recent rent roll and the last 12 months of T-12 income?
- What does the HOA fee cover, when was the last increase, and are there any pending special assessments or reserve-fund shortfalls?
- Is there a deadline driving the sale (1031 exchange, divorce, estate, relocation)? That informs how much negotiation room exists.
- Schools are B-rated — typically a magnet for longer-tenancy family renters. What's the average tenant stay here, and is there a school-zone premium baked into asking?
- The area grade is low — what's the realistic commute time and amenity access for the typical tenant pool here? Any planned neighborhood developments (good or bad) we should know about?
- What's the average days-on-market for RENTAL listings here right now (not sales)? A rising rental-DOM trend means longer vacancies and softer asking-rent achievability than the comps imply.
- What's the recent tenant-quality profile in this submarket — average credit score on applications, eviction rate, late-payment / NSF rate, and stable-employment percentage? A property-management company in the area should have these aggregated.
- How much new for-sale + rental construction is in the pipeline within 1–3 miles? Heavy new supply typically softens prices + rents 12–24 months out; constrained supply supports both.
Investment metrics
- 1% rule
- 0.86% ✗
- Cap rate
- 5.99%
- Cash-on-cash
- -1.07%
- DSCR
- 0.95
- GRM
- 9.7
CMA / ARV
- ARV (on-the-fly)
- $325,273
- Comps found
- 4
Show comp detail 4 sales within ~0.75 mi
| Address | Dist | Beds/Ba | Sqft | Sold | Price | $/sf | Match |
|---|---|---|---|---|---|---|---|
| 15121 Meredith Ln | 0.08mi | 3/2.5 (-1) | 1,597 (-6%) | 3mo | $263,500 | $165 | 77 |
| 5131 Stewart Dr | 0.35mi | 3/2.0 (-1) | 1,610 (-6%) | 8mo | $315,000 | $196 | 63 |
| 15230 Meredith Ln | 0.32mi | 3/2.0 (-1) | 1,814 (+6%) | 23mo | $275,000 | $152 | 50 |
| 5284 Sagewood Ct | 0.41mi | 3/2.0 (-1) | 1,546 (-9%) | 13mo | $295,000 | $191 | 50 |
Match score weights: distance 35% · size 25% · config 20% · recency 20%. Top-matched comps best support the ARV.
Projected returns pro-forma
-3.0% appreciation · 3.13% rent growth · sell at horizon
- IRR
- -17.9%
- Equity multiple
- 0.37×
- Total profit
- $-51,037
- Equity at exit
- $43,091
- IRR
- -9.8%
- Equity multiple
- 0.40×
- Total profit
- $-48,759
- Equity at exit
- $24,987
Cash invested: $80,920 (down + closing). Projections, not guarantees.
Landlord ↔ Tenant lean methodology
- Overall (STATE)
- 87 Strongly Landlord-Friendly
- State Texas
- 87 Strongly Landlord-Friendly · R+5
- County
- — inherits STATE
- City
- — inherits STATE
ZIP-level market 77845
- Rents YoY
- 3.1%
- Active inventory
- 1179
- Price-to-rent
- 9.7×
Monthly cashflow live
- Estimated rent
- $2,491 medium interval (Pro) →
- Mortgage (P&I)
- −$1,516
- Tax from tax record
- −$370 /mo · $4,438/yr
- Insurance
- −$120
- HOA
- −$34
- Vacancy / Maint / Mgmt
- −$523
- Net cashflow
- $-72
Break-even live
Sensitivity live
| Price | -10% $91 | -5% $10 | +0% $-72 | +5% $-154 | +10% $-236 |
|---|---|---|---|---|---|
| Rent | -10% $-269 | -5% $-171 | +0% $-72 | +5% $26 | +10% $125 |
| Rate | -1.0pp $73 | -0.5pp $1 | base $-72 | +0.5pp $-147 | +1.0pp $-223 |
UW: 25.0% down · 7.5% · 30yr · 1.5% tax · 5.0% vac · 8.0% maint · 8.0% mgmt
Financing live
Cash to close
- Down payment
- $72,250
- Closing costs
- $8,670
- Reserves months
- —
- Total cash needed
- —
Loan-product check · same deal, 3 products live
Conventional
25% down · 7.5% · 30yr
- Down + closing
- —
- Monthly P&I
- —
- Monthly cashflow
- —
- DSCR
- —
- Eligible?
- —
Personal DTI + credit; lowest rate.
DSCR
20% down · 8.5% · 30yr
- Down + closing
- —
- Monthly P&I
- —
- Monthly cashflow
- —
- DSCR
- —
- Eligible?
- —
No personal income docs; deal must DSCR.
Hard money
10% down · 12.0% · 12mo
- Down + closing
- —
- Monthly P&I
- —
- Monthly cashflow
- —
- DSCR
- —
- Eligible?
- —
Short-term bridge; refi at stabilization.
Rent comps 5 comps
| Address | Beds | Baths | Sqft | Rent | $/sqft | DOM | Units | Dist |
|---|---|---|---|---|---|---|---|---|
| 5291 Dymple Ln Unit 1328083P College Station, TX | 3.0 | 2.0 | 1205 | $4,779 | $3.97 | 0d | 1 | 1.01mi |
| 4206 Carnes Ct S College Station, TX | 3.0 | 2.0 | 1840 | $2,300 | $1.25 | 15d | 1 | 1.07mi |
| 15232 Still Water Meadow Loop College Station, TX | 3.0 | 2.0 | 1433 | $2,300 | $1.61 | 45d | 1 | 1.19mi |
| 15605 Long Creek Ln College Station, TX | 3.0 | 2.0 | 1844 | $2,400 | $1.30 | 22d | 1 | 1.47mi |
| 15605 Long Creek Ln College Station, TX | 3.0 | 2.0 | 1844 | $2,500 | $1.36 | 15d | 1 | 1.47mi |
HOA detail
- Monthly dues
- $34 · $408/yr
- Likely covers
- gas
Listing history 27 events
-
2026-06-21days on market $289,000 Active 16 DOM
-
2026-06-18days on market $289,000 Active 13 DOM
-
2026-06-17days on market $289,000 Active 12 DOM
-
2026-06-16days on market $289,000 Active 11 DOM
-
2026-06-15days on market $289,000 Active 10 DOM
-
2026-06-14days on market $289,000 Active 8 DOM
-
2026-06-13days on market $289,000 Active 7 DOM
-
2026-06-10days on market $289,000 Active 5 DOM
-
2026-06-09days on market $289,000 Active 4 DOM
-
2026-06-08days on market $289,000 Active 3 DOM
-
2026-06-07days on market $289,000 Active 2 DOM
-
2026-06-05days on market $289,000 Active 14 DOM
-
2026-06-02days on market $289,000 Active 12 DOM
-
2026-06-01days on market $289,000 Active 11 DOM
-
2026-05-31days on market $289,000 Active 10 DOM
-
2026-05-30days on market $289,000 Active 9 DOM
-
2026-05-21$289,000 Active
-
2025-04-16price $299,000
-
2025-02-11$305,000 Active
-
2024-11-24price $315,000
-
2024-10-24price $320,000
-
2024-10-03status Active
-
2024-10-03status Pending
-
2024-09-25$325,000 Active
-
2016-07-06soldstatus
-
2016-07-05soldstatus
-
2016-04-01$189,500
ⓘ Source: listings_history table (triggers on properties + properties_extension) + one-shot
backfill from property_details.listing_events for pre-trigger history.
Tax reassessment forecast TX · Resets to sale price
- Current annual tax
- $4,438 · $370/mo
- Projected year-2 tax
- $5,289 · $441/mo
- Expected delta
- +$851/yr (+$71/mo · 19.2%)
ⓘ Screening estimate from a state-policy table — verify with the county assessor before closing.
Climate risk First Street
- Flood 1/10 Low FEMA zone X (unshaded) · 0% chance over 30 yrs
- Wildfire 5/10 Major
- Heat 8/10 Severe 7 d/yr ≥110°F today · 25 d/yr by 30 yrs out
- Wind 8/10 Severe 92% chance of damaging wind over 30 yrs
- Air quality 1/10 Low 0 unhealthy d/yr today · 0 by 30 yrs out
Nearby sold comps map
Loading sold comps map…
Walkable amenities ~0.75 mi
Loading nearby amenities…
Taxation est. · year 1
- Rental income
- $29,888
- − Mortgage interest
- −$16,188
- − Property taxes
- −$4,438
- − Insurance
- −$1,445
- − Repairs & maintenance
- −$2,391
- − Management
- −$2,391
- − HOA
- −$408
- − Depreciation
- −$8,407
- Taxable loss
- −$5,781
- Est. tax savings @ 24.0%
- +$1,387
- After-tax cash flow
- $521/yr
For passive investors: Depreciation is non-cash, so a rental often shows a tax loss while cash-flowing — sheltering income. Rental losses are passive: they offset passive income freely, and up to $25,000/yr can offset ordinary (W-2) income if you actively participate and your MAGI is under $100k (phasing out to $0 by $150k); unused losses carry forward. On sale, claimed depreciation is recaptured at up to 25%, and gains may owe capital-gains tax (a 1031 exchange can defer both). Figures are a year-1 estimate at your 24.0% rate — not tax advice; consult a CPA.
Schools (NCES district)
- District
- College Station ISD
- NCES district ID
- 4807350
- Math proficiency
- 58% ▼ -4.00%
- Reading proficiency
- 54% ▼ -2.00%
- Median HH income
- $36,991
- Composite
- 46.54/100
- National rank
- #2428
- State rank
- #113 of 826 in TX
Livability — College Station
- Score
- 83/100
- State rank
- #11
- US rank
- #994
Category grades
Schools grade is shown separately in the Schools card above.
Census & demographics
- County
- Brazos County · 233,400 people
- City population
- 131,628
- Metro
- College Station-Bryan, TX
- Population (ZIP)
- 76,764
- Household income
- $88,851
- Rent vs Own
- Severe rent burden
- 3329.0
Population outlook (Brazos County) Hauer SSP2
- Today (2025)
- 267,942 people
- By 2030
- 296,630 · +10.7%
- By 2040
- 354,560 · +32.3%
- By 2050
- 414,616 · +54.7%
- By 2075
- 562,158 · +109.8%
- By 2100
- 678,828 · +153.3%
Race, ethnicity, and origin ACS 2023
- Neighborhood character
- Predominantly White (69%)
- Race & ethnicity
- White 69% Hispanic / Latino 16% Two or more races 9% Asian 8% Black 5%
- Hispanic origin (detail)
- Mexican 12%
- Common ancestry
- Lithuanian 2% Romanian 2% Italian 2%
- Foreign-born
- 11% · Canada, China, South Korea
- Languages at home
- 83% English-only · Spanish 8% Other Indo-European 3% Chinese 2%
Political lean MEDSL · Brazos
- 2024 margin
- Strong R (+24.9) · D 36.9% · R 61.7% · Other 1.4%
- 2008→2024 swing
- +4.1pp toward D · 2008: -28.9pp · 2024: -24.9pp
- All cycles
- 2024: R+24.9 2020: R+14.3 2016: R+23.7 2012: R+35.3 2008: R+28.9
Not yet ingested
- Civics
- —
Market trends
- HPI YoY
- ▼ -133.31%
- Current HPI
- 175.9669
- Rent YoY
- ▲ 3.13%
- Metro
- College Station-Bryan, TX
- State GDP YoY
- ▲ 3.95%
- F500 in state
- 110
Industry mix (Fortune 500 HQ in TX)
| Industry | F500 HQs | Revenue |
|---|---|---|
| Energy | 16 | $1,198B |
|
||
| Technology | 5 | $198B |
|
||
| Engineering / Construction | 4 | $72B |
|
||
| Energy Services | 3 | $60B |
|
||
| Utilities | 3 | $41B |
|
||
| Healthcare | 2 | $330B |
|
||
Price history
+52.5% since first listed11 events — show timeline
- 2026-05-21 Listed $289,000 BCSRMLS
- 2025-04-16 Price Changed $299,000 BCSRMLS
- 2025-02-11 Listed $305,000 BCSRMLS
- 2024-11-24 Price Changed $315,000 BCSRMLS
- 2024-10-24 Price Changed $320,000 BCSRMLS
- 2024-10-03 Relisted — BCSRMLS
- 2024-10-03 Pending — BCSRMLS
- 2024-09-25 Listed $325,000 BCSRMLS
- 2016-07-06 Sold (Public Records) — Public Records
- 2016-07-05 Sold (MLS) — BCSRMLS
- 2016-04-01 Listed $189,500 BCSRMLS
Property tax history
+3.8%/yrLatest (2025): $4,438 · +6.4% YoY. Source: county tax records.
Cash-flow waterfall
monthlySold comps — $/sqft
last 12 mo · ≤1 miLoading sold comps…